1) Problem motivation and usage scenarios
In a recent project, the required function is to use the mouse to add nodes (the position where the mouse clicks is the node coordinates), and the point coordinates can be displayed visually and dynamically after being added.
2) Problem solving process
In ordinary python drawing, my commonly used tool is matplotlib. However, it seems that it can not achieve the functions I need. It feels that matplotlib completely depends on data-driven (that is, it can draw pictures by providing data), but it can not realize the two-way interaction between users and graphics (that is, users can generate new points by clicking with the mouse). After a search, I found that pyqt seemed to meet my needs, and I could find some relevant code. I learned from the online code, combined with my own needs, and finally realized the functions I needed.
3) Requirements framework and ideas
My requirements are mainly divided into the following parts:
1) Given the node coordinates, it can be displayed in the form of scatter diagram. This pyqtgraph library is implemented. The key step codes are as follows.
# Create a PlotWidget object
self.pw = pg.PlotWidget()
# Gets the scatter plot object
self.scatter = self.pw.plot(pen=None, symbol='o')
# Give the X and Y coordinates of points and draw a scatter diagram
self.scatter.setData(self.x, self.y)
2) After the number of nodes or coordinates change, the position can be updated in real time.
# Start the timer and notify to refresh the data every 100ms
self.timer = QtCore.QTimer()
self.timer.timeout.connect(self.updateData)
self.timer.start(100)
3) Left click the drawing interface to add a new point. This part bothers me most. I haven't used pyqt before, so I don't know how to capture the mouse click signal, let alone extract the corresponding position coordinates. In practice, I also divide this part into two steps: a) capture the mouse click signal. The main code is as follows:
# Capture mouse click events
self.scatter.scene().sigMouseClicked.connect(self.mouse_clicked)
# After capturing the click event, you need to do the action in mouse_ Completed in the clicked function
def mouse_clicked(self,event):
    self.x.append(self.new_point_x)
    self.y.append(self.new_point_y)
b) Get the coordinates corresponding to the graphic position when the mouse clicks. Here I encountered a pit. Normally, the return value of sigMouseClicked is an event, which contains the coordinates of the click time, but this coordinate is inaccurate, which is somewhat different from the actual position. After testing, the coordinates extracted by moving the mouse event are accurate. So in the whole program, I used two trigger events, one is mouse click and the other is mouse movement. The main codes of mouse movement are as follows:
# Capture mouse movement events
self.scatter.scene().sigMouseMoved.connect(self.mouseover)
# After capturing the click event, the actions to be done are completed in the mouseover function, mainly extracting the coordinates of the points
def mouseover(self,pos):
    # The parameter pos is a pixel coordinate, which needs to be converted into a scale coordinate
    act_pos = self.scatter.mapFromScene(pos)
    if type(act_pos) != QtCore.QPointF:
        return
    # print("over_1:",act_pos.x(), act_pos.y())
    self.new_point_x = act_pos.x()
    self.new_point_y = act_pos.y()
4) Summary
The above is all the ideas to solve my needs. All complete codes are as follows, which can be used directly after copying:
# Capture mouse movement events
self.scatter.scene().sigMouseMoved.connect(self.mouseover)
# After capturing the click event, the actions to be done are completed in the mouseover function, mainly extracting the coordinates of the points
from PySide2 import QtGui, QtWidgets, QtCore
# from pyqtgraph.Qt import  QtCore
import pyqtgraph as pg
import sys
from random import randint
import numpy as np

FieldRadius = 100

class MainWindow(QtWidgets.QMainWindow):
    def __init__(self):
        super().__init__()
        self.setWindowTitle('pyqtgraph Mapping')
        # Create a PlotWidget object
        self.pw = pg.PlotWidget()
        # Set chart title
        self.pw.setTitle("Node distribution diagram",
                         color='008080',
                         size='12pt')
        # Set the upper, lower, left and right label s
        self.pw.setLabel("left","Ordinate")
        self.pw.setLabel("bottom","Abscissa")

        self.pw.setXRange(min=0,  # minimum value
                          max=FieldRadius)  # Maximum
        # Set Y-axis scale range
        self.pw.setYRange(min=0,  # minimum value
                          max=FieldRadius)  # Maximum
        # Show table lines
        self.pw.showGrid(x=True, y=True)
        # Change the background color to white
        self.pw.setBackground('w')
        # Center the PlotWidget
        self.setCentralWidget(self.pw)

        # The real-time display should obtain the PlotDataItem object and call its setData method,
        # In this way, only the curve is re plot ted, and the performance is higher
        self.scatter = self.pw.plot(pen=None, symbol='o')

        self.i = 0
        self.x = [] # Value of x-axis
        self.new_point_x = 0
        self.y = [] # Value of y-axis
        self.new_point_y = 0

        self.setMouseTracking(False)
        self.scatter.scene().sigMouseMoved.connect(self.mouseover)
        self.scatter.scene().sigMouseClicked.connect(self.mouse_clicked)

        # Start the timer and notify to refresh the data every 1 second
        self.timer = QtCore.QTimer()
        self.timer.timeout.connect(self.updateData)
        self.timer.start(100)

    def updateData(self):
        self.scatter.setData(self.x, self.y)

    # Mouse movement event, used to obtain accurate coordinates (as if the coordinates clicked by the mouse were inaccurate)
    def mouseover(self,pos):
        # The parameter pos is a pixel coordinate, which needs to be converted into a scale coordinate
        act_pos = self.scatter.mapFromScene(pos)
        if type(act_pos) != QtCore.QPointF:
            return
        # print("over_1:",act_pos.x(), act_pos.y())
        self.new_point_x = act_pos.x()
        self.new_point_y = act_pos.y()

    # Mouse click event is used to process events after mouse click, including:
    # 1) Add new coordinates
    def mouse_clicked(self,event):

        self.x.append(self.new_point_x)
        self.y.append(self.new_point_y)
        # print("my position is:",self.xx,self.yy)

if __name__ == '__main__':
    app = QtWidgets.QApplication()
    main = MainWindow()
    main.show()
    app.exec_()
My experimental results: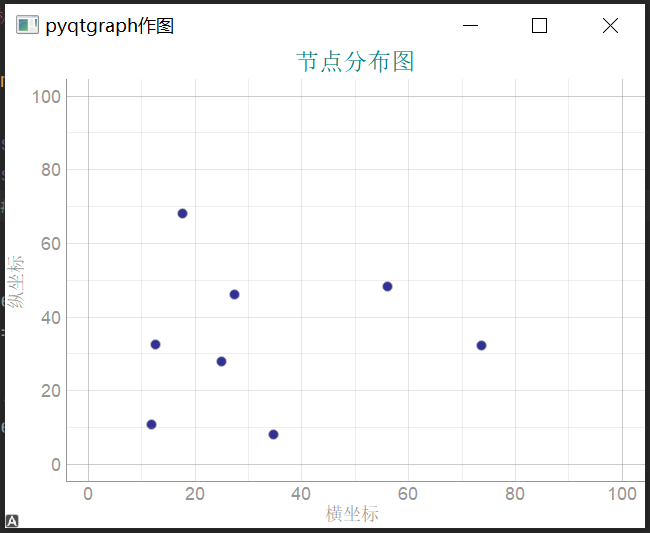
[1] Main reference website White moon black feather