Reference resources https://blog.51cto.com/14157628/2473866?source=dra
Before deploying Prometheus, due to the low configuration of the experimental environment, the original dashboard and Scope were deleted!
Before you actually deploy Prometheus, you should understand the relationships and functions among the components of Prometheus:
1) Mericserver: it is the aggregator of resource usage of k8s cluster, collecting data for use in k8s cluster, such as kubectl, hpa,scheduler;
2) Prometheus operator: it is a system detection and alarm toolbox used to store monitoring data;
3) NodeExporter: used for the status data of key metrics of each node;
4) kubeStateMetrics: collect resource object data in k8s cluster, and specify alarm rules;
5) Prometheus: collect the data of apiserver, scheduler, controller manager and kubelet components in pull mode, and transfer it through http protocol;
6) Grafana: it is a visual data statistics and monitoring platform;
1) Get yaml file modify and execute
Note: Prometheus deployed here is not provided by Prometheus official website, but the Prometheus project provided by coreos.
As shown in the picture: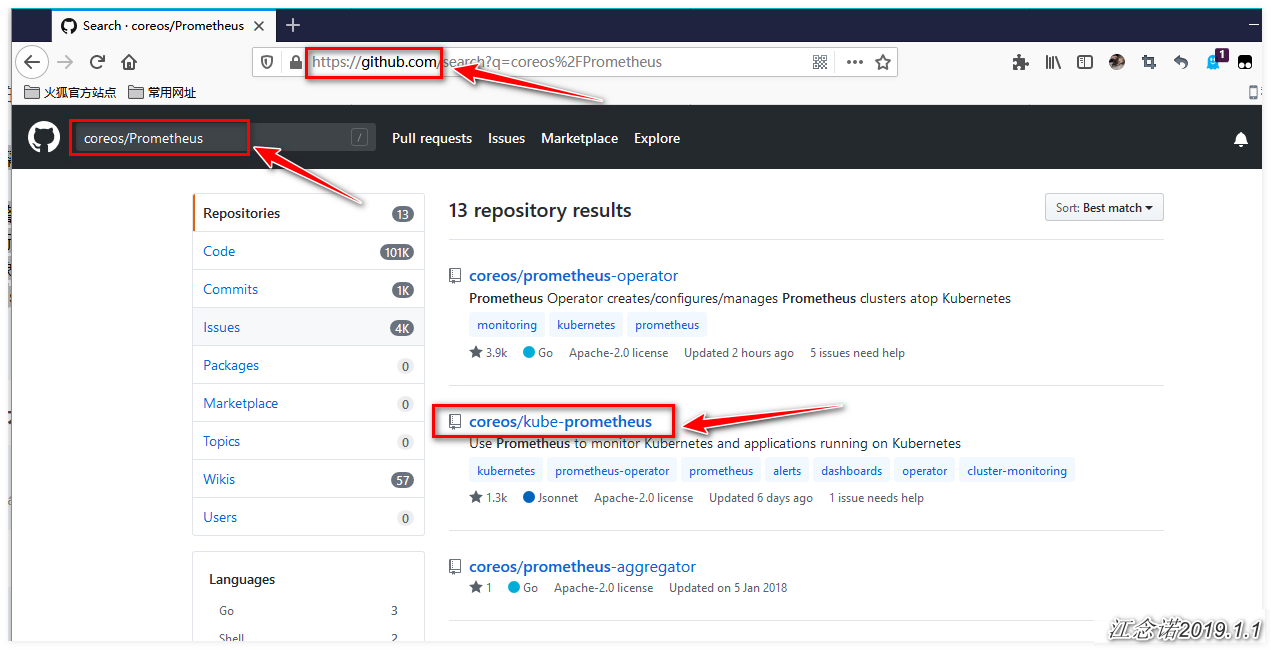
Modify the image address of the following file quay.io/ and replace it with quay-mirror.qiniu.com/
setup/prometheus-operator-deployment.yaml
prometheus-adapter-deployment.yaml
prometheus-prometheus.yaml
node-exporter-daemonset.yaml
alertmanager-alertmanager.yaml
kube-state-metrics-deployment.yaml
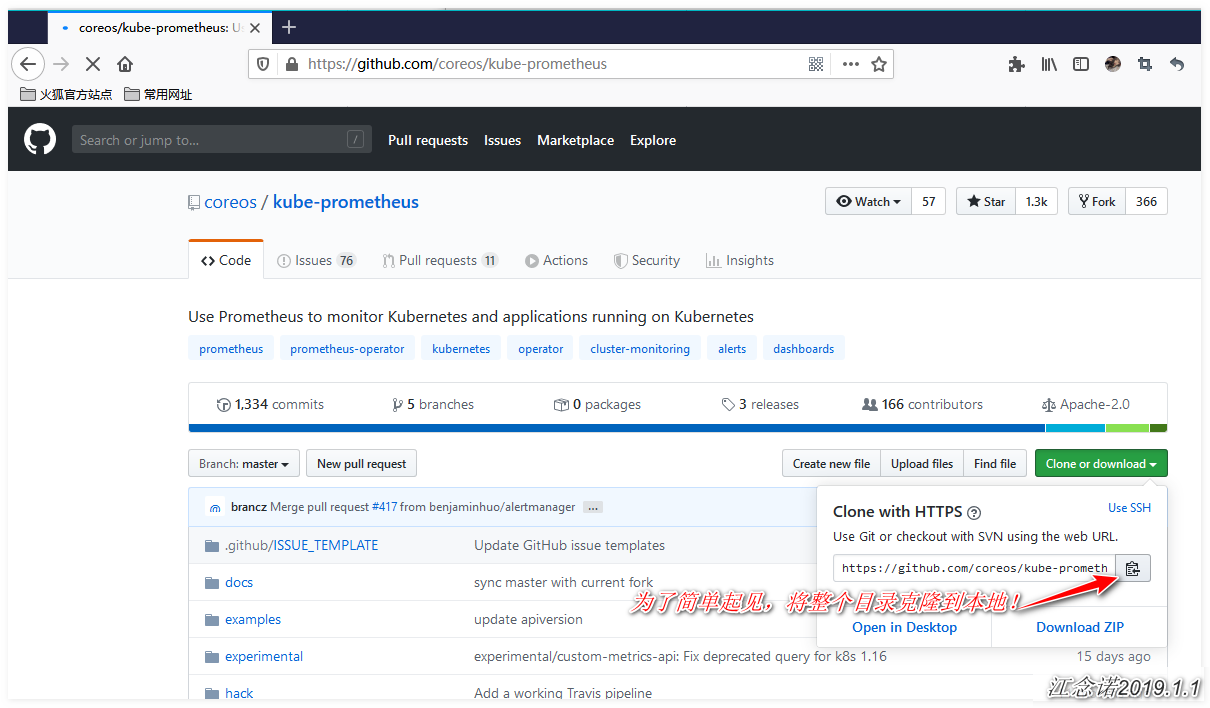
[root@master ~]# git clone https://github.com/coreos/kube-prometheus.git
#Clone project to local
[root@master ~]# cd kube-prometheus/manifests/
[root@master manifests]# vim grafana-service.yaml
#Change the type of service resource corresponding to the grafana resource and the mapped port
apiVersion: v1
kind: Service
metadata:
  labels:
    app: grafana
  name: grafana
  namespace: monitoring
spec:
  type: NodePort               #Add NodePort as type
  ports:
  - name: http
    port: 3000
    targetPort: http
    nodePort: 31010          #Custom mapped port
  selector:
    app: grafana
[root@master manifests]# vim alertmanager-service.yaml
#Change the type of service resource corresponding to the alertmanager resource and the mapped port
apiVersion: v1
kind: Service
metadata:
  labels:
    alertmanager: main
  name: alertmanager-main
  namespace: monitoring
spec:
  type: NodePort               #Add NodePort as type
  ports:
  - name: web
    port: 9093
    targetPort: web
    nodePort: 31020          #Custom mapped port
  selector:
    alertmanager: main
    app: alertmanager
  sessionAffinity: ClientIP
[root@master manifests]# vim prometheus-service.yaml
#Change the type of service resource corresponding to prometheus resource and mapped port
apiVersion: v1
kind: Service
metadata:
  labels:
    prometheus: k8s
  name: prometheus-k8s
  namespace: monitoring
spec:
  type: NodePort               #Add NodePort as type
  ports:
  - name: web
    port: 9090
    targetPort: web
    nodePort: 31030          #Custom mapped port
  selector:
    app: prometheus
    prometheus: k8s
  sessionAffinity: ClientIP
[root@master manifests]# pwd          #Confirm the current directory
/root/kube-prometheus/manifests
[root@master manifests]# kubectl apply -f setup/
#All yaml files under the setup directory must be executed first
[root@master manifests]# cd ..          #Return to the upper directory
[root@master kube-prometheus]# pwd        #Confirm directory location
/root/kube-prometheus
[root@master kube-prometheus]# kubectl apply -f manifests/
#Execute all yaml files in this directory
[root@master kube-prometheus]# kubectl get pod -n monitoring
#Make sure all pods in the namespace are Running
[root@master kube-prometheus]# kubectl get svc -n monitoring | grep grafana
#View the port mapped by the service resource corresponding to the grafana resource
grafana                 NodePort    10.97.56.230    <none>        3000:31010/TCP               16m
The image download of the pod used is slow. In a word, network stability is not a problem!
You can also use my download link: https://pan.baidu.com/s/1UZ-9Cii_JDdn9a8mnDhWfA
Extraction code: aijm
Browser access: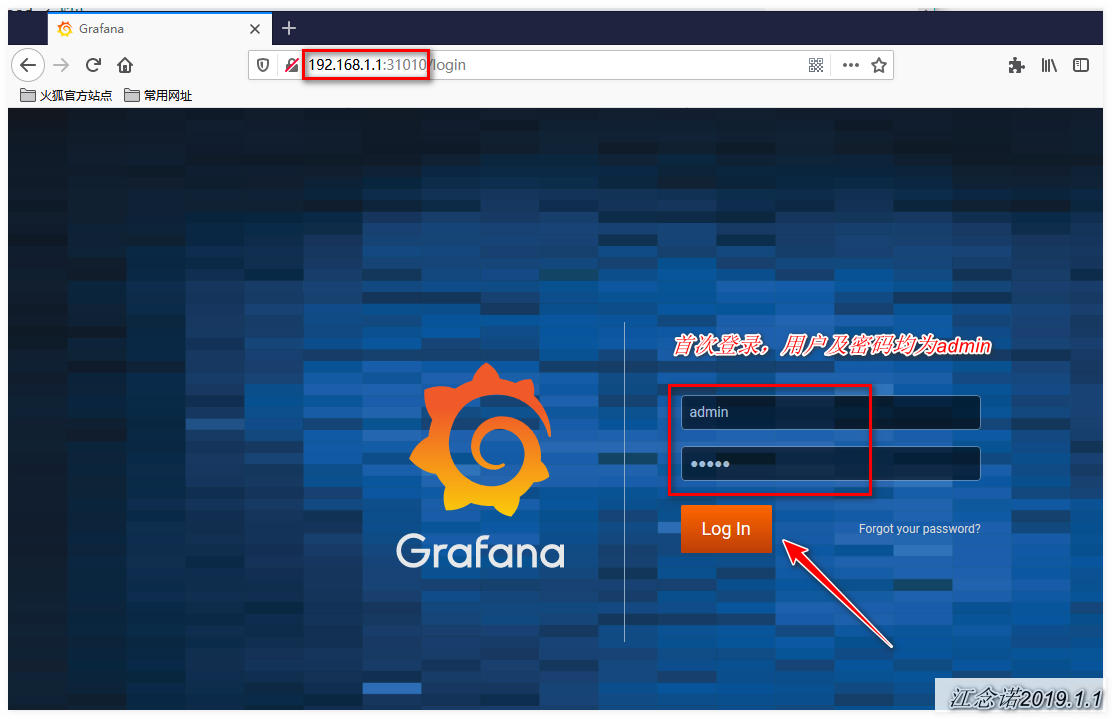
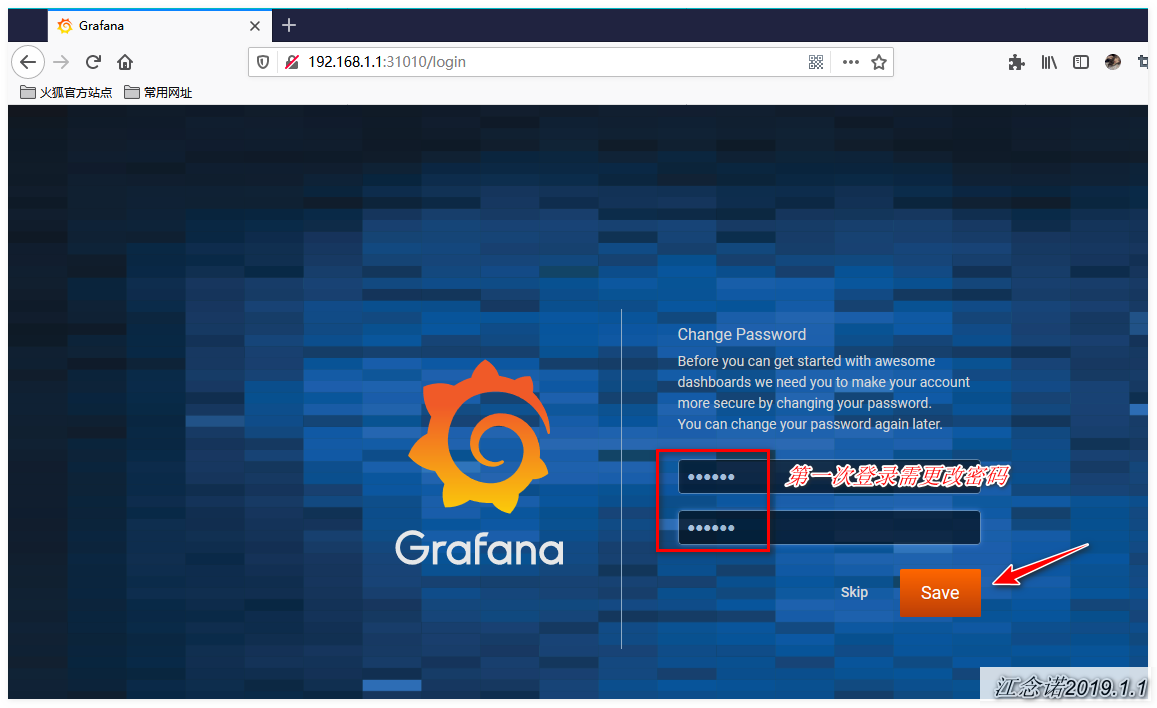
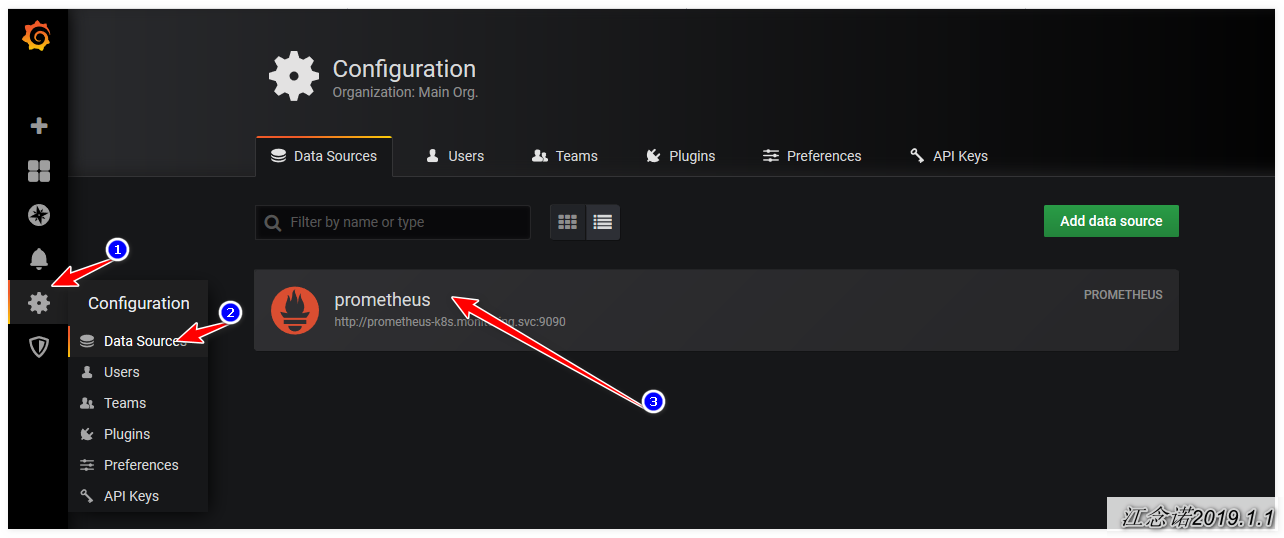
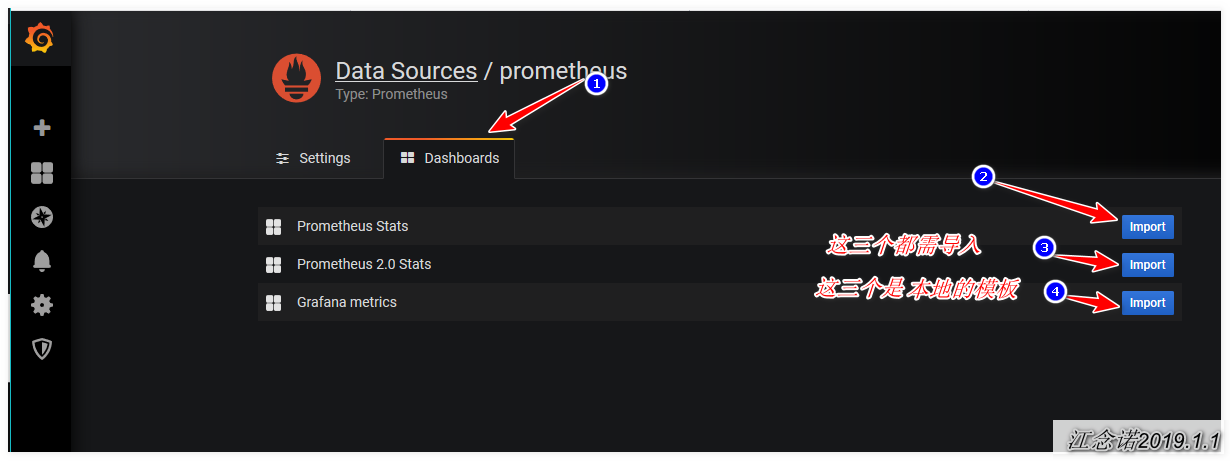
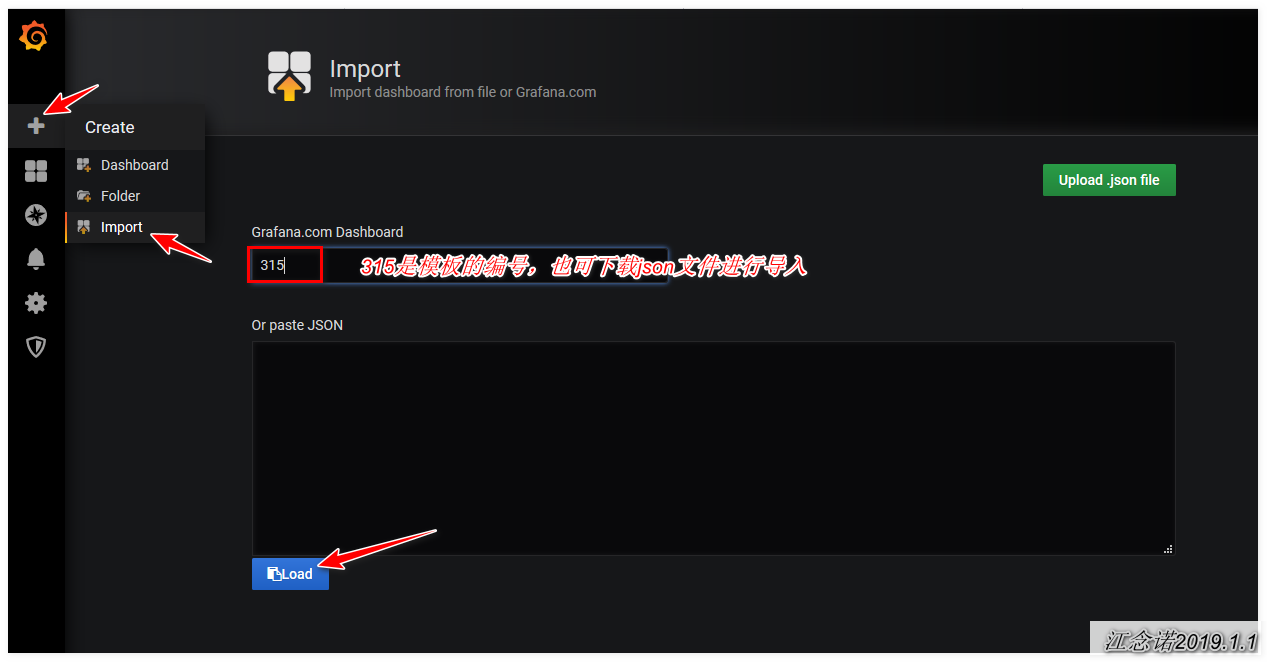
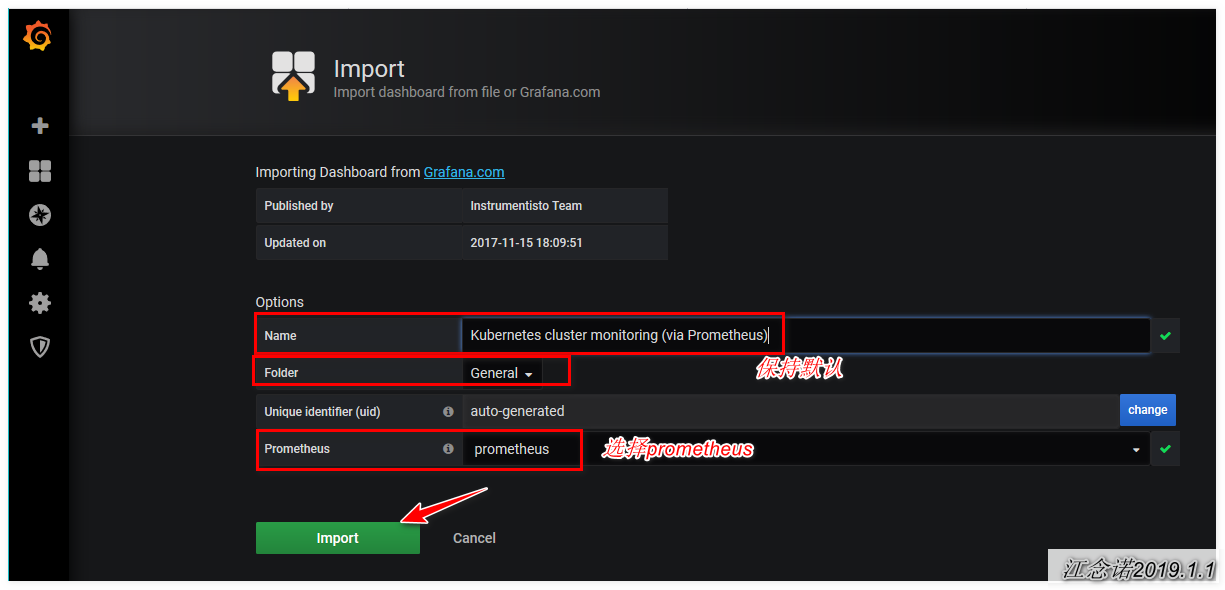
The native template is a little low, so next import a nice template!
Template download address: https://grafana.com/dashboards Check by yourself!
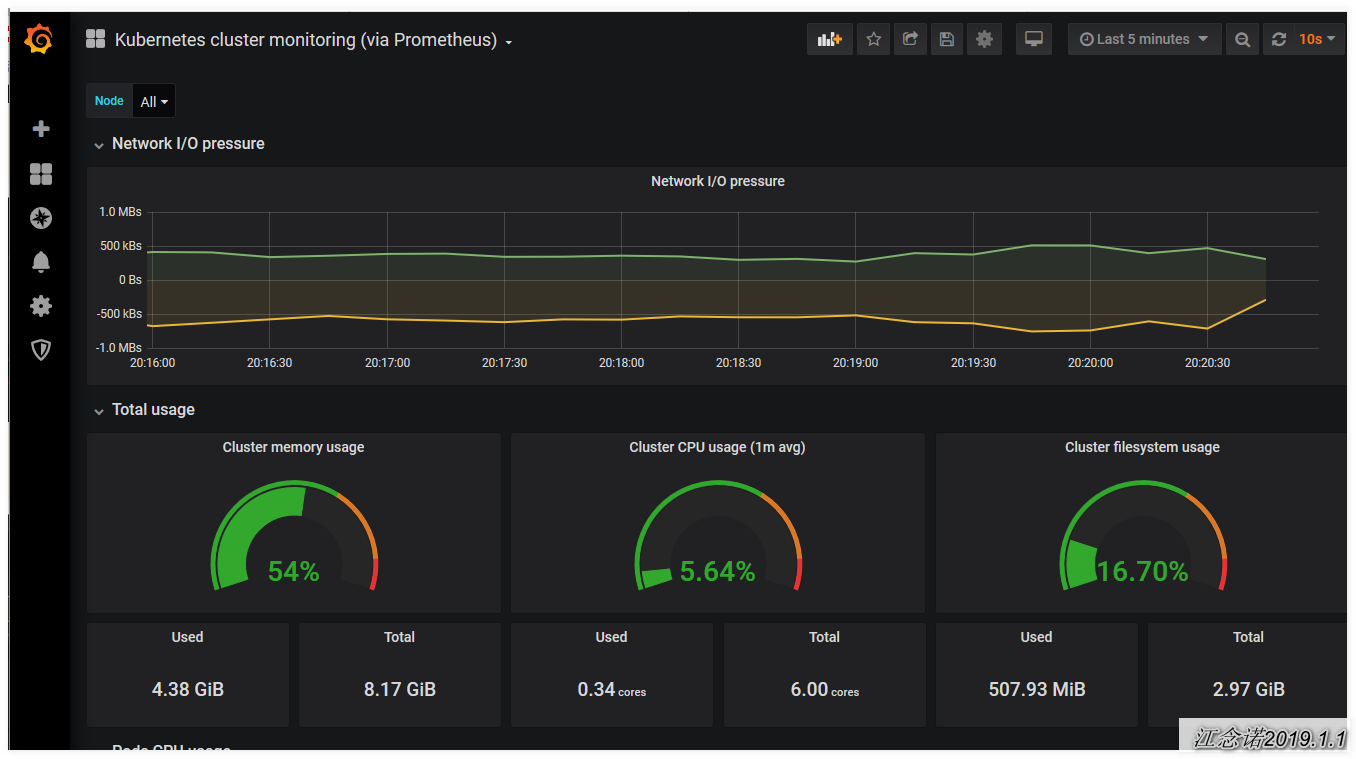
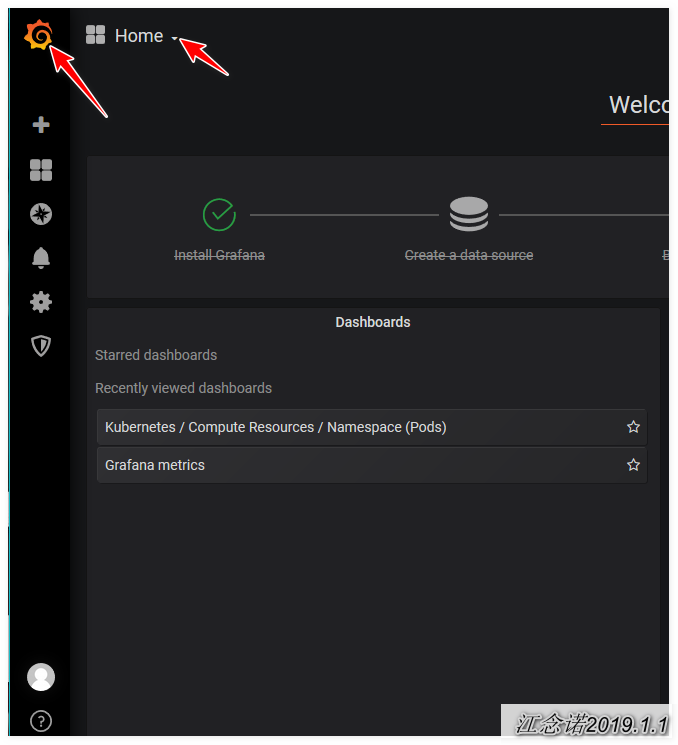
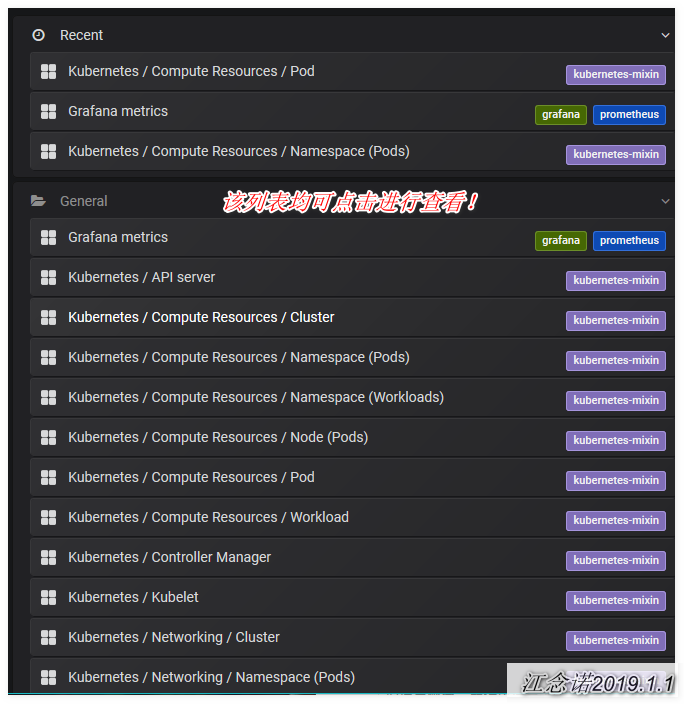
With the success, you can see the cool monitoring page.