Prometheus service is installed by default, service address: 192.168.56.200
I. obtain snmp information of the switch
snmp service IP (switch IP): 172.20.2.83
snmp community: dfetest
II. Deploy SNMP exporter
2.1 download SNMP ﹐ exporter
Download the SNMP exporter installation package at: https://github.com/prometheus/snmp_exporter/releases
After downloading, upload to the / usr/local directory of the machine

Unzip the installation package
#   tar -zvxf snmp_exporter-0.15.0.linux-arm64.tar.gz
#   mv snmp_exporter-0.15.0.linux-arm64/ snmp_exporter
2.2 configure SNMP ﹐ exporter
The configuration file of SNMP ﹣ exporter needs to be compiled and generated by itself through SNMP Exporter Config Generator project,
Reference method: https://github.com/prometheus/snmp_exporter/tree/master/generator#file-format
Because Prometheus is developed in go language, the configuration file of SNMP ﹐ exporter compiled by oneself needs go environment. For the installation of go environment in Linux, please refer to: https://www.cnblogs.com/guoxiangyue/p/11772717.html Install go environment section in
After the go environment is installed, build the snmp exporter config Generator and do the following:
#  yum -y install git
#  yum -y install gcc gcc-g++ make net-snmp net-snmp-utils net-snmp-libs net-snmp-devel
#  go get github.com/prometheus/snmp_exporter/generator
#  cd ${GOPATH-$HOME/go}/src/github.com/prometheus/snmp_exporter/generator
#  go build
#  make mibs
After compiling, modify the generator.yml file in the current directory. For the configuration of the generator.yml file, please refer to https://github.com/prometheus/snmp'exporter/tree/master/generator'file-format. The generator.yml file only needs to inject SNMP's community, and only the modules.if'mib.auth field is modified below File Format Consistent with.
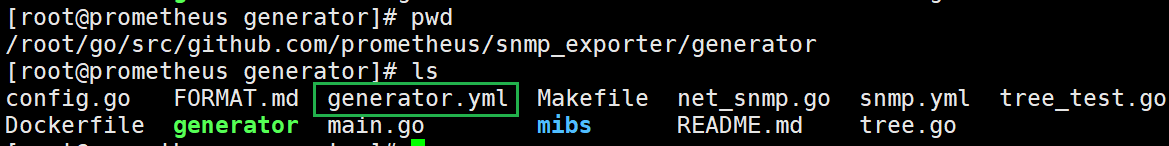
# vim generator.yml
module.if_mib.auth field in generator.yml:
modules:
  # Default IF-MIB interfaces table with ifIndex.
  if_mib:
    walk: [sysUpTime, interfaces, ifXTable]
    version: 1
    auth:
      community: dfetest
    lookups:
      - source_indexes: [ifIndex]
        lookup: ifAlias
      - source_indexes: [ifIndex]
        lookup: ifDescr
      - source_indexes: [ifIndex]
        # Use OID to avoid conflict with Netscaler NS-ROOT-MIB.
        lookup: 1.3.6.1.2.1.31.1.1.1.1 # ifName
    overrides:
      ifAlias:
        ignore: true # Lookup metric
      ifDescr:
        ignore: true # Lookup metric
      ifName:
        ignore: true # Lookup metric
      ifType:
        type: EnumAsInfo
After modification, save and exit, and perform the following operations to generate a new snmp.yml file
#   export MIBDIRS=mibs
#   ./generator generate

Replace the newly generated snmp.yml with the snmp.yml in the original SNMP
# cp snmp.yml /usr/local/snmp_exporter
2.3 verify and set the SNMP ﹣ exporter service to start
#   cd /usr/local/snmp_exporter
#   ./snmp_exporter

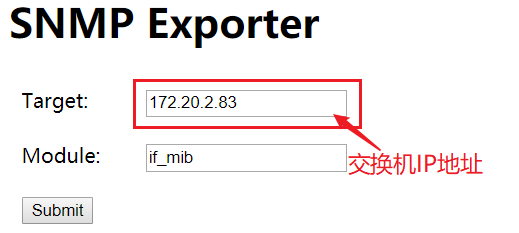
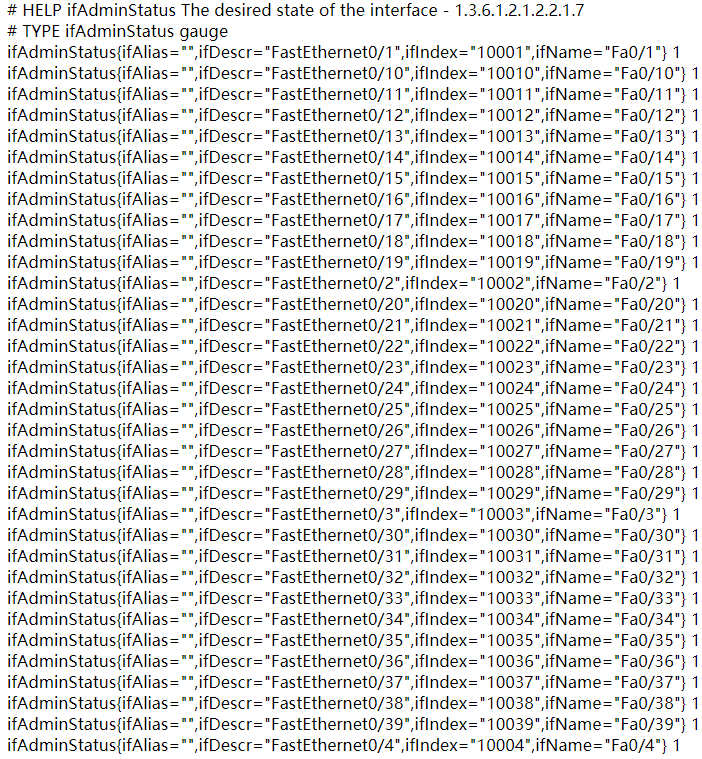
Open the service port on 9116, visit http://192.168.56.200:9116 in the browser, fill in the IP address of the switch in the Target input box, click the submit button, the data will appear, and the SNMP ﹣ exporter configuration is successful.
2.4 set the SNMP exporter to start in service mode
Ctrl+C ends the SNMP exporter process, creates the SNMP exporter service, and enables the SNMP exporter to power on and start itself as a service.
Add system service
# vim /etc/systemd/system/snmp_exporter.service
Write the following to a file
[Unit]
Description=node_exporter
After=network.target

[Service]
ExecStart=/usr/local/snmp_exporter/snmp_exporter
Restart=on-failure

[Install]
WantedBy=multi-user.target
Start the service and set the start-up mode
#  systemctl daemon-reload
#  systemctl enable snmp_exporter
#  systemctl start snmp_exporter
III. modify Prometheus configuration
Enter the installation folder of Prometheus and open the Prometheus configuration file
#  cd /usr/local/prometheus
#  vim prometheus.yml
Add the following to configure monitoring under the "trace" tab. In params.module, you can configure the modules that need to be crawled. If you do not configure them, all the modules will be crawled.
- job_name: 'snmp'
    scrape_interval: 10s
    static_configs:
     - targets:
       - 172.20.2.83  # Switch IP address
    metrics_path: /snmp
    # params:
     # module: [if_mib]
    relabel_configs:
      - source_labels: [__address__]
        target_label: __param_target
      - source_labels: [__param_target]
        target_label: instance
      - target_label: __address__
        replacement: 192.168.56.200:9116 # SNMP? Exporter service IP address
Here is the full contents of Prometheus.yml file
# my global config
global:
  scrape_interval:     15s # Set the scrape interval to every 15 seconds. Default is every 1 minute.
  evaluation_interval: 15s # Evaluate rules every 15 seconds. The default is every 1 minute.
  # scrape_timeout is set to the global default (10s).

# Alertmanager configuration
alerting:
  alertmanagers:
  - static_configs:
    - targets:
      # - alertmanager:9093

# Load rules once and periodically evaluate them according to the global 'evaluation_interval'.
rule_files:
  # - "first_rules.yml"
  # - "second_rules.yml"

# A scrape configuration containing exactly one endpoint to scrape:
# Here it's Prometheus itself.
scrape_configs:
  # The job name is added as a label `job=<job_name>` to any timeseries scraped from this config.
  - job_name: 'prometheus'

    # metrics_path defaults to '/metrics'
    # scheme defaults to 'http'.

    static_configs:
    - targets: ['localhost:9090']

  - job_name: 'Linux'
    static_configs:
    - targets: ['192.168.56.201:9100']
      labels:
        instance: Linux

  - job_name: 'Windows'
    static_configs:
    - targets: ['192.168.56.1:9182']
      labels:
        instance: Windows

  - job_name: 'snmp'
    scrape_interval: 10s
    static_configs:
     - targets:
       - 172.20.2.83  # Switch IP address
    metrics_path: /snmp
    # params:
     # module: [if_mib]
    relabel_configs:
      - source_labels: [__address__]
        target_label: __param_target
      - source_labels: [__param_target]
        target_label: instance
      - target_label: __address__
        replacement: 192.168.56.200:9116 # SNMP? Exporter service IP address
Save exit, restart Prometheus service
# systemctl restart prometheus
Browser access http://192.168.56.200:9090/targets View monitoring information
 As you can see, snmp has joined in.
IV. configure Grafana
Add dashboard
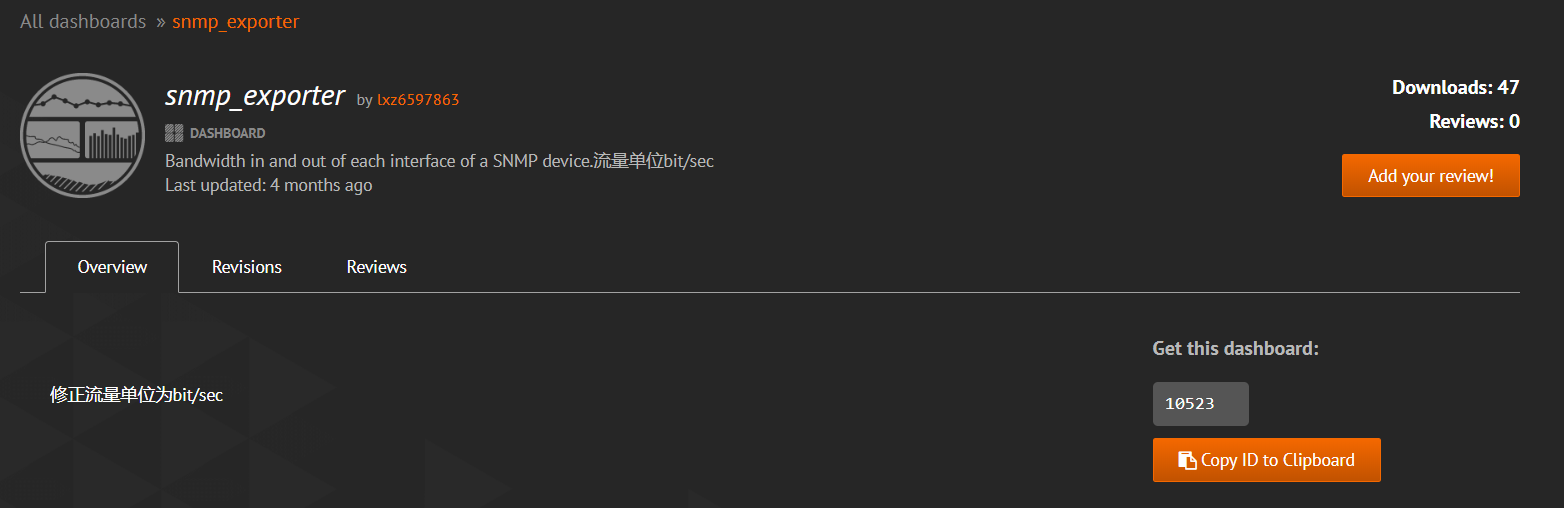
Grafana officially provides us with many dashboard pages, which can be downloaded and used directly. Browser access https://grafana.com/grafana/dashboards Download the required dashboard page
Here we use the snmp monitoring dashboard with the dashboard Id of 10523
Then open our Grafana monitoring page and open the dashboard management page
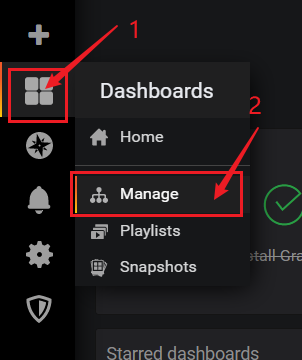
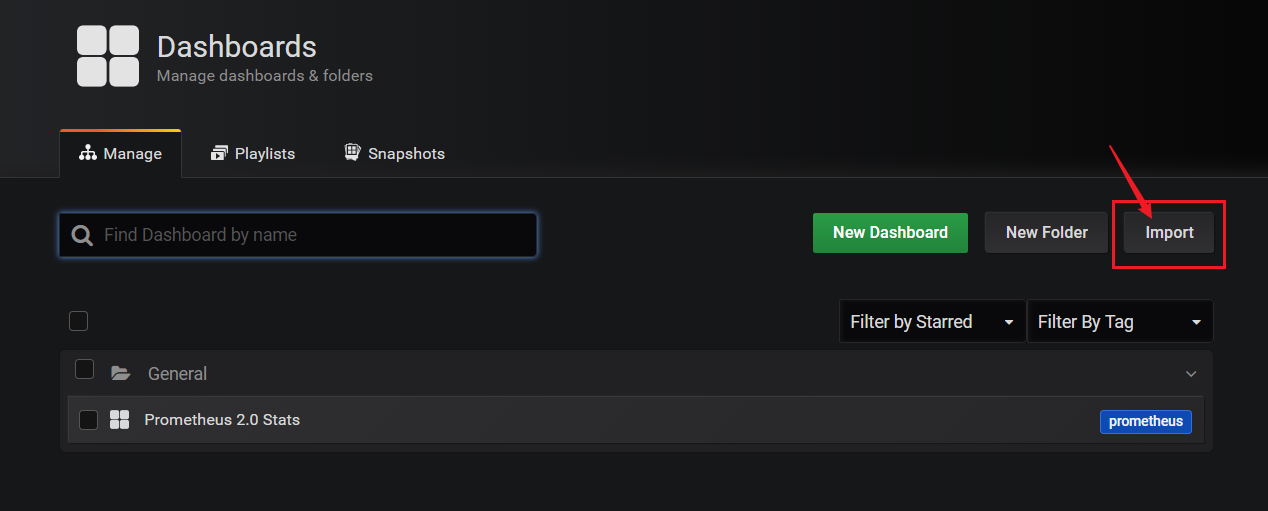
Click the [import] button
Then copy our dashboard Id (10523) into it
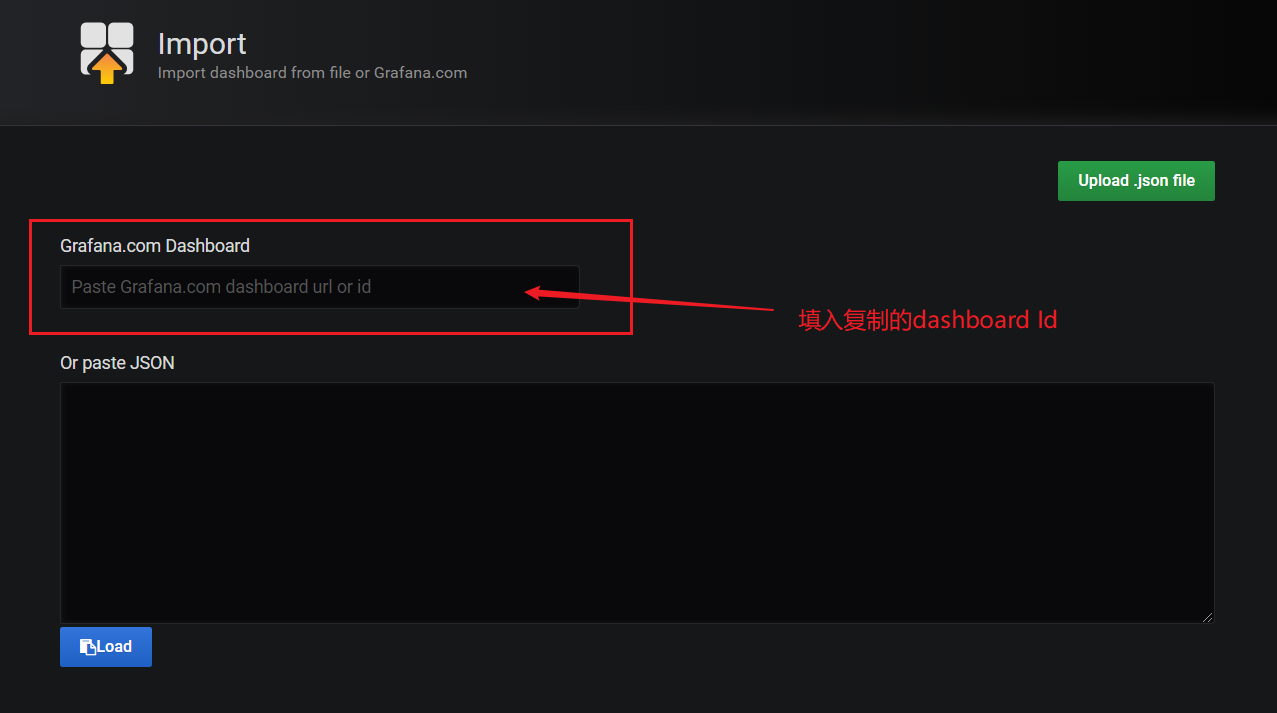
Grafana automatically recognizes the dashboard Id.
Then click the [change] button to generate a random UID, click the input box below, select the data source Prometheus we created earlier, and finally click the [Import] button to complete the Import.

After importing successfully, the Dashboard will be opened automatically, and you can see the snmp monitoring we just set up
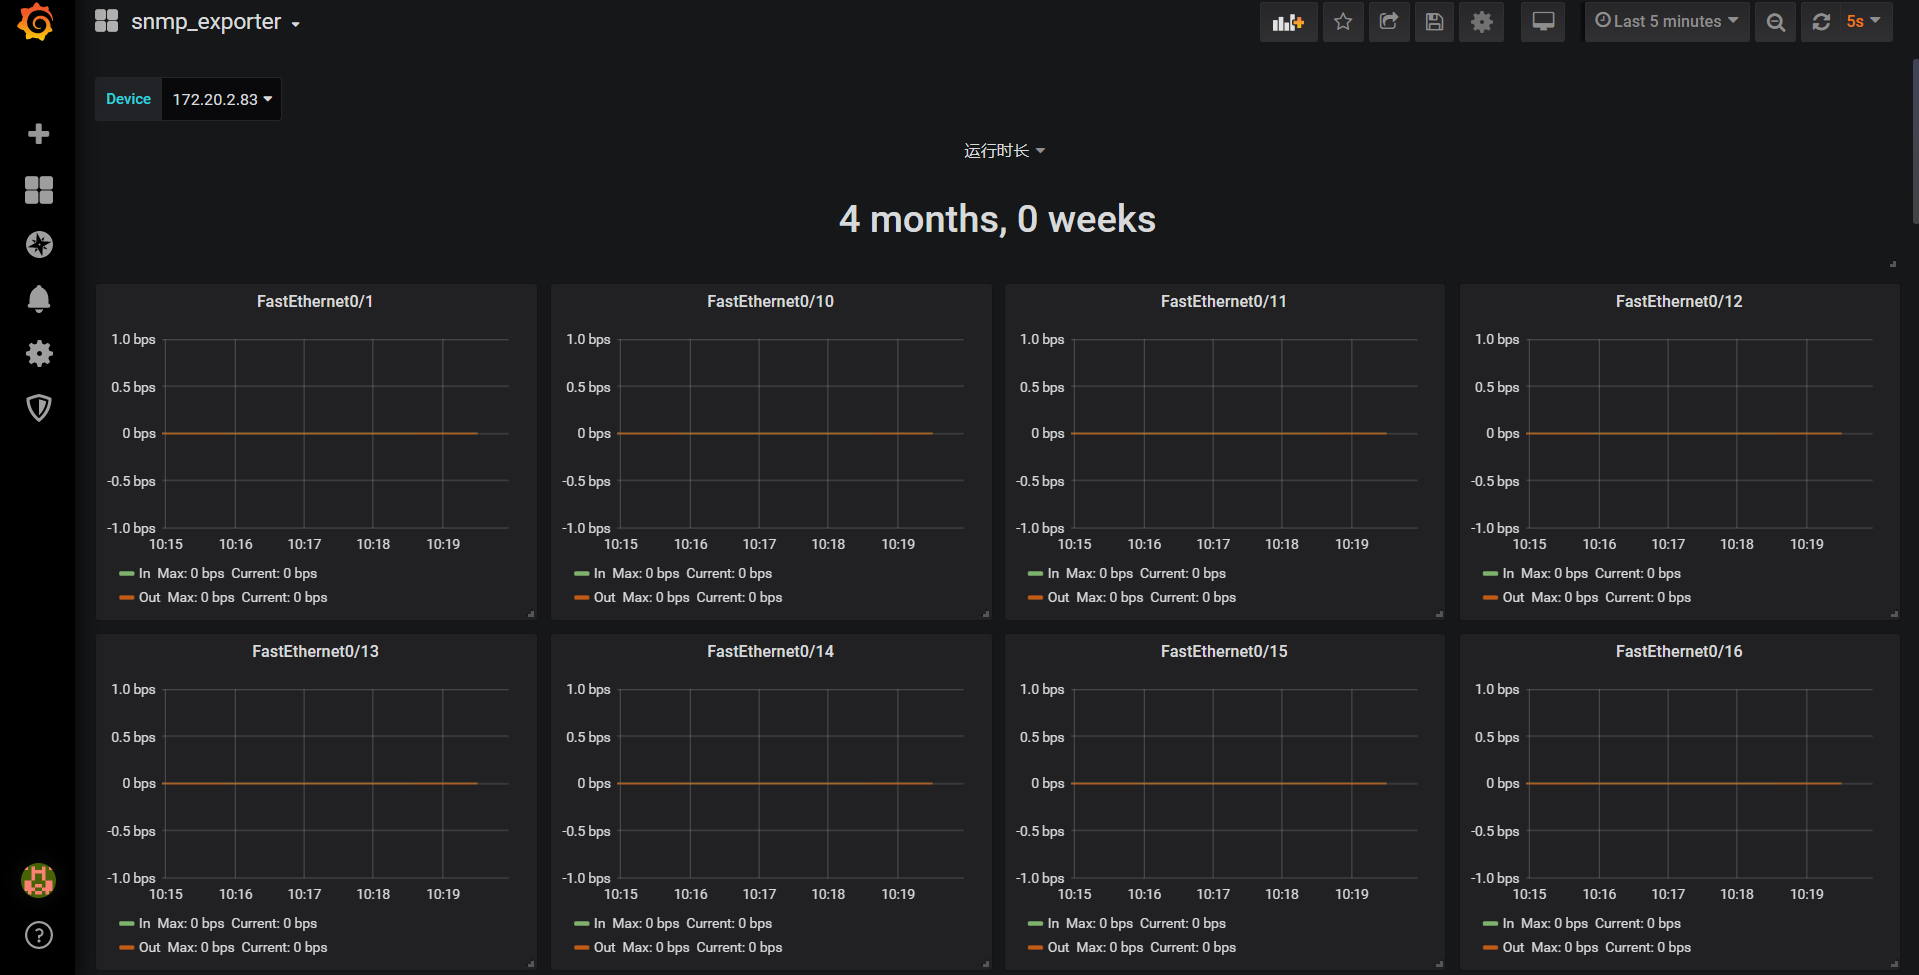
Now, the configuration of Prometheus monitoring switch is completed.