In the previous article, we learned how to obtain host monitoring information through node exporter. However, installing monitoring is only the first step. We also need to know which monitoring indicators we need to pay attention to.
This paper will introduce the host monitoring indicators related to Prometheus.
1, CPU monitoring
CPU load
node_load1
node_load5
node_load15
The above three indicators are the average cpu load of the host, corresponding to the time intervals of one minute, five minutes and fifteen minutes respectively. cpu load refers to the sum of processes that occupy cpu time and processes waiting for cpu time in a certain period of time. Generally speaking, if the cpu load / cpu core count exceeds 0.7, you should start to pay attention to the machine performance. If it exceeds 1, the operation and maintenance personnel should intervene.
CPU utilization
node_cpu_seconds_total
The indicator includes multiple tags, which respectively mark the CPU time used by each processing mode. The indicator is of counter type. This indicator is not suitable for direct use. You can convert it into an indicator of CPU utilization through PromQL learned earlier.
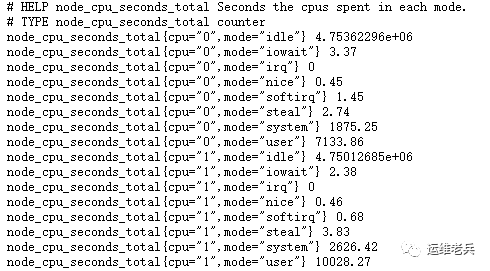
mode="idle" represents the idle time of the CPU, so we only need to calculate the proportion of idle time, and then subtract the value from the total to know the CPU utilization. Use irate method here. Since the existing servers are generally multi-core, adding avg to calculate the average value of all CPUs is the CPU utilization, as follows:
100 -avg(irate(node_cpu_seconds_total{mode="idle"}[5m])) by (instance)* 1002, Memory monitoring
Physical memory usage
For memory, we generally pay attention to the memory utilization, but the node exporter does not directly calculate it. We need to write our own calculation formula according to the memory index returned by node exporter.
The following memory indicators are required:
node_memory_MemTotal_bytes    #Total memory size
node_memory_MemFree_bytes     #Free memory size
node_memory_Buffers_bytes     #Buffer size
node_memory_Cached_bytes      #Page cache size
The calculation formula is: (total memory) - (free memory + cache + page cache) / total memory * 100
(node_memory_MemTotal_bytes - (node_memory_MemFree_bytes + node_memory_Buffers_bytes+node_memory_Cached_bytes ))/node_memory_MemTotal_bytes * 100
swap memory usage
Swap is a swap memory partition. It uses part of the space on the disk as server memory. When the system's physical memory is tight, Linux will save infrequently accessed data in memory to swap, so that the system has more physical memory to serve each process. When the system needs to access the contents stored on the swap, it loads the data on the swap into memory, which is often called swap out and swap in. Swap space can alleviate the shortage of memory to a certain extent, but it needs to read and write disk data, so the performance is not very high.
The indicators used in swap memory are as follows:
node_memory_SwapTotal_bytes  #Total swap memory size
node_memory_SwapFree_bytes   #swap free memory size
The calculation formula is as follows:
(node_memory_SwapTotal_bytes - node_memory_SwapFree_bytes)/node_memory_SwapTotal_bytes * 100
3, Disk monitoring
Partition utilization
The index of partition utilization can be calculated from the total container of partition space and partition free capacity
node_filesystem_size_bytes  #Total capacity of zone space
node_filesystem_free_bytes  # Partition free capacity
Since the host usually has multiple partitions, you need to pass the label mountpoint of the indicator Distinguish, e.g Get/ The following formula can be used for partition disk utilization
(node_filesystem_size_bytes{mountpoint="/"} - node_filesystem_free_bytes{mountpoint="/"})/node_filesystem_size_bytes{mountpoint="/"} * 100Disk throughput
node_disk_read_bytes_total  #Total bytes read by partition
node_disk_written_bytes_total #Total bytes written to partition
The above two indicators respectively correspond to the total bytes read and written in the partition. The indicators are of counter type. As mentioned in the previous article, the counter type will continue to accumulate. The direct use of this indicator is meaningless for monitoring, but it can be converted into the read-write rate per second of the disk through the following formula. device represents the corresponding disk partition.
irate(node_disk_read_bytes_total{device="vda"}[5m])
irate(node_disk_written_bytes_total{device="vda"}[5m])
Disk IOPS
IOPS refers to the number of reads and writes to the disk per second. Both IOPS and throughput are important indicators to measure the disk. IOPS monitoring can be calculated through the following two indicators
node_disk_reads_completed_total  #Total number of partition reads
node_disk_writes_completed_total  #Total number of partition writes
The calculation formula is similar to the above. We use the familiar irate or rate function to deal with it
irate(node_disk_reads_completed_total{device="vda"}[5m])
irate(node_disk_writes_completed_total{device="vda"}[5m])
4, Network monitoring
Network card traffic
Network card traffic is generally divided into upload and download traffic. The following two indicators are the total number of bytes, which can be used to calculate the network card traffic per second
node_network_receive_bytes_total  #Total bytes of download traffic
node_network_transmit_bytes_total  #Total bytes of upload traffic
The calculation formula is as follows. Loopback is excluded here network card
irate(node_network_receive_bytes_total{device != "lo"}[1m]
5, Availability monitoring
In addition to monitoring the performance parameters of the host, we also need to pay attention to the availability of the instance, such as whether it is shut down and whether the exporter is running normally. There is an up indicator in the indicator returned by the exporter, which can be used to realize such monitoring requirements.
up{job="node-exporter"}Conclusion:
Host monitoring is the lowest level in the monitoring plane. Although it is basic, it is very important. Only when it is stable at the host level can the upper application run better. The content explained in this article is only the basic indicators in host monitoring. Node exporter itself also provides many useful indicators, including user-defined indicators that support textfile. In the production environment, it needs to be debugged according to the actual situation.
Focus on Devops technology sharing, welcome to pay attention to the official account of "personal operation and maintenance veterans".