1. Prometheus storage bottleneck
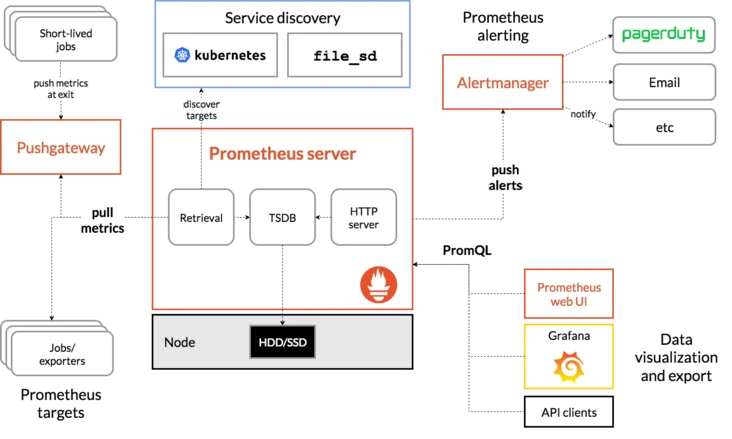
It can be seen from the architecture diagram of prometheus that prometheus provides local storage, that is, tsdb timing database.
- Advantages of local storage
Using local storage can reduce the complexity of Prometheus deployment and management, and reduce the complexity caused by high availability (HA). By default, users only need to deploy multiple sets of Prometheus and collect the same Targets to achieve basic ha. At the same time, due to Promethus' efficient data processing capacity, a single Prometheus Server can basically meet the needs of most users for monitoring scale.
- Disadvantages of local storage
Of course, local storage also brings some disadvantages. The first is the problem of data persistence. Especially in a dynamic cluster environment such as Kubernetes, if the instance of promhues is rescheduled, all historical monitoring data will be lost. Secondly, local storage also means that Prometheus is not suitable for saving a large amount of historical data (Prometheus generally recommends only retaining data for a few weeks or months).
Local storage also makes Prometheus unable to scale elastically. In order to meet this demand, Prometheus provides remote_write and remote_ The read feature supports storing data to and reading data from the remote end. By separating monitoring from data, Prometheus can expand elastically.
In addition to local storage problems, Prometheus is based on the Pull model. When a large number of targets need to collect samples, some performance problems may occur during data capture of a single Prometheus instance. The characteristics of the federated cluster enable Prometheus to divide the sample collection tasks into different Prometheus instances and aggregate them through a unified central node, Thus, Prometheuse can be expanded according to scale.
2. Local storage
Prometheus 2.x saves the sample data on the local disk in a custom storage format.
According to the time window of two hours, the data generated within two hours is stored in a block. Each block contains all sample data (chunks), metadata file (meta.json) and index file (index) within the time window.

For the sample data being collected in the current time window, Prometheus will directly save the data in memory. In order to ensure that data can be recovered if Prometheus crashes or restarts during this period, Prometheus will replay from the write log (WAL) during startup to recover data. During this period, if the time series is deleted through the API, the deleted records will also be saved in a separate logical file (tombstone).
/usr/local/prometheus/data/		# Data storage directory
./data
   |- 01BKGV7JBM69T2G1BGBGM6KB12 # block
      |- meta.json  # metadata
      |- wal        # Write log
        |- 000002
        |- 000001
   |- 01BKGTZQ1SYQJTR4PB43C8PD98  # block
      |- meta.json  #metadata
      |- index   # Index file
      |- chunks  # sample data
        |- 000001
      |- tombstones # Logical data
   |- 01BKGTZQ1HHWHV8FBJXW1Y3W0K
      |- meta.json
      |- wal
        |-000001
Saving all the sample data in the form of time window can significantly improve the query efficiency of Prometheus. When querying all the sample data within a period of time, you only need to simply query the data from the blocks falling within the range.
At the same time, this storage method can simplify the deletion logic of historical data. As long as the time range of a block falls outside the configured retention range, the block can be discarded directly.
2.1 local storage configuration
The user can modify the configuration of local storage through the command line startup parameters.
| startup parameter | Default value | meaning |
|---|---|---|
| –storage.tsdb.path | data/ | Basic path of indicator storage |
| –storage.tsdb.retention | 15d | How long does the sample remain in the warehouse |
| –storage.tsdb.min-block-duration | 2h | The timestamp range of the header blocks, after which they are persisted |
| –storage.tsdb.max-block-duration | 36h | The maximum timestamp range of a compressed block, which is the minimum duration of any persistent block. |
| –storage.tsdb.no-lockfile | false | Do not create lock files in the data directory |
In general, each sample stored in Prometheus occupies about 1-2 bytes. If you need to plan the local disk space of Prometheus Server, you can calculate it through the following formula:
needed_disk_space = retention_time_seconds * ingested_samples_per_second * bytes_per_sample
 Required disk space=retention time  * Number of samples obtained per second * Bytes per sample
As can be seen from the above formula, if you want to reduce the capacity requirements of the local disk when the retention_time_seconds and sample size remain unchanged, you can only reduce the number of samples obtained per second.
Therefore, there are two methods: one is to reduce the number of time series, and the other is to increase the time interval of collecting samples. Considering the compression efficiency of Prometheus on time series, the effect of reducing the number of time series is more obvious.
2.2 recovery from failure
If the local storage fails for some reason, the most direct way is to stop Prometheus and delete all records in the data directory. Of course, you can also try to delete the block directory with errors, but the corresponding user will lose the monitoring records saved in the block for about two hours.
3. Remote storage
Prometheus' local storage design can reduce the complexity of its own operation, maintenance and management, and meet the needs of most users for monitoring scale. However, local storage also means that Prometheus cannot persist data, store a large amount of historical data, and flexibly expand and migrate.
In order to keep Prometheus simple, Prometheus does not try to solve the above problems in itself. Instead, it defines two standard interfaces (remote_write/remote_read) so that users can connect and save data to any third-party storage service based on the two interfaces. This method is called Remote Storage in promhues.
3.1 Remote Write
Specify the URL address of remote write in the Prometheus configuration file. Once this configuration item is set, Prometheus will send the collected sample data to the adapter in the form of HTTP. Users can connect to any external service in the adapter. External services can be real storage systems, public cloud storage services, or any form such as message queues.

3.2 Remote Read
As shown in the figure below, promhues' remote read is also implemented through an adapter. In the process of remote reading, when the user initiates a query request, promhues will send it to remote_ The URL configured in read initiates a query request (matchers,ranges), and the adapter obtains the response data from the third-party storage service according to the request conditions. At the same time, convert the data into the original sample data of promhues and return it to Prometheus Server.
After obtaining the sample data, promhues uses PromQL locally to process the sample data twice.
Note: after the remote read setting is enabled, it is only valid for data query. The processing of rule files and Metadata API are only completed based on Prometheus local storage.

3.3 configuration file
Add remote to Prometheus configuration file_ Write and remote_read configuration, where URL is used to specify the HTTP service address for remote read / write. If the URL starts authentication, you can pass basic_auth performs security authentication configuration. For https support, TLS needs to be set_ concig. proxy_ The URL is mainly used when Prometheus cannot directly access the adapter service.
The specific configuration is as follows:
- remote_write configuration
remote_write:
	# Address written remotely
	url: <string>
	# Remote storage response timeout
	[ remote_timeout: <duration> | default = 30s ]

	# Label rewriting of time series data
	write_relabel_configs:
 	 [ - <relabel_config> ... ]

	# Identification of remote storage
	[ name: <string> ]

	# When requesting remote storage, add Authorization authentication in the header
	basic_auth:
  	[ username: <string> ]
  	[ password: <secret> ]
  	[ password_file: <string> ]
	[ bearer_token: <string> ]
	[ bearer_token_file: <filename> ]

	# TLS configuration
	tls_config:
 	 [ ca_file: <filename> ]
 	 [ cert_file: <filename> ]
	  [ key_file: <filename> ]
	  [ server_name: <string> ]
	  [ insecure_skip_verify: <boolean> ]

	# Agent configuration
	[ proxy_url: <string> ]

	# Configuring queues for remote storage writes
	queue_config:
	  # The maximum number of sample buffers in each slice exceeds the number of blocks read from the WAL. It is recommended to increase it appropriately
	  [ capacity: <int> | default = 500 ]
	  # Maximum number of shards, i.e. concurrent number
	  [ max_shards: <int> | default = 1000 ]
	  # Minimum number of shards, i.e. concurrency
	  [ min_shards: <int> | default = 1 ]
	  # Number of samples sent each time
	  [ max_samples_per_send: <int> | default = 100]
	  # Sample expiration time in buffer
	  [ batch_send_deadline: <duration> | default = 5s ]
	  # The initial retry delay is doubled for each retry
	  [ min_backoff: <duration> | default = 30ms ]
	  # Maximum retry delay
	  [ max_backoff: <duration> | default = 100ms ]
- remote_read configuration
	# Remote storage read address
	url: <string>
	# Remote storage identity
	[ name: <string> ]

	required_matchers:
	  [ <labelname>: <labelvalue> ... ]

	# Read timeout
	[ remote_timeout: <duration> | default = 1m ]

	# When the query time range is within the retention time range of locally stored data, whether to query remotely
	[ read_recent: <boolean> | default = false ]

	# When requesting remote storage, add Authorization authentication in the header
	basic_auth:
 	[ username: <string> ]
 	[ password: <secret> ]
 	[ password_file: <string> ]
	[ bearer_token: <string> ]
	[ bearer_token_file: <filename> ]

	# TLS configuration
	tls_config:
	[ ca_file: <filename> ]
  	[ cert_file: <filename> ]
  	[ key_file: <filename> ]
  	[ server_name: <string> ]
  	[ insecure_skip_verify: <boolean> ]

	# Agent configuration
	[ proxy_url: <string> ]
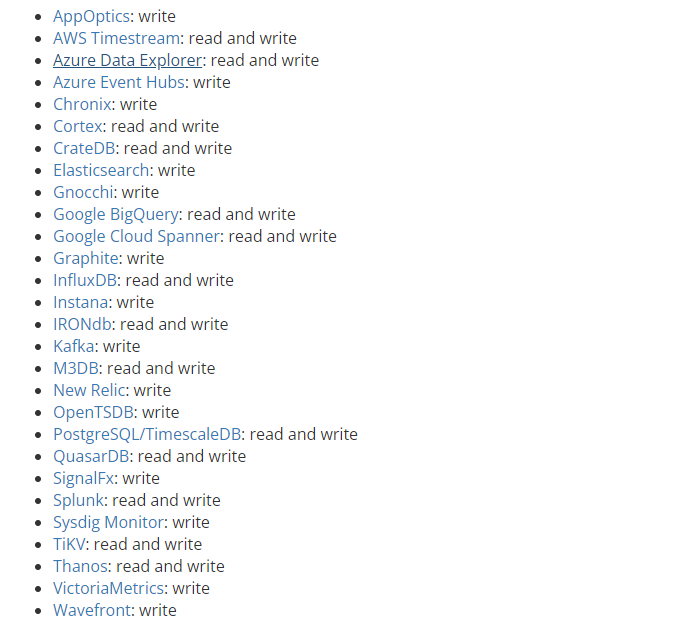
3.4 using incluxdb as remote storage
The following are the storage methods supported on the official website
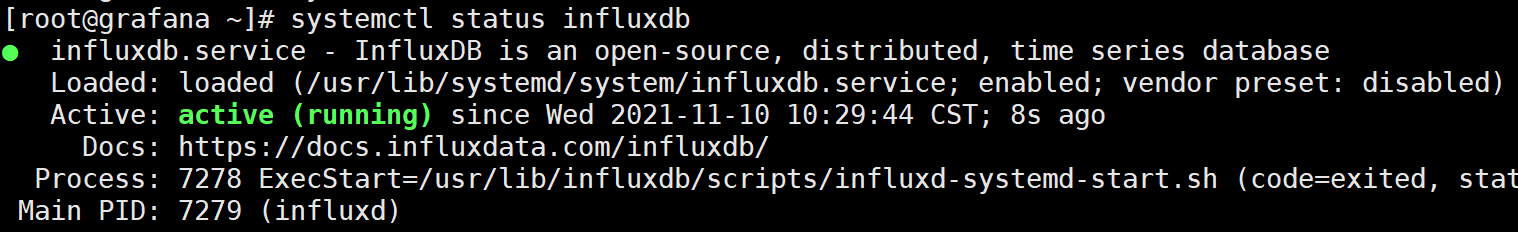
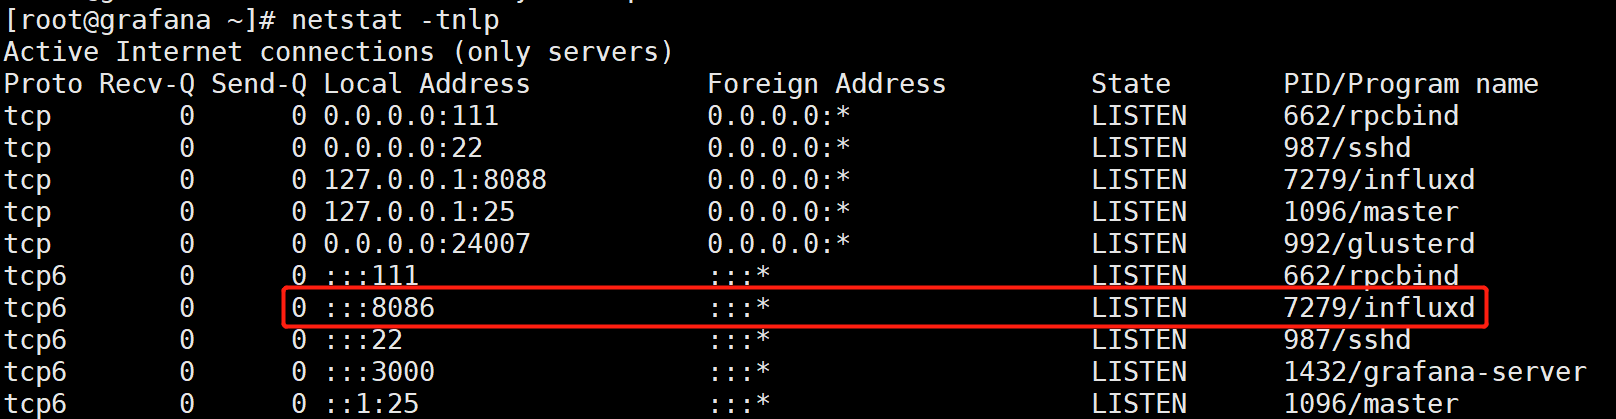
3.4.1 impluxdb deployment
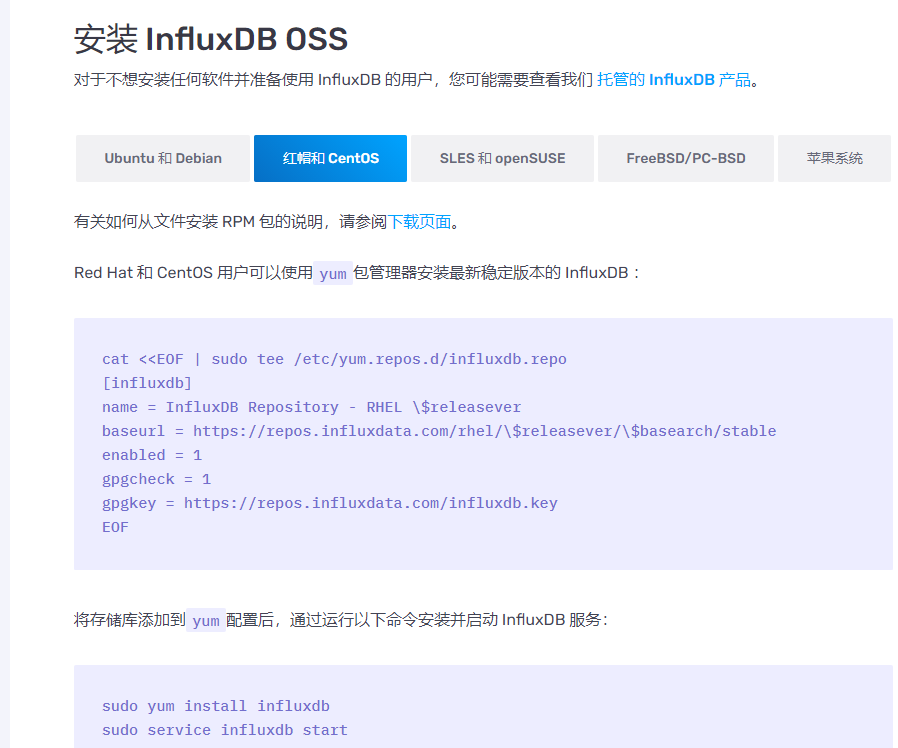
#I installed it here on the same machine as Grafana
[root@grafana ~]# cat <<EOF | sudo tee /etc/yum.repos.d/influxdb.repo
[influxdb]
name = InfluxDB Repository - RHEL \$releasever
baseurl = https://repos.influxdata.com/rhel/\$releasever/\$basearch/stable
enabled = 1
gpgcheck = 1
gpgkey = https://repos.influxdata.com/influxdb.key
EOF
[root@grafana ~]# yum install influxdb -y
[root@grafana ~]# systemctl start influxdb
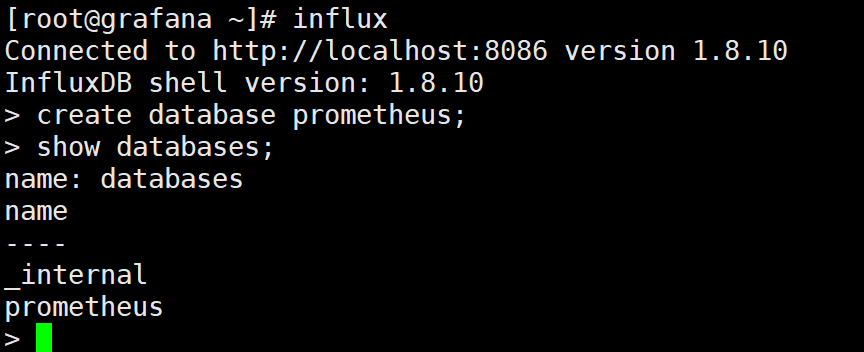
3.4.2 creating database
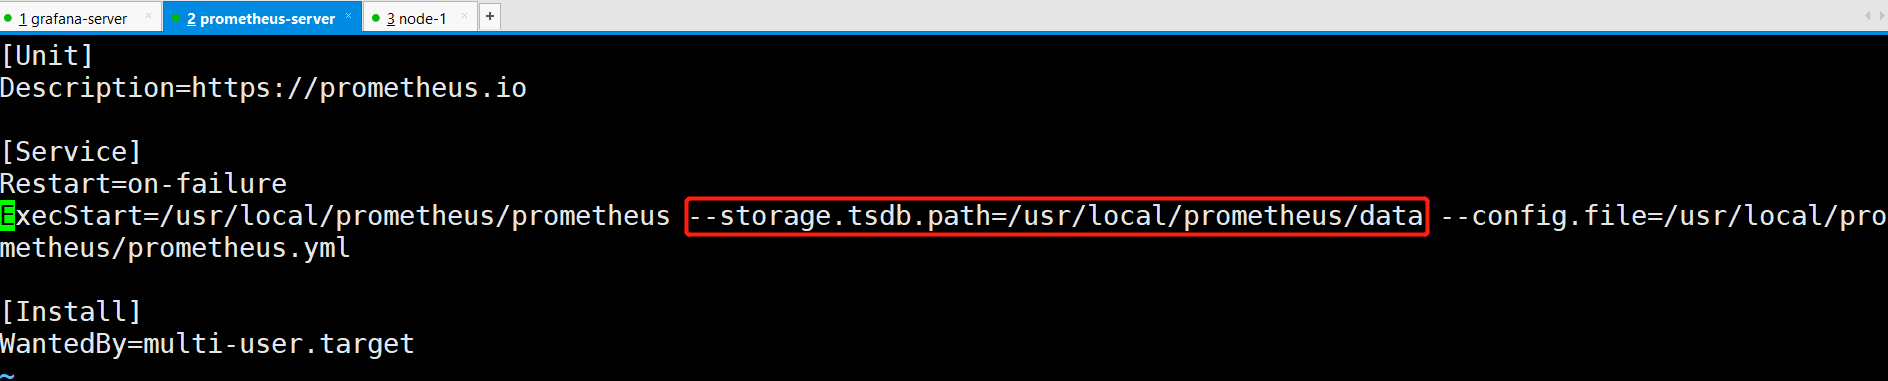
3.4.3 Prometheus specifies the storage path
[root@prometheus prometheus]# vim /usr/lib/systemd/system/prometheus.service
--storage.tsdb.path=/usr/local/prometheus/data
[root@prometheus prometheus]# systemctl daemon-reload
[root@prometheus prometheus]# systemctl restart prometheus
3.4.4 add remote read / write
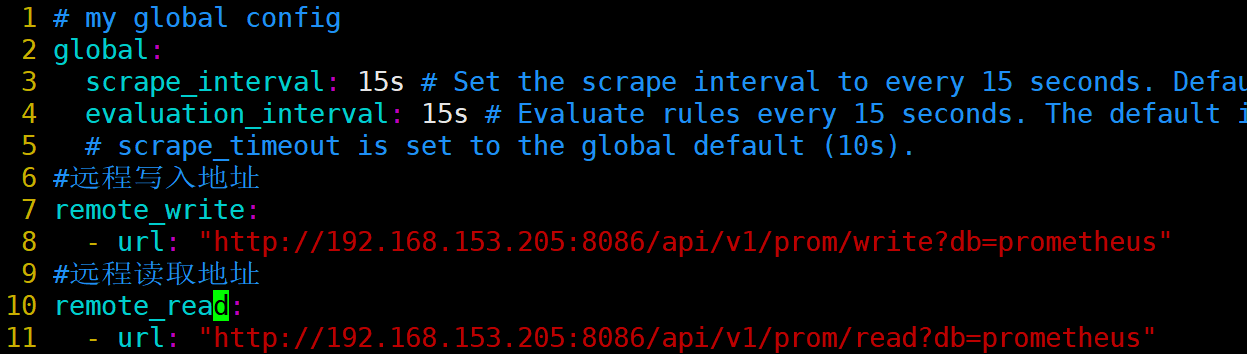
[root@prometheus prometheus]# pwd
/usr/local/prometheus
[root@prometheus prometheus]# vim prometheus.yml
#Remote write address
remote_write:
  - url: "http://192.168.153.205:8086/api/v1/prom/write?db=prometheus"
#Remote read address
remote_read:
  - url: "http://192.168.153.205:8086/api/v1/prom/read?db=prometheus"
[root@prometheus prometheus]# systemctl restart prometheus
3.4.5 verifying the influxdb data
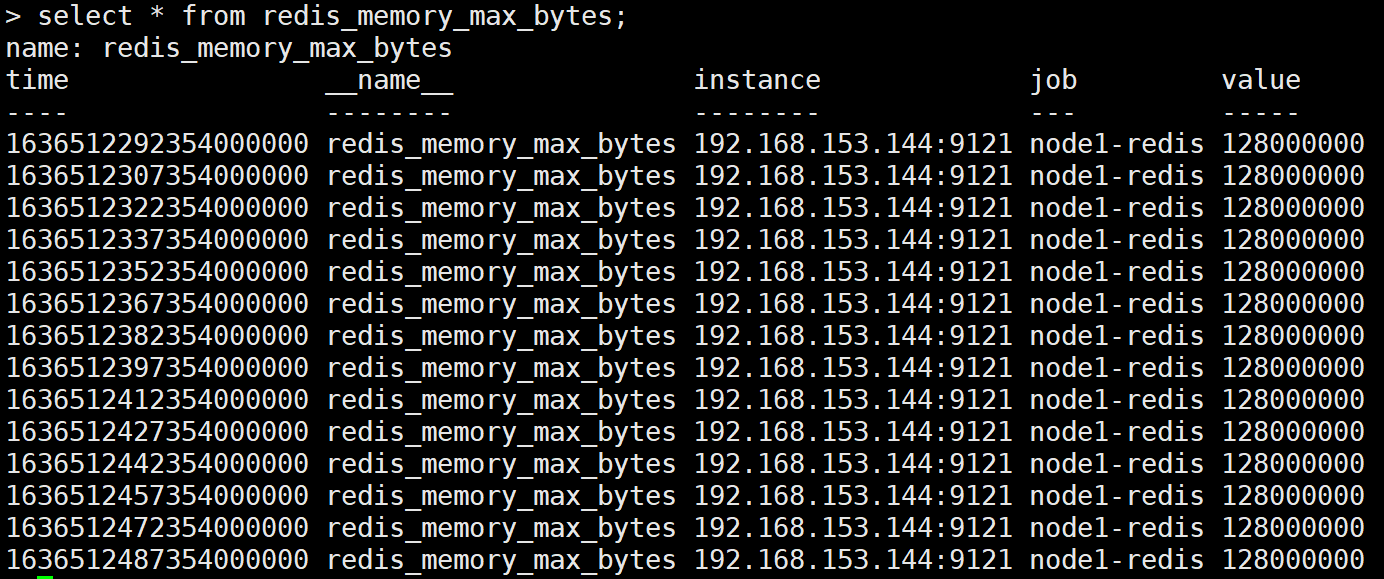
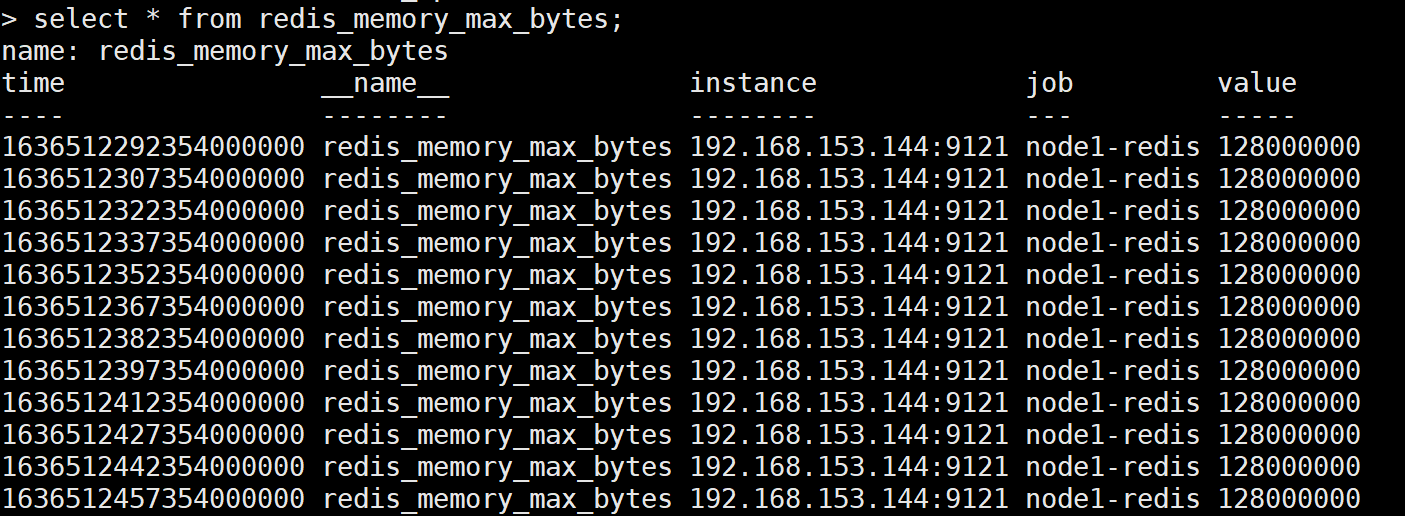
Check whether there are data writes to the influxdb
[root@grafana ~]# influx
> use prometheus
> show measurements  #Many tables will be displayed
> select * from redis_memory_max_bytes; Check whether there is monitoring data in this table
Verify data reliability:
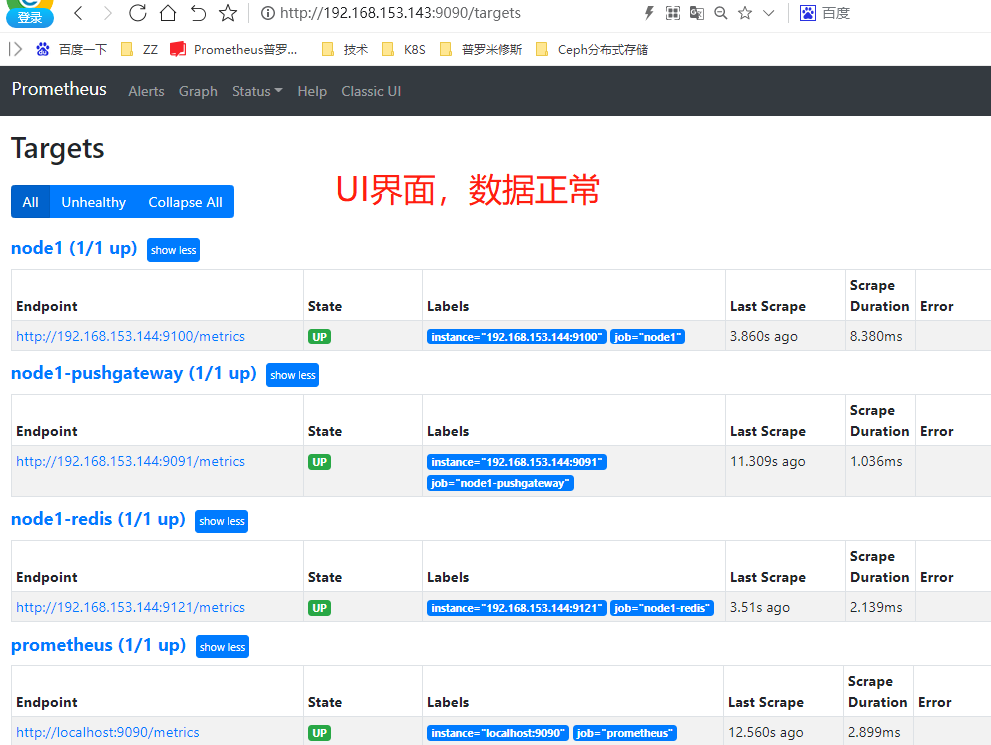
Stop the Prometheus service. At the same time, delete the data directory of Prometheus and restart Prometheus. Open Prometheus
If the UI configuration is normal, Prometheus can normally query the local stored historical data records to delete.
Enter the influxdb database, and the data still exists;
4. Federal clusters
Remote Storage can separate monitoring sample collection and data storage to solve the persistence problem of Prometheus. This part will focus on how to use the characteristics of Federated clusters to expand promhues to adapt to the changes of different monitoring scales.
4.1 using federated clusters
For most monitoring scales, we only need to install a Prometheus Server instance in each data center (e.g. EC2 availability zone, Kubernetes cluster) to process thousands of clusters in each data center. At the same time, deploying Prometheus Server to different data centers can avoid the complexity of network configuration.
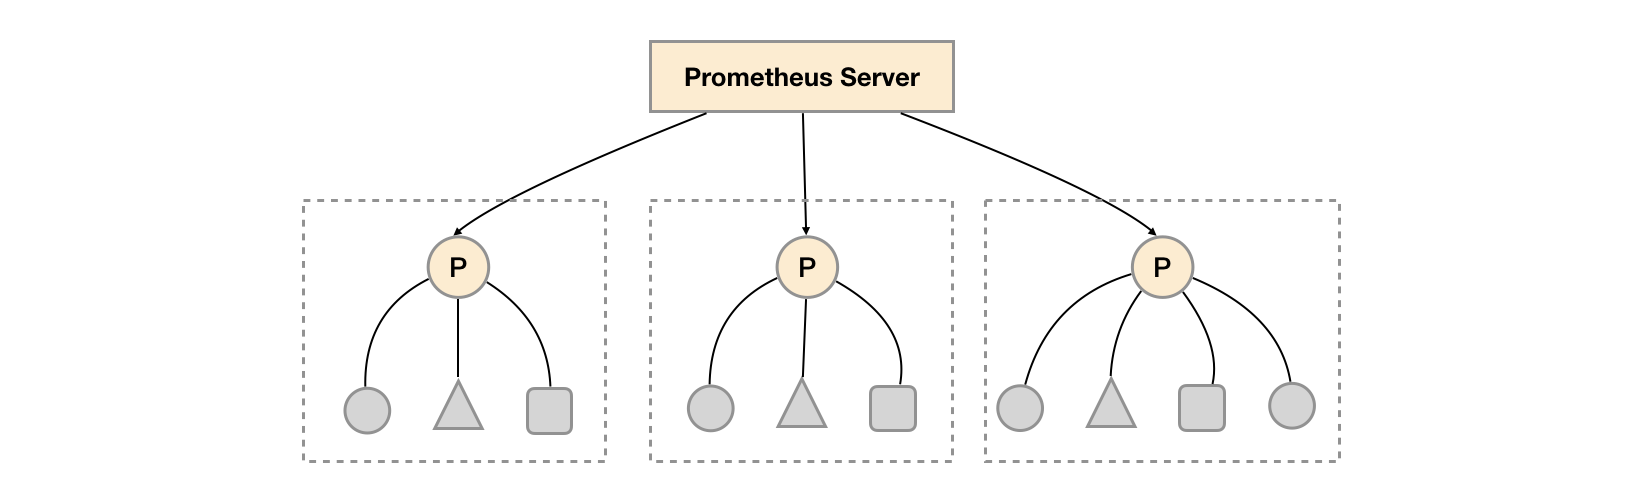
As shown in the figure above, a separate Prometheus Server is deployed in each data center to collect the monitoring data of the current data center. The Prometheus Server of one center is responsible for aggregating the monitoring data of multiple data centers. This feature is called federated clustering in promhues.
The core of the federated cluster is that each Prometheus Server contains an interface / federate for obtaining monitoring samples in the current instance. For the central Prometheus Server, there is actually no difference in obtaining data from other Prometheus instances or Exporter instances.
scrape_configs:
  - job_name: 'federate'
    scrape_interval: 15s
    honor_labels: true
    metrics_path: '/federate'
    params:
      'match[]':
        - '{job="prometheus"}'
        - '{__name__=~"job:.*"}'
        - '{__name__=~"node.*"}'
    static_configs:
      - targets:
        - '192.168.77.11:9090'
        - '192.168.77.12:9090'
In order to effectively reduce unnecessary time series, the params parameter can be used to specify that only sample data of some time series can be obtained, such as
"http://192.168.77.11:9090/federate?match[]={job%3D"prometheus"}&match[]={__name__%3D~"job%3A.*"}&match[]={__name__%3D~"node.*"}"
By specifying the match [] parameter in the URL, we can specify the time series to be obtained. The match [] parameter must be an instantaneous vector selector, such as up or {job = "API server"}. Configure multiple match [] parameters to obtain monitoring data of multiple groups of time series.
horbor_ Configuring true for labels can ensure that conflicting monitoring data can be automatically ignored when the collected monitoring indicators conflict. If false, prometheus will automatically replace the conflicting label with "exported"_ "In the form of.
4.2 functional zoning
The feature of Federated cluster can help users adjust the promthyes deployment architecture according to different monitoring scales. For example, as shown below, multiple Prometheus Server instances can be deployed in each data center. Each Prometheus Server instance is only responsible for collecting part of the tasks (jobs) in the current data center For example, different monitoring tasks can be separated into different Prometheus instances, and then a central Prometheus instance can be aggregated.
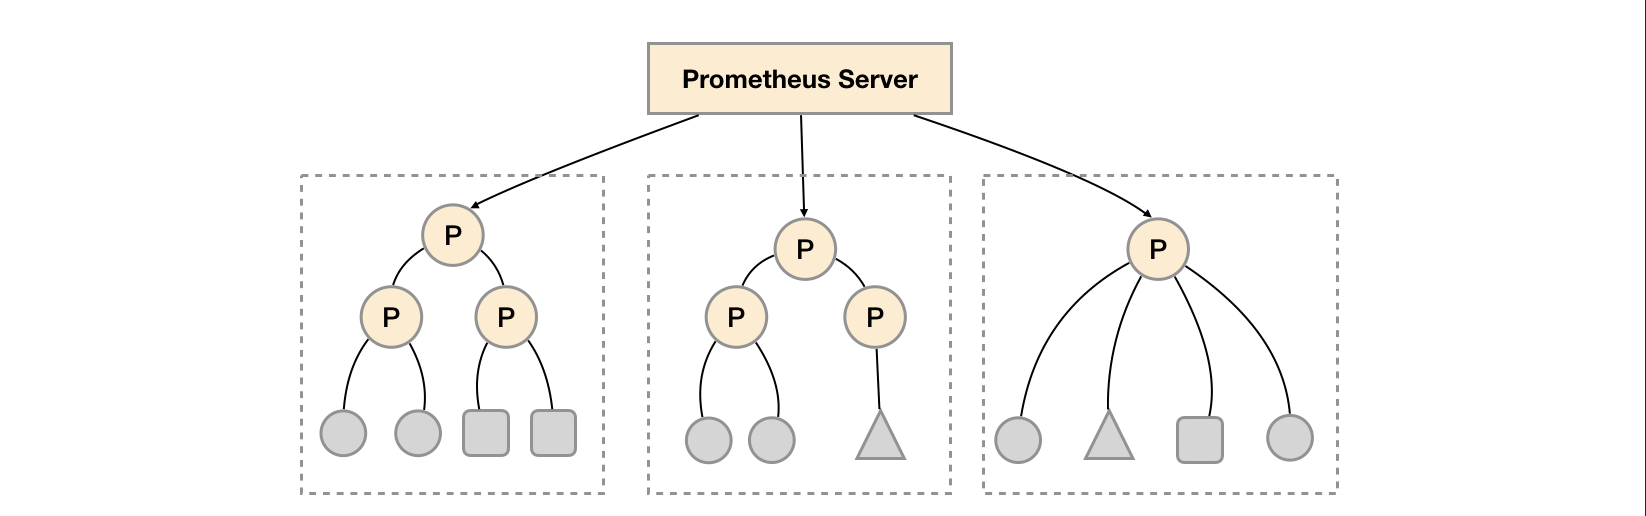
Function partition, that is, Prometheus collection tasks are divided at the task level through the characteristics of Federated clusters to support scale expansion.
5. Prometheus high availability deployment
Prometheus' local storage brings a simple and efficient use experience to Prometheus, enabling promthyes to meet the monitoring needs of most users in the case of a single node. However, local storage also limits Prometheus' scalability and brings a series of problems such as data persistence. Prometheus's Remote Storage feature can solve these problems, including P The dynamic expansion of romthues and the storage of historical data.
In addition to the problem of data persistence, another important factor affecting the performance of promhues is the amount of data collection tasks and the number of time series that can be processed by a single promhues. Therefore, when the monitoring scale is so large that a single promhues can not be processed effectively, you can choose to use the characteristics of the federated cluster of promhues to divide the monitoring tasks of promhues into different groups Examples of.
This section will focus on the high availability architecture of Prometheus, and introduce a common high availability scheme according to different use scenarios.
5.1 basic HA: service availability
Due to the design of promhues Pull mechanism, in order to ensure the availability of promhues services, users only need to deploy multiple sets of Prometheus Server instances and collect the same Exporter targets.

The basic HA mode can only ensure the availability of promhues services, but does not solve the data consistency and persistence problems between Prometheus servers (data cannot be recovered after loss) Therefore, this deployment method is suitable for scenarios where the monitoring scale is small, the promhues server does not migrate frequently, and only needs to save short-term monitoring data.
5.2 basic HA + remote storage
Based on the basic HA mode, the monitoring data is saved on the third-party storage service by adding Remote Storage support.

On the basis of solving the availability of promhues service and ensuring the persistence of data, it can recover quickly in case of downtime or data loss of promhues server. At the same time, promhues server may be well migrated. Therefore, this scheme is applicable to scenarios where the user monitoring scale is small, but it is hoped that the monitoring data can be persisted and the portability of promhues server can be ensured.
5.3 basic HA + remote storage + federated cluster
When a single promthyes server cannot handle a large number of collection tasks, users can consider dividing the monitoring and collection tasks into different promthyes instances based on Prometheus federated cluster, that is, in the task level function partition.
This deployment method is generally applicable to two scenarios:
Scenario 1: single data center + a large number of acquisition tasks
In this scenario, the performance bottleneck of promhues mainly lies in a large number of collection tasks. Therefore, users need to use the characteristics of Prometheus federated cluster to divide different types of collection tasks into different promhues sub services, so as to realize function partition. For example, one promhues server is responsible for collecting infrastructure related monitoring indicators, and the other Prometheus Server is responsible for collecting application monitoring indicators. In addition, the upper Prometheus Server realizes the aggregation of data.
Scenario 2: multiple data centers
This mode is also suitable for the situation of multiple data centers. When promhues server cannot communicate directly with exporters in the data center, it is a good way to deploy a separate promhues server in each data center to be responsible for the collection task of the current data center. In this way, you can avoid a large number of network configurations. You only need to ensure that the main promhues server instance can communicate with the Prometheus Server in the current data center. Promhues server is responsible for aggregating data from multiple data centers.
5.4 functional zoning according to examples
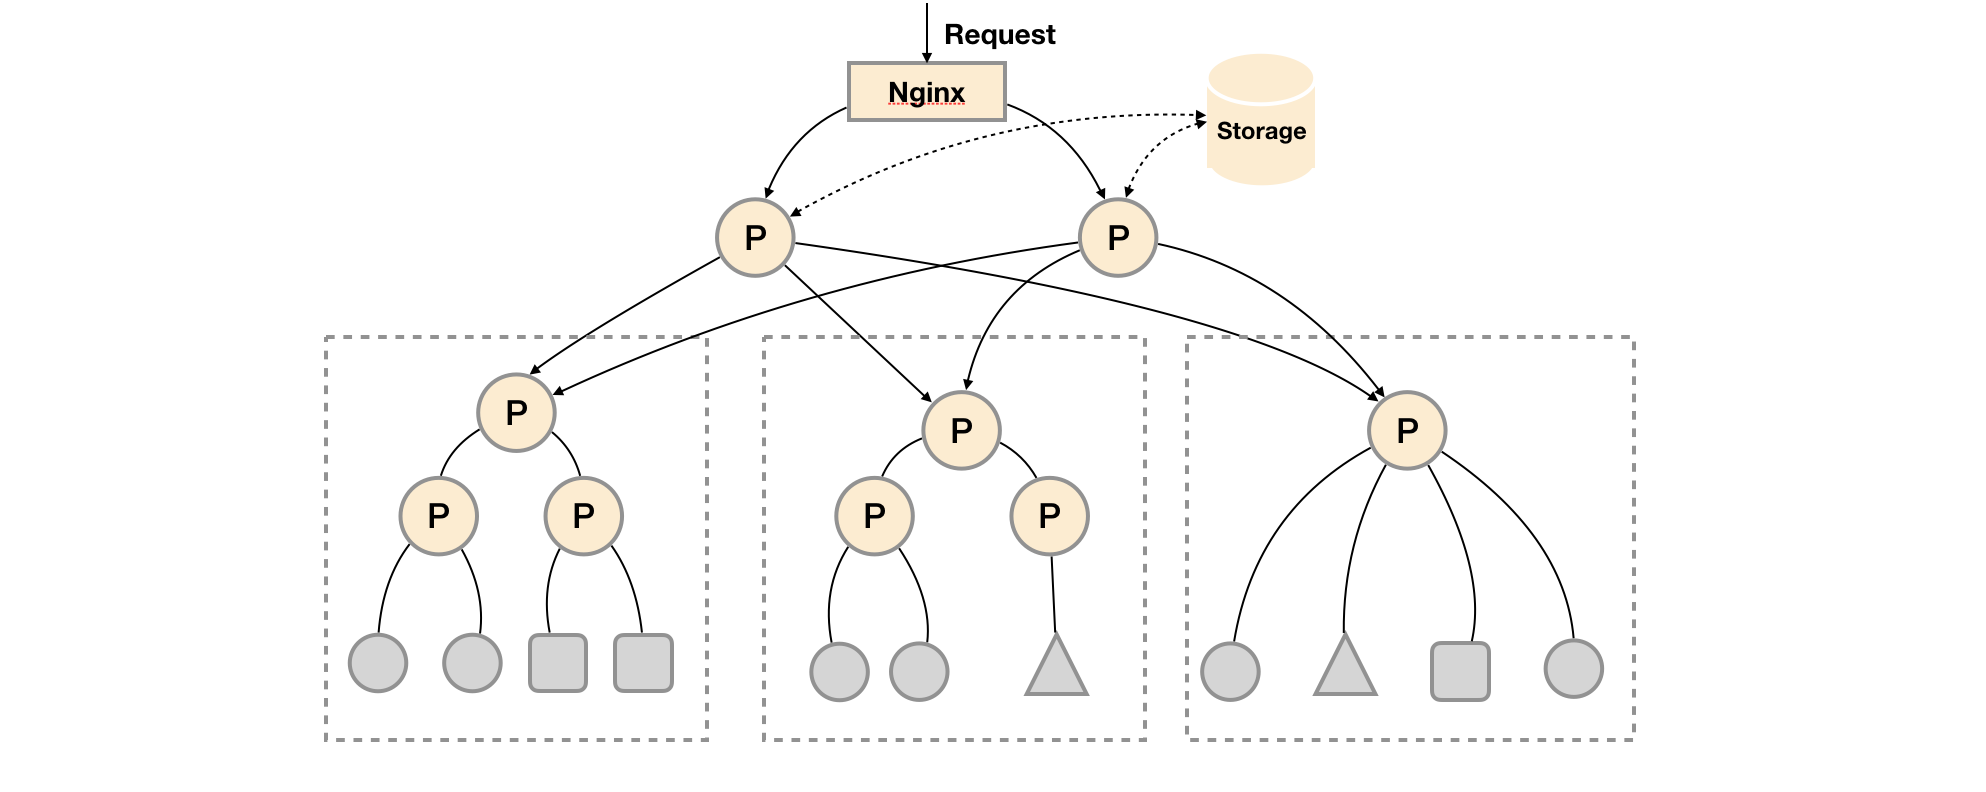
At this time, another extreme case is considered, that is, the number of targets of a single acquisition task becomes very large. At this time, the function partition is simply carried out through the federated cluster, and the Prometheus Server cannot handle it effectively. In this case, you can only consider continuing to divide functions at the instance level.

As shown in the figure above, the monitoring data collection tasks of different instances of the unified task are divided into different Prometheus instances. Through the relabel setting, we can ensure that the current Prometheus Server only collects the monitoring indicators of some instances of the current collection task.
global:
  external_labels:
    slave: 1  # This is the 2nd slave. This prevents clashes between slaves.
scrape_configs:
  - job_name: some_job
    relabel_configs:
    - source_labels: [__address__]
      modulus:       4
      target_label:  __tmp_hash
      action:        hashmod
    - source_labels: [__tmp_hash]
      regex:         ^1$
      action:        keep
The monitoring data is aggregated to the task level through a Prometheus Server in the current data center.
- scrape_config:
  - job_name: slaves
    honor_labels: true
    metrics_path: /federate
    params:
      match[]:
        - '{__name__=~"^slave:.*"}'   # Request all slave-level time series
    static_configs:
      - targets:
        - slave0:9090
        - slave1:9090
        - slave3:9090
        - slave4:9090
5.5 high availability scheme selection
In the above section, three different high availability deployment schemes are demonstrated according to different scenarios. Of course, the promhues deployment scheme needs to be dynamically adjusted by users according to the monitoring scale and their own needs. The following table shows the problems solved by the three options of promhues and high availability. Users can choose flexibly according to their own needs.
| Options \ requirements | Service availability | Data persistence | Horizontal expansion |
|---|---|---|---|
| Active and standby HA | v | x | x |
| Remote storage | x | v | x |
| Federation cluster | x | x | v |
6. Alertmanager high availability
6.1 existing problems
In the previous section, we mainly discussed the high availability of Prometheus Server itself. Next, the focus will be on alarm processing, that is, the Alertmanager part. As shown below.
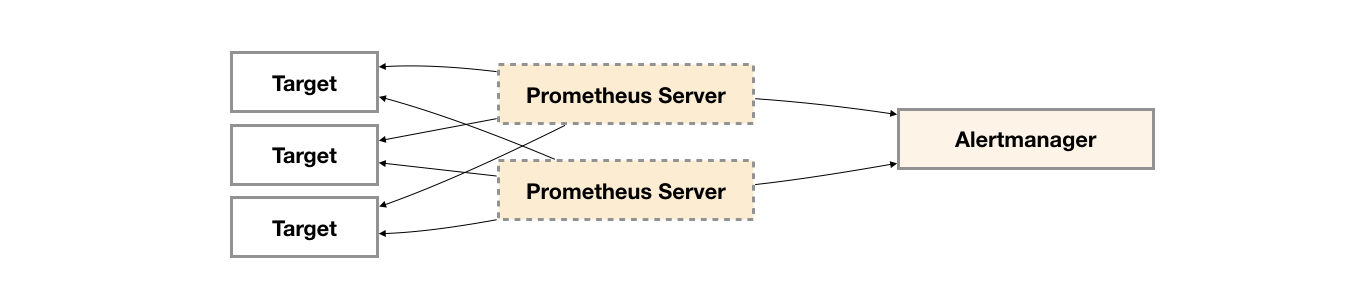
In order to improve the service availability of promthys, users usually deploy two or more promthys servers with exactly the same configuration, including Job configuration and alarm configuration. When a Prometheus Server fails, you can ensure that promhues are continuously available.
At the same time, based on the alarm grouping mechanism of Alertmanager, even if different Prometheus severs send the same alarm to Alertmanager respectively, Alertmanager can automatically combine these alarms into one notification and send them to the receiver.
Unfortunately, although Alertmanager can handle alarms generated by multiple identical Prometheus servers at the same time. However, due to the existence of a single Alertmanager, the current deployment structure has an obvious single point of failure risk. When the Alertmanager fails at a single point, all subsequent businesses of the alarm will fail.
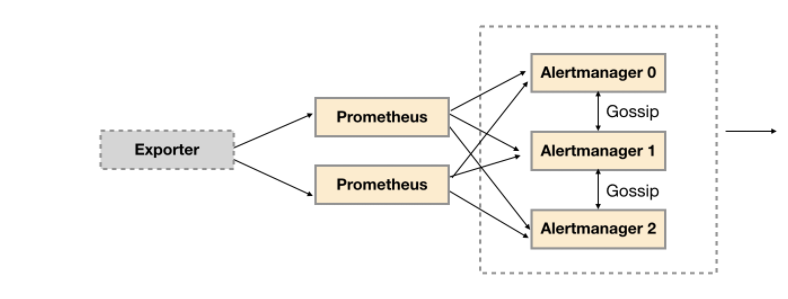
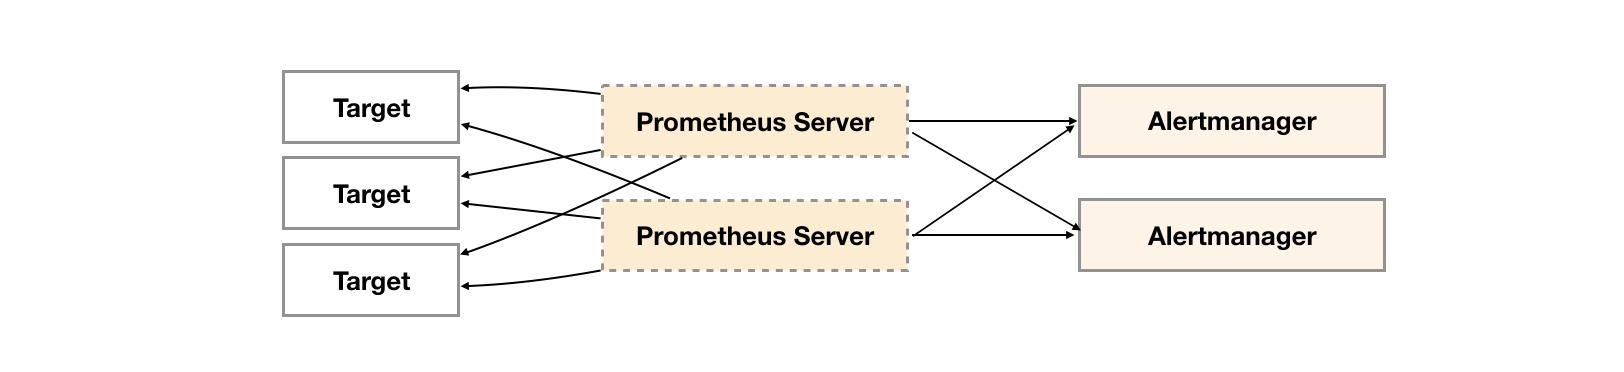
As shown below, the most direct way is to try to deploy multiple sets of alertmanagers. However, since alertmanagers do not exist and do not know each other's existence, there will be the problem that alarm notifications are repeatedly sent by different alertmanagers.
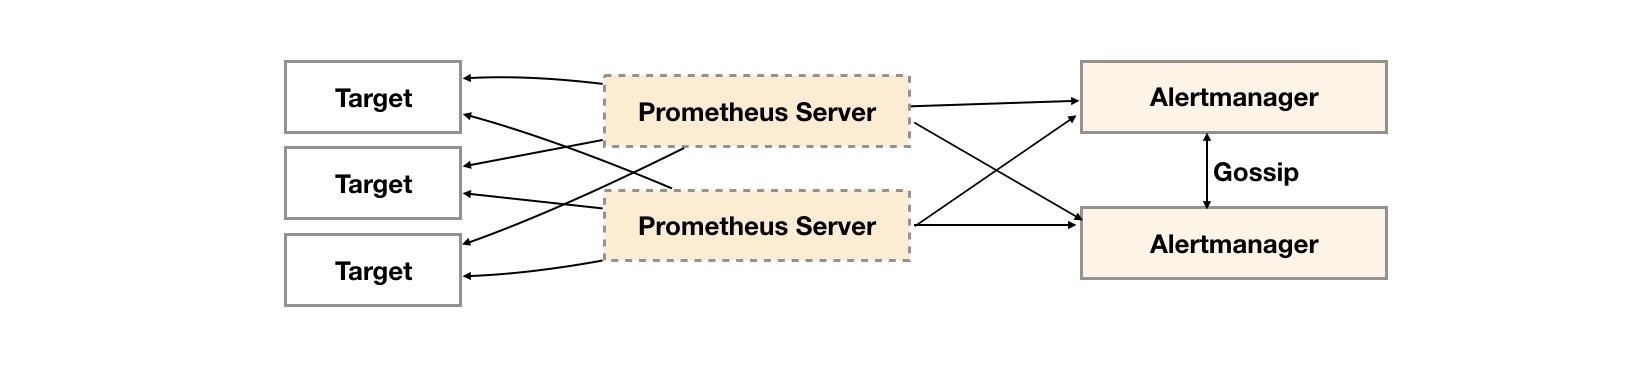
In order to solve this problem, it is shown below. Alertmanager introduces the mission mechanism. The mission mechanism provides a mechanism for information transfer between multiple alertmanagers. Ensure that when multiple alertmanagers receive the same alarm information respectively, only one alarm notification is sent to the Receiver.
6.2 mission agreement
Mission is a widely used protocol in distributed systems, which is used to realize information exchange and state synchronization between distributed nodes. The synchronization status of the mission protocol is similar to the spread of rumors or viruses, as shown below:

Generally speaking, there are two implementations of mission: push based and pull based. In push based, when A node A in the cluster completes A work, it randomly sends corresponding messages from other nodes B. after receiving the message, node B repeatedly completes the same work until it is propagated to all nodes in the cluster. In the pull based implementation, node A will randomly ask node B whether there is A new state to be synchronized. If so, it will return.
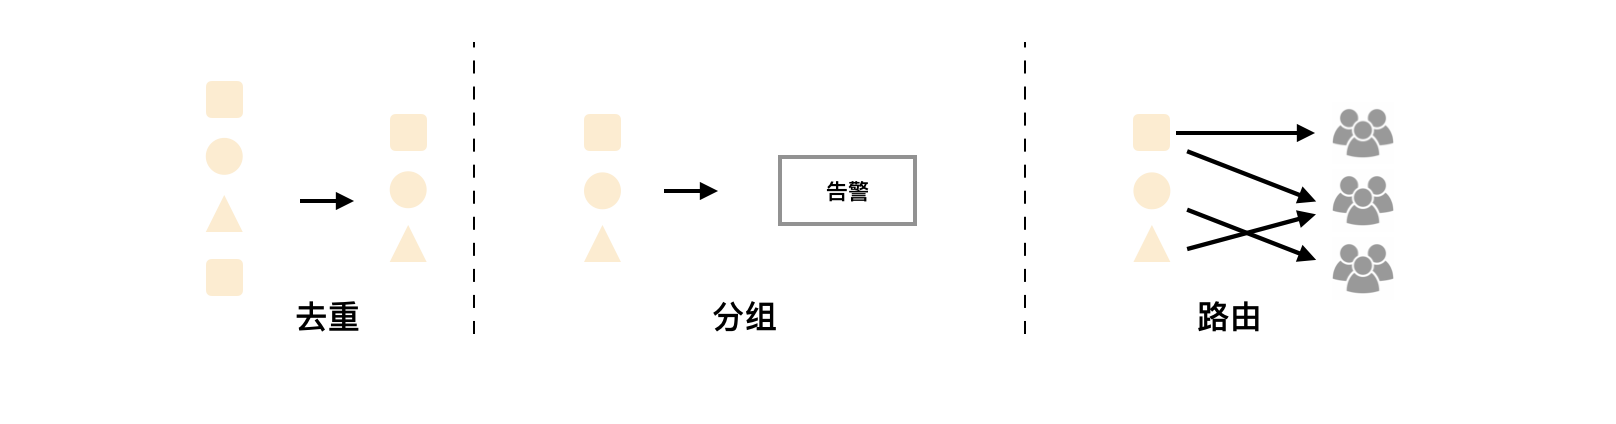
After a brief understanding of the mission protocol, let's see how Alertmanager realizes high availability of clusters based on the mission protocol. As shown below, when Alertmanager receives the alarm message from Prometheus, it will process the alarm according to the following process:
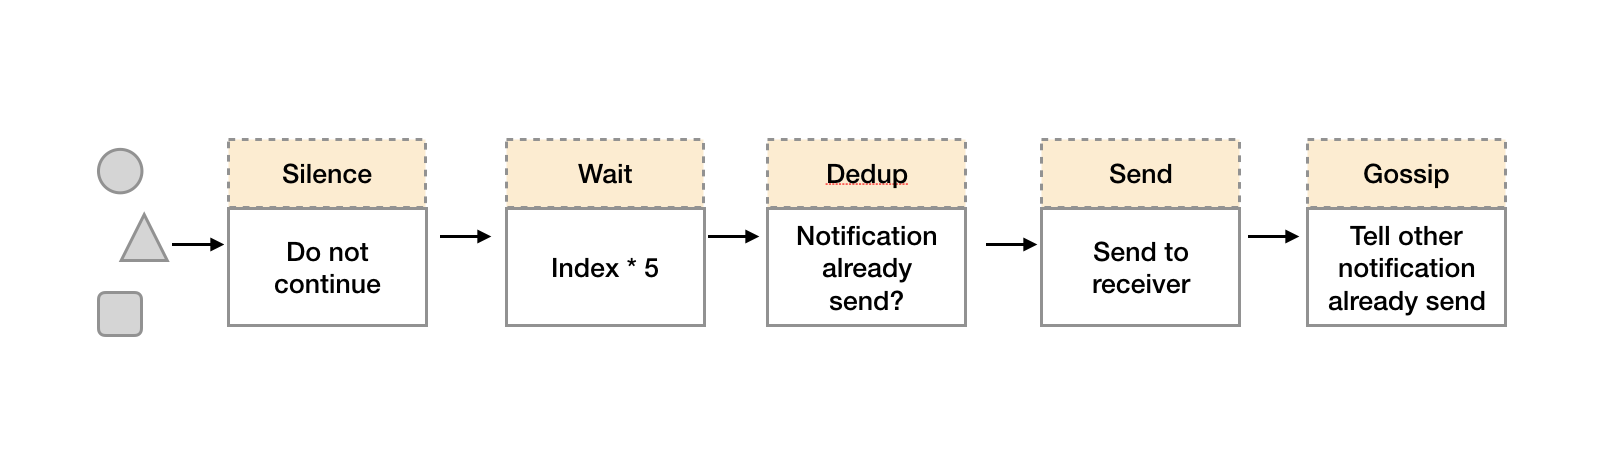
- In the first stage of Silence, the Alertmanager will judge whether the current notification matches any Silence rules. If not, it will enter the next stage. Otherwise, it will interrupt the pipeline and do not send notifications.
- In the second stage of Wait, the Alertmanager will Wait for index * 5s according to the current order (index) of Alertmanager in the cluster.
- After the current Alertmanager waiting phase ends, the Dedup phase will judge whether the notification in the current Alertmanager database has been sent. If it has been sent, the pipeline will be interrupted and no alarm will be sent. Otherwise, it will enter the next phase, Send, and Send an alarm notification to the outside.
- After the alarm is sent, the Alertmanager enters the last stage of mission, which will notify other Alertmanager instances that the current alarm has been sent. After other instances receive the mission message, they will save the record of the notification sent in their own database.
Therefore, as shown below, the key of the mission mechanism lies in two points:
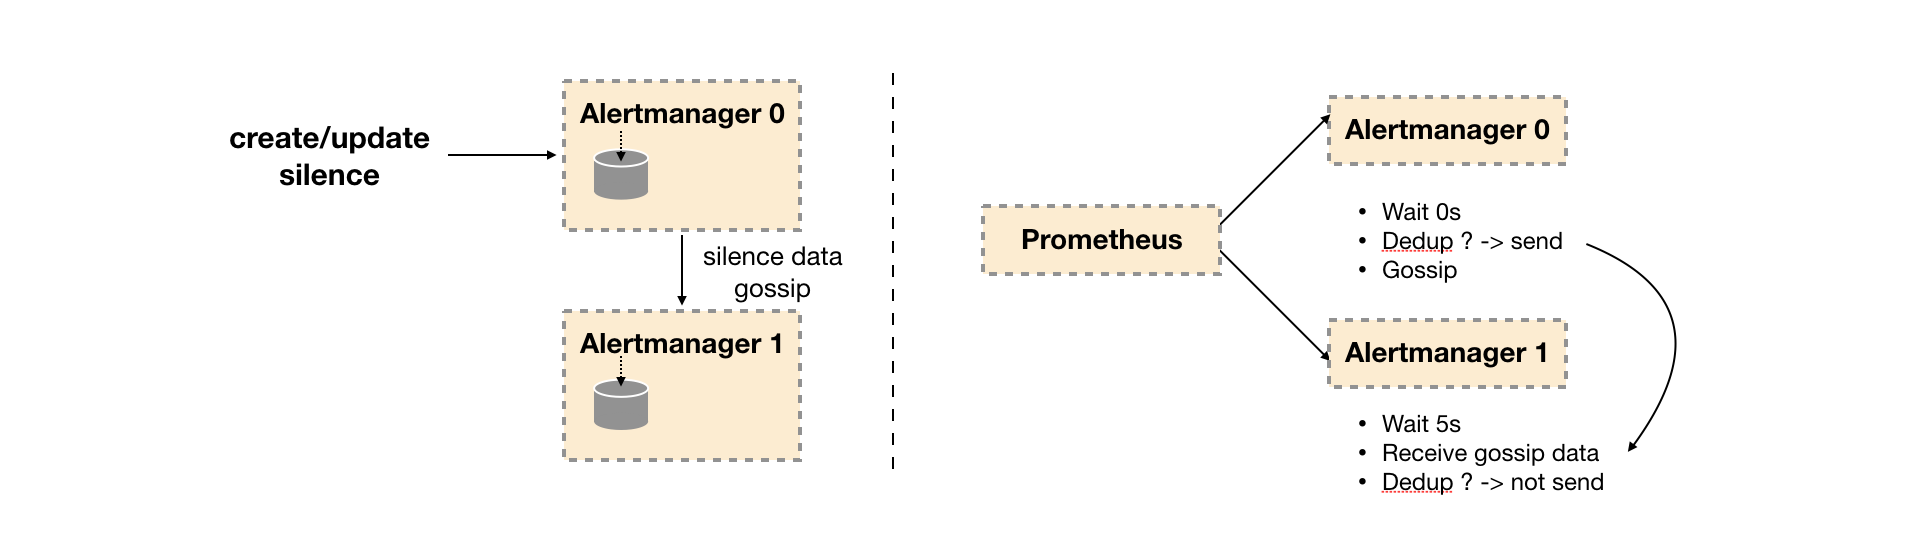
- Silence setting synchronization: during the startup phase of Alertmanager, the silence state is synchronized from other nodes of the cluster based on pull based. When a new silence is generated, the push based method is used to propagate the Gossip information in the cluster.
- Notification sending status synchronization: after the alarm notification is sent, the alarm sending status is synchronized based on push based. The Wait phase ensures that the cluster state is consistent.
Although the cluster mechanism implemented by Alertmanager based on mission can not ensure that the data on all instances is consistent at all times, it implements the AP system in CAP theory, that is, usability and partition fault tolerance. At the same time, the configuration of Prometheus Server is simple, and no state synchronization is required between promthyes servers.
6.3 build local cluster environment
In order to enable communication between Alertmanager nodes, you need to set corresponding parameters when Alertmanager starts. The main parameters include:
--cluster.listen-address string: Listening address of the current instance cluster service
--cluster.peer value: Cluster service address of other associated instances during initialization
6.3.1 deploy Alertmanager cluster (prepare a machine)
Machine: 192.168.197.128
Here, in order to save resources, I start three examples in one machine. The production environment is not recommended to be installed in one machine
-
Define Alertmanager instance 01, where the Alertmanager service runs on port 9093 and the cluster service address runs on port 8001.
-
Define Alertmanager instance 02, where the main service runs on port 9094 and the cluster service runs on port 8002.
-
Define Alertmanager instance 03, where the main service runs on port 9095 and the cluster service runs on port 8002. In order to cluster 01, 02 and 03
Note: the - cluster.peer parameter needs to be defined when starting 02 03 and points to the cluster service address of instance 01: 8001.
| example | Cluster port | Service port |
|---|---|---|
| Alertmanager-01 | 8001 | 9093 |
| Alertmanager-02 | 8002 | 9094 |
| Alertmanager-03 | 8003 | 9095 |
[root@alert-manager-dev-1 src]# cd alertmanager
[root@alert-manager-dev-1 alertmanager]# ls
global:
  resolve_timeout: 5m
  smtp_from: 'h1871099528@163.com'
  smtp_smarthost: 'smtp.163.com:25'
  smtp_auth_username: 'h1871099528@163.com'
  smtp_auth_password: 'ZQWHFEFFALRVKOTP' #The SMTP/POP3/IMAP authentication of the mailbox should be enabled here, and the authorization code should be recorded
  smtp_require_tls: false
route:
  group_by: ['alertname']
  group_wait: 5s
  group_interval: 5s
  repeat_interval: 5m
  receiver: 'email'
  routes:
  - match:
      severity: warning
    receiver: 'email'
    continue: true
  - match_re:
      severity: ^(warning|error)$
    receiver: 'PrometheusAlert'
    continue: true
receivers:
- name: 'PrometheusAlert'
  webhook_configs:
  - url: 'http://192.168.197.130:8080/prometheusalert?type=fs&tpl=prometheus-fs&fsurl=https://open.feishu.cn/open-apis/bot/v2/hook/db16c3aa-5891-4fd9-9a0a-ee5b2efcc1bf&at=jianjunhan@huanle.com'
- name: 'email'
  email_configs:
  - to: '1871099528@qq.com'
    send_resolved: true
inhibit_rules:
  - source_match:
      severity: 'critical'
    target_match:
      severity: 'warning'
    equal: ['alertname', 'dev', 'instance']
Start instance 01:
nohup ./alertmanager --web.listen-address=":9093" --cluster.listen-address="127.0.0.1:8001" --config.file="alertmanager.yml" --log.level=debug 2>&1 > alert1.log &
Start instance 02:
nohup ./alertmanager --web.listen-address=":9094" --cluster.listen-address="127.0.0.1:8002" --cluster.peer=127.0.0.1:8001 --config.file="alertmanager.yml" --storage.path=/data/9094/ --log.level=debug 2>&1 > alert2.log &
Start instance 03:
nohup ./alertmanager --web.listen-address=":9095" --cluster.listen-address="127.0.0.1:8003" --cluster.peer=127.0.0.1:8001 --config.file="alertmanager.yml" --storage.path=/data/9095/ --log.level=debug 2>&1 > alert3.log &
Reload Prometheus
curl -X POST http://localhost:9090/-/reload
perhaps
systemctl restart prometheus
If an error is reported as follows
[root@monitor prometheus]# curl -XPOST localhost:9090/-/reload
Lifecycle API is not enabled.
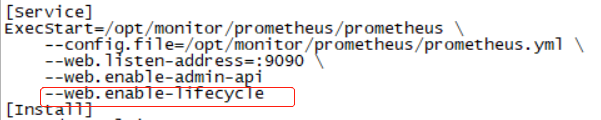
Add – web.enable-lifecycle
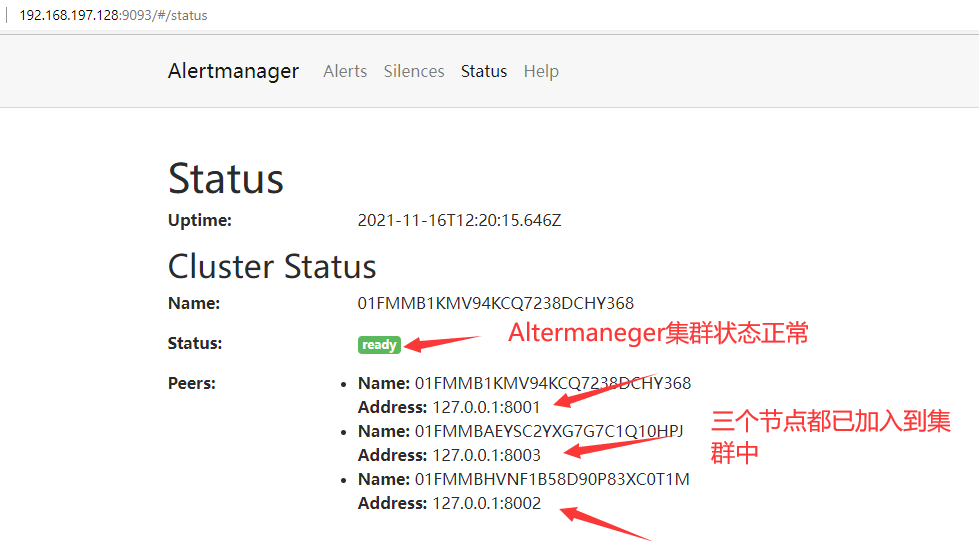
Access any Alertmanager node when finished http://localhost:9093/#/status , you can view the status of the current Alertmanager cluster.
6.3.2 multi instance Prometheus and Alertmanager clusters
Due to the implementation of the mission mechanism, do not use any load balancing between promhues and Alertmanager instances. You need to ensure that promhues sends alarms to all Alertmanager instances:
alerting:
  alertmanagers:
  - static_configs:
    - targets:
      - 127.0.0.1:9093
      - 127.0.0.1:9094
      - 127.0.0.1:9095
Create the promhues cluster configuration file / usr/local/prometheus/prometheus.yml. The complete contents are as follows:
global:
  scrape_interval: 15s
  scrape_timeout: 10s
  evaluation_interval: 15s
rule_files:
  - /usr/local/prometheus/rules/*.rules
alerting:
  alertmanagers:
  - static_configs:
    - targets:
      - 127.0.0.1:9093
      - 127.0.0.1:9094
      - 127.0.0.1:9095
scrape_configs:
- job_name: prometheus
  static_configs:
  - targets:
    - localhost:9090
- job_name: 'node'
  static_configs:
  - targets: ['localhost:9100']
At the same time, define the alarm rule file / usr/local/prometheus/rules/host_monitor.rules, as follows:
[root@prometheus]# vim /usr/local/prometheus/rules/host_monitor.rules
groups:
- name: hostStatsAlert
  rules:
  - alert: hostCpuUsageAlert
    expr: (1- ((sum(increase(node_cpu_seconds_total{mode="idle"}[1m])) by(instance)) / (sum(increase(node_cpu_seconds_total[1m])) by(instance)))) > 0.85
    for: 1m
    labels:
      severity: error
      team: node1
    annotations:
      summary: "Instance {{ $labels.instance }} CPU usgae high"
      description: "{{ $labels.instance }} CPU usage above 85% (current value: {{ $value }})"
  - alert: hostMemUsageAlert
    expr: (node_memory_MemTotal_bytes- node_memory_MemAvailable_bytes) / node_memory_MemTotal_bytes > 0.2
    for: 1m
    labels:
      severity: error
      team: node2
    annotations:
      summary: "Instance {{ $labels.instance }} MEM usgae high"
      description: "{{ $labels.instance }} MEM usage above 85% (current value: {{ $value }})"