Summary
Official website: http://www.graphviz.org/
Graphviz (Graph Visualization Software) is an Open Source Toolkit launched by at & T lab. DOT is a graphic description language, very simple,
Graphviz is a tool for dealing with this language. Just a brief understanding of the DOT language, you can use graphviz drawing, it is particularly useful for programmers.
So in short, if you are a programmer, it is born for you.
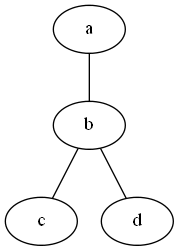
Undirected graph
graph graphname {
    a -- b -- c;
    b -- d;
}
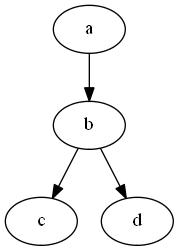
Digraph
digraph graphname {
    a -> b -> c;
    b -> d;
}
attribute
//In the DOT language, you can add different attributes to nodes and edges.

digraph graphname {
    //Attribute of node, name of node
    a [lable = "Foo"];

    //Attribute of node, shape of node
    b [shape = box];

    //Edge properties, edge color
    a -> b -> c [color = blue];

    //Edge attribute, edge line
    b -> d [style = dotted];
}
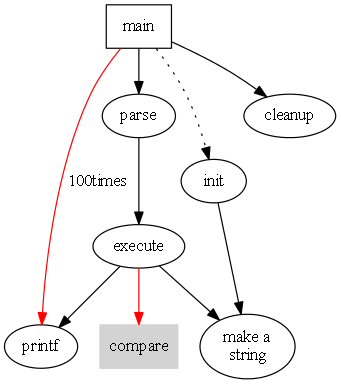
elementary school figure
digraph G {
//Set the size of the picture to 4inch * 4inch
size = "4,4";
main [shape = box];

//Edge importance, default is 1
main->parse [weight = 8];
parse->execute;

//dotted
main->init[style = dotted];
main->cleanup;

//Two lines connected
execute->{make_string;printf}
init->make_string;

//Set the default color of the edge to red
edge [color = red];
main->printf [sytle=bold, label = "100times"];

//Name of the node
make_string [label = "make a\nstring"];

//Set default properties for nodes
node [shape=box,style =filled,color=lightgrey];
execute->compare;
}
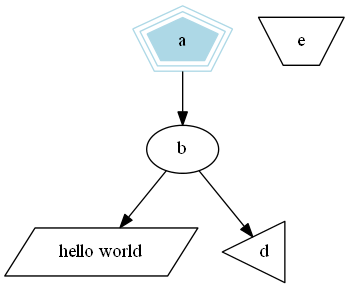
polygon
digraph G{
a -> b -> c;
b -> d;

/* The shape is polygon, the number of sides is 5, the outer frame is 3, the color is light blue, and the style is fill */
a [shape = polygon, sides = 5, peripheries = 3, color = lightblue, style = filled];

/* The shape is polygon, the number of sides is 4, the inclination of angle is 0.4, and the content is hello world*/
c [shape = polygon, sides = 4, skew = 0.4, label = "hello world"];

/* The shape is inverted triangle, and the overall rotation is 30 degrees */
d [shape = invtriangle,orientation = 30];

/* Polygon shape, 4 sides, 0.7 twist */
e [shape = polygon, sides = 4, distortion = 0.7];
}
data structure
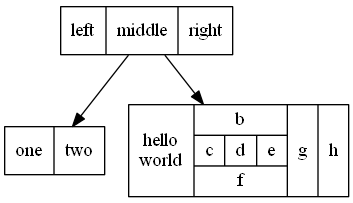
Complex Tags
digraph structs {
/* Set the default shape of the node as rectangular record, and the default shape is rounded rectangle Mrecord */
node [shape = record];

struct1 [label = "left|middle|right"];
struct2 [label = "one|two"];
struct3 [label = "hello\nworld|{b|{c|d|e}|f}|g|h"];

struct1 -> struct2;
struct1 -> struct3;
}
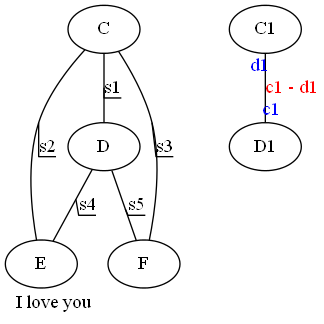
graph picture {
//The name of this picture
label = "I love you";

//The name of the graph is in bottom, or t
labelloc = b;

//The location of the figure name is left, or r
labeljust = l;

edge[decorate = true];

C -- D [label = "s1"];
C -- E [label = "s2"];
C -- F [label = "s3"];
D -- E [label = "s4"];
D -- F [label = "s5"];

edge[decorate = false, labelfontcolor = blue, fontcolor = red];
C1 -- D1 [headlabel = "c1",taillabel = "d1",label = "c1 - d1"];
}
line up icon
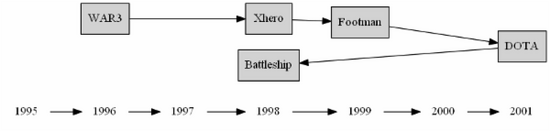
digraph html {
rankdir = LR;
{
node[shape = plaintext];
1995 -> 1996 -> 1997 -> 1998 -> 1999 -> 2000 -> 2001;
}
{
node[shape = box, style = filled];
WAR3 -> Xhero -> Footman -> DOTA:
WAR3 -> Battleship;
}
{rank = same; 1996; WAR3;}
{rank = same; 1998; Xhero; Battleship;}
{rank = same; 1999; Footman;}
{rank = same; 2001; DOTA;}
}
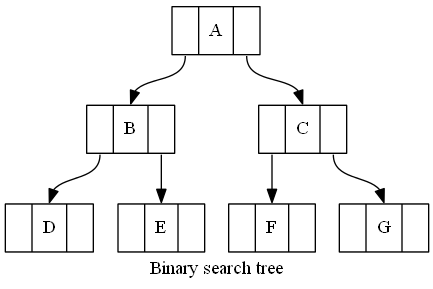
Binary tree
digraph G {
label = "Binary search tree";
node [shape = record];

A [label = "<f0>|<f1>A|<f2>"];
B [label = "<f0>|<f1>B|<f2>"];
C [label = "<f0>|<f1>C|<f2>"];
D [label = "<f0>|<f1>D|<f2>"];
E [label = "<f0>|<f1>E|<f2>"];
F [label = "<f0>|<f1>F|<f2>"];
G [label = "<f0>|<f1>G|<f2>"];

A:f0 -> B:f1;
A:f2 -> C:f1;
B:f0 -> D:f1;
B:f2 -> E:f1;
C:f0 -> F:f1;
C:f2 -> G:f1;
}
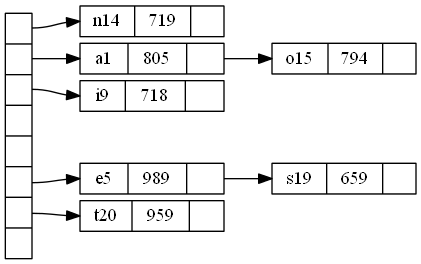
Hashtable
digraph G{
nodesep = .05;
rankdir = LR;

node [shape = record,width = .1,height = .1];
node0 [label = "<f0>|<f1>|<f2>|<f3>|<f4>|<f5>|<f6>|",height = 2.5];

node [width = 1.5];
node1 [label = "{<n>n14|719|<p>}"];
node2 [label = "{<n>a1|805|<p>}"];
node3 [label = "{<n>i9|718|<p>}"];
node4 [label = "{<n>e5|989|<p>}"];
node5 [label = "{<n>t20|959|<p>}"];
node6 [label = "{<n>o15|794|<p>}"];
node7 [label = "{<n>s19|659|<p>}"];

node0:f0 -> node1:n;
node0:f1 -> node2:n;
node0:f2 -> node3:n;
node0:f5 -> node4:n;
node0:f6 -> node5:n;
node2:p -> node6:n;
node4:p -> node7:n;
}
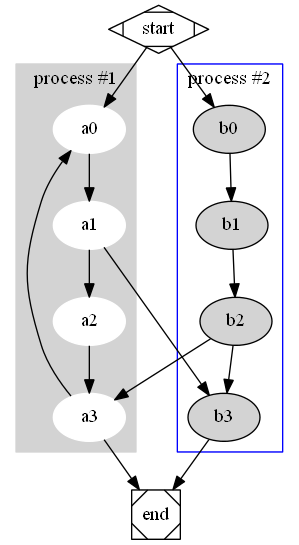
flow chart
digraph G{
subgraph cluster0 {
node [style = filled,color = white];
style = filled;
color = lightgrey;
a0 -> a1 -> a2 -> a3;
label = "process #1";
}

subgraph cluster1 {
node [style = filled];
b0 -> b1 -> b2 -> b3;
label = "process #2";
color = blue;
}

start -> a0;
start -> b0;
a1 -> b3;
b2 -> a3;
a3 -> a0;
a3 -> end;
b3 -> end;
start [shape = Mdiamond];
end [shape = Msquare];
}
Reference
[1] http://zh.wikipedia.org/zh-cn/DOT Brief introduction of language, DOT language.
[2] http://zh.wikipedia.org/zh/Graphviz , simple background knowledge.
From: http://blog.csdn.net/zhangskd/article/details/8250470?utm_source=tuicool&utm_medium=referral
above.
0.png