Software breakpoint
- int3 instruction
- The machine code is 1 byte, i.e. 0xCC
- No quantity limit
- limitations
- It belongs to a code type breakpoint, that is, it can stop the CPU when it executes to an address in the code segment. It is not applicable to the data segment and I/O space
- For programs executed in ROM (read only memory) (such as BIOS or other firmware programs), software breakpoints cannot be dynamically added. Because the target memory is read-only, the breakpoint instruction cannot be written dynamically. At this point, we will use the hardware breakpoints we will introduce later.
experiment
windbg is used to set the breakpoint for MessageBoxW. windbg will change the breakpoint to int3 only when the program is running
0:011> u user32!MessageBoxW
USER32!MessageBoxW:
7594f280 8bff            mov     edi,edi
7594f282 55              push    ebp
7594f283 8bec            mov     ebp,esp
7594f285 833d941c977500  cmp     dword ptr [USER32!gfEMIEnable (75971c94)],0
7594f28c 7422            je      USER32!MessageBoxW+0x30 (7594f2b0)
7594f28e 64a118000000    mov     eax,dword ptr fs:[00000018h]
7594f294 ba9c219775      mov     edx,offset USER32!gdwEMIThreadID (7597219c)
7594f299 8b4824          mov     ecx,dword ptr [eax+24h]
0:011> bp user32!MessageBoxW
Check whether the place of the next breakpoint becomes 0xCC
We start another windbg attachment to observe that the same process cannot be attached by two debuggers, so we use non intrusive mode and non intrusive mode
0:000> u user32!MessageBoxW
USER32!MessageBoxW:
7594f280 cc              int     3
7594f281 ff558b          call    dword ptr [ebp-75h]
7594f284 ec              in      al,dx
7594f285 833d941c977500  cmp     dword ptr [USER32!gfEMIEnable (75971c94)],0
7594f28c 7422            je      USER32!MessageBoxW+0x30 (7594f2b0)
7594f28e 64a118000000    mov     eax,dword ptr fs:[00000018h]
7594f294 ba9c219775      mov     edx,offset USER32!gdwEMIThreadID (7597219c)
7594f299 8b4824          mov     ecx,dword ptr [eax+24h]
hardware breakpoint
- CPU based debug register
- Breakpoints can be set for code, data access, and IO access
- When the breakpoint is triggered, the CPU generates exception 1
- Limited by the number of debug registers
- The ba command of Windbg sets the hardware breakpoint
- In multiprocessor systems, hardware breakpoints are CPU related, that is, hardware breakpoints set for one CPU are applicable to other CPUs
CPU s above Intel 80306 provide us with debugging registers for software debugging, and hardware breakpoints are realized by setting debugging registers.
The figure shows the eight debug registers under the 32-bit operating system provided by Intel manual. DR0-DR3 is the address for setting breakpoints, and DR4 and DR5 are reserved.
DR6 is some information displayed after the debugging exception is generated. DR7 saves information such as whether the breakpoint is enabled, breakpoint type and length.
When using hardware breakpoints, we need to set the debug register, set the location of the breakpoint to DR0-DR3, the length of the breakpoint to LEN0-LEN3 of DR7, the type of the breakpoint to RW0-RW3 of DR7, and whether to enable the breakpoint to L0-L3 of DR7.
The DR0-DR3 required to set the hardware breakpoint is very simple, that is, the address of the lower breakpoint. The DR7 register is very complex, and the bit segment information structure is as follows:
typedef struct _DBG_REG7
{
    /*
    // Flag bits of local breakpoint (L0~3) and global breakpoint (G0~3)
    */
    unsigned L0 : 1;  // Enable local breakpoints for addresses saved by Dr0
    unsigned G0 : 1;  // Enable global breakpoints for addresses saved by Dr0
    unsigned L1 : 1;  // Enable local breakpoints for addresses saved by Dr1
    unsigned G1 : 1;  // Enable global breakpoints for addresses saved by Dr1
    unsigned L2 : 1;  // Enable local breakpoints for addresses saved by Dr2
    unsigned G2 : 1;  // Enable global breakpoints for addresses saved by Dr2
    unsigned L3 : 1;  // Enable local breakpoints for addresses saved by Dr3
    unsigned G3 : 1;  // Enable global breakpoints for addresses saved by Dr3
                      /*
                      // [[discard] is used to reduce CPU frequency to facilitate accurate detection of breakpoint exceptions
                      */
    unsigned LE : 1;
    unsigned GE : 1;
    /*
    // Reserved fields
    */
    unsigned Reserve1 : 3;
    /*
    // Protect the debug register flag bit. If this bit is 1, an exception will be triggered when an instruction modification bar is a register
    */
    unsigned GD : 1;
    /*
    // Reserved fields
    */
    unsigned Reserve2 : 2;

    unsigned RW0 : 2;  // Set the breakpoint type of Dr0 pointing to the address
    unsigned LEN0 : 2;  // Set the breakpoint length of Dr0 to the address
    unsigned RW1 : 2;  // Set the breakpoint type of Dr1 pointing to the address
    unsigned LEN1 : 2;  // Set the breakpoint length of Dr1 to the address
    unsigned RW2 : 2;  // Set the breakpoint type of Dr2 pointing to the address
    unsigned LEN2 : 2;  // Set the breakpoint length of Dr2 to the address
    unsigned RW3 : 2;  // Set the breakpoint type of Dr3 pointing to the address
    unsigned LEN3 : 2;  // Set the breakpoint length of Dr3 to the address
}DBG_REG7, *PDBG_REG7;
It should be noted that when setting hardware breakpoints, the length, type and address of breakpoints are required.
As shown in the figure, save the breakpoint type (RW0-RW3) and breakpoint length (LEN0-LEN3) of the location pointed to by the DR0-DR3 address. The status description is as follows:
00: execute 01: write 11: read write
00:1 byte 01:2 byte 11:4 byte
When setting a hardware execution breakpoint, the length can only be 1
When setting the read / write breakpoint, if the length is 1, the address does not need to be aligned. If the length is 2, the address must be an integer multiple of 2. If the length is 4, the address must be an integer multiple of 4.
realization
To implement the hardware breakpoint, first get the current thread environment
//Get thread environment
CONTEXT g_Context = { 0 };
g_Context.ContextFlags = CONTEXT_CONTROL;
GetThreadContext(hThread, &g_Context);
Many information about the current thread environment is stored in the CONTEXT structure. The following is the CONTEXT structure found in the winnt.h file
typedef struct _CONTEXT {

    //
    // The flags values within this flag control the contents of
    // a CONTEXT record.
    //
    // If the context record is used as an input parameter, then
    // for each portion of the context record controlled by a flag
    // whose value is set, it is assumed that that portion of the
    // context record contains valid context. If the context record
    // is being used to modify a threads context, then only that
    // portion of the threads context will be modified.
    //
    // If the context record is used as an IN OUT parameter to capture
    // the context of a thread, then only those portions of the thread's
    // context corresponding to set flags will be returned.
    //
    // The context record is never used as an OUT only parameter.
    //

    DWORD ContextFlags;

    //
    // This section is specified/returned if CONTEXT_DEBUG_REGISTERS is
    // set in ContextFlags.  Note that CONTEXT_DEBUG_REGISTERS is NOT
    // included in CONTEXT_FULL.
    //

    DWORD   Dr0;
    DWORD   Dr1;
    DWORD   Dr2;
    DWORD   Dr3;
    DWORD   Dr6;
    DWORD   Dr7;

    //
    // This section is specified/returned if the
    // ContextFlags word contians the flag CONTEXT_FLOATING_POINT.
    //

    FLOATING_SAVE_AREA FloatSave;

    //
    // This section is specified/returned if the
    // ContextFlags word contians the flag CONTEXT_SEGMENTS.
    //

    DWORD   SegGs;
    DWORD   SegFs;
    DWORD   SegEs;
    DWORD   SegDs;

    //
    // This section is specified/returned if the
    // ContextFlags word contians the flag CONTEXT_INTEGER.
    //

    DWORD   Edi;
    DWORD   Esi;
    DWORD   Ebx;
    DWORD   Edx;
    DWORD   Ecx;
    DWORD   Eax;

    //
    // This section is specified/returned if the
    // ContextFlags word contians the flag CONTEXT_CONTROL.
    //

    DWORD   Ebp;
    DWORD   Eip;
    DWORD   SegCs;              // MUST BE SANITIZED
    DWORD   EFlags;             // MUST BE SANITIZED
    DWORD   Esp;
    DWORD   SegSs;

    //
    // This section is specified/returned if the ContextFlags word
    // contains the flag CONTEXT_EXTENDED_REGISTERS.
    // The format and contexts are processor specific
    //

    BYTE    ExtendedRegisters[MAXIMUM_SUPPORTED_EXTENSION];

} CONTEXT;
From the CONTEXT structure, we can see that the debug registers Dr0-Dr3, Dr6 and Dr7 are stored. By setting these registers, we can realize the hardware breakpoint.
Having obtained the current thread environment, the next step is to set the debug register
//Address, type and length of incoming breakpoint
void SetHardBP(DWORD addr, BreakPointHard type, BreakPointLen len)
{
    //Use the bit segment information of the DR7 register above
    DBG_REG7 *pDr7 = (DBG_REG7 *)&g_Context.Dr7;

    if (len == 1)
    {
        //Two byte alignment granularity
        addr = addr - addr % 2;
    }
    else if (len == 3)
    {
        //Four byte alignment granularity
        addr = addr - addr % 4;
    }

    if (pDr7->L0 == 0)
    {
        g_Context.Dr0 = addr;   //Use Dr0 register to store address
        pDr7->RW0 = type;       //RW0 setting type in Dr7 register
        pDr7->LEN0 = len;        //LEN0 in the Dr7 register sets the length
        pDr7->L0 = 1;            //L0 in the Dr7 register enables breakpoints
    }
    else if (pDr7->L1 == 0)
    {
        g_Context.Dr1 = addr;
        pDr7->RW1 = type;
        pDr7->LEN1 = len;
        pDr7->L1 = 1;
    }
    else if (pDr7->L2 == 0)
    {
        g_Context.Dr2 = addr;
        pDr7->RW2 = type;
        pDr7->LEN2 = len;
        pDr7->L2 = 1;
    }
    else if (pDr7->L3 == 0)
    {
        g_Context.Dr3 = addr;
        pDr7->RW3 = type;
        pDr7->LEN3 = len;
        pDr7->L3 = 1;
    }
}
After setting the information of the debug register, we need to save the current environment
//Set current environment
SetThreadContext(hThread, &g_Context);
Realize single step debugging
When TF=1, CPU will be interrupted, and the flag register will automatically press the stack. In the interrupt service program, the interrupt service program will change (artificially change) the setting of TF bit in the stack, TF=0, and finally pop up the flag register to CPU,
Therefore, it will not produce the repeated interrupt you said (some programs need single-step interrupt during debugging, at this time, just set TF to 1)
//Set TF flag bit
void SetTrapFlag() {
    CONTEXT context = {0};
    GetDebuggeeContext(&context);
    context.EFlags |= 0x100;
    SetDebuggeeContext(&context);

}
Implement step out
Step out is to set a breakpoint at the address of ebp+4. ebp+4 saves the return address of the function and the next instruction of the call instruction of the previous function
BOOL MoveOut()
{
    // Get ebp
    CONTEXT    Context = {0};
    GetDebuggeeContext(&Context);
    // Get the return address saved at ebp+4
    SIZE_T    addr = 0;
    if(!ReadDebuggeeMemory(Context.Ebp + 4,sizeof(addr),(LPVOID)&addr))
    {
        return FALSE;
    }
    // Set one-time breakpoints
    SetCCBreakPointAt(addr,SOFTTYPE_ONCE);
    return TRUE;
}
Step by step implementation
Step through is to obtain the length of the next instruction and the breakpoint under the next instruction
//Step by step, get the length of the eip next instruction, and cross the breakpoint under this instruction, so that it will not enter the call
BOOL MoveOver()
{
    CONTEXT    Context = {0};
    GetDebuggeeContext(&Context);
    SIZE_T addr = GetCoodeLen(Context.Eip) + Context.Eip;
    SetCCBreakPointAt(addr,SOFTTYPE_ONCE);
    return TRUE;
}
Basic process of user mode debugging
Write the simplest additional debugger
int main(int argc,TCHAR *argv[])
{
    DWORD dwPID;
       BOOL waitEvent = TRUE;
    if (argc > 1) {
        dwPID = atoi(argv[1]);
    }
    else {
        printf("usage: MyDebugger.exe dwPID\n");
        exit(0);
    }

    DebugActiveProcess(dwPID);
    while (waitEvent)
    {
        DEBUG_EVENT MyDebugInfo;
        waitEvent = WaitForDebugEvent(&MyDebugInfo, INFINITE); // Waiting
        switch (MyDebugInfo.dwDebugEventCode)
        {
            case EXIT_PROCESS_DEBUG_EVENT:
                waitEvent = FALSE
                break;
        }
        if (waitEvent) {
            ContinueDebugEvent(debugEvent.dwProcessId, debugEvent.dwThreadId, DBG_CONTINUE);
        }
    }
    return 0;
}
DebugActiveProcess, a debugging API, performs additional debugging operations on the target PID process. If we want to debug the program when it is created, we can execute CreateProcess in Debugger and pass the sixth parameter into DEBUG_ONLY_THIS_PROCESS. After this setting, the debugging events of the child process will be notified to the parent process for processing.
CreateProcess(path, // Executable module path
    NULL, // command line
    NULL, // Security Descriptors
    NULL, // Whether thread properties are inheritable
    FALSE, // No, the handle is inherited from the calling process
    DEBUG_ONLY_THIS_PROCESS, // Start in debug only mode
    NULL, // Environment block for new process
    NULL, // Current working path of the new process (current directory)
    &stcStartupInfo, // Specifies the main window properties of the process
    &stcProcInfo)) // Receive the identification information of the new process
DEBUG_ dwDebugEventCode in event indicates the type of debugging information. For debug_ For the detailed introduction of event, you can view MSDN. In short, it uses a common body to store specific data.
typedef struct _DEBUG_EVENT {
    DWORD dwDebugEventCode;
    DWORD dwProcessId;
    DWORD dwThreadId;
    union {
        EXCEPTION_DEBUG_INFO Exception;
        CREATE_THREAD_DEBUG_INFO CreateThread;
        CREATE_PROCESS_DEBUG_INFO
        CreateProcessInfo;
        EXIT_THREAD_DEBUG_INFO ExitThread;
        EXIT_PROCESS_DEBUG_INFO ExitProcess;
        LOAD_DLL_DEBUG_INFO LoadDll;
        UNLOAD_DLL_DEBUG_INFO UnloadDll;
        OUTPUT_DEBUG_STRING_INFO DebugString;
        RIP_INFO RipInfo;
    } u;
} DEBUG_EVENT, *LPDEBUG_EVENT;
Implementation of user mode DebugActiveProcess
The specific implementation code of DebugActiveProcess mainly calls three functions: DbgUiConnectToDbg, ProcessIdToHandle and DbgUiDebugActiveProcess
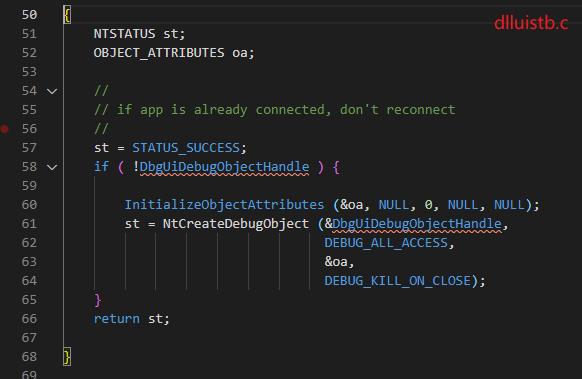
DbgUiConnectToDbg
First, judge whether TEB - > dbgsreserved [1] saves the handle of the debugging object. If it exists, it will directly return the function. If it does not exist, it will initialize and call NtCreateDebugObject to create the debugging object
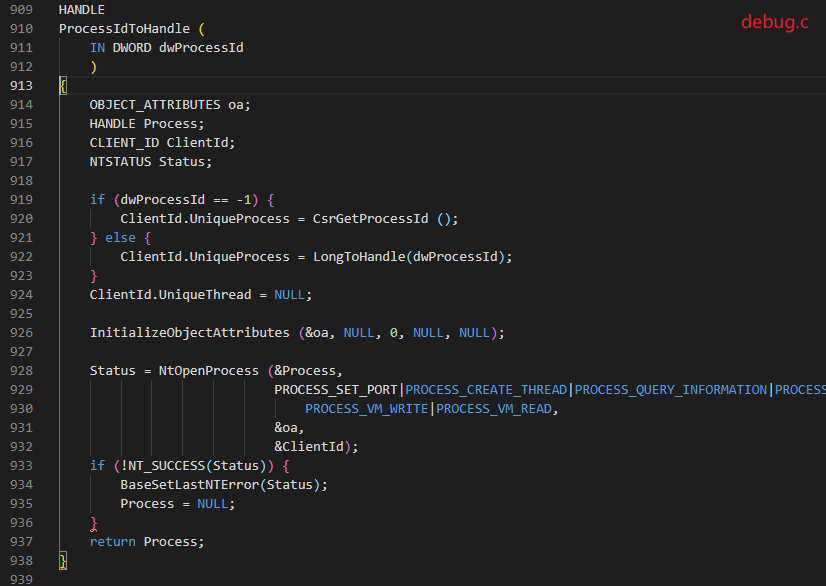
ProcessIdToHandle
If it is a pseudo handle, it calls CsrGetProcessId to get the PID of csrss.exe, then calls NtOpenProcess to get the corresponding process handle to prepare for subsequent invocation.
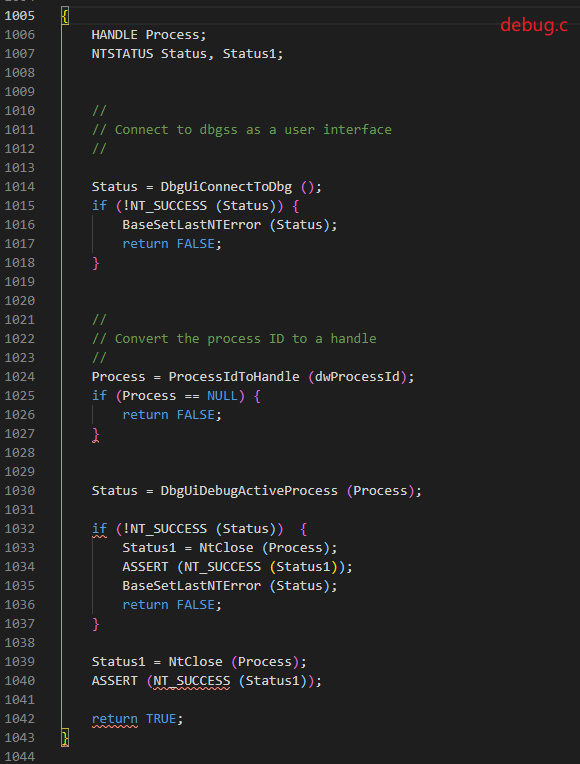
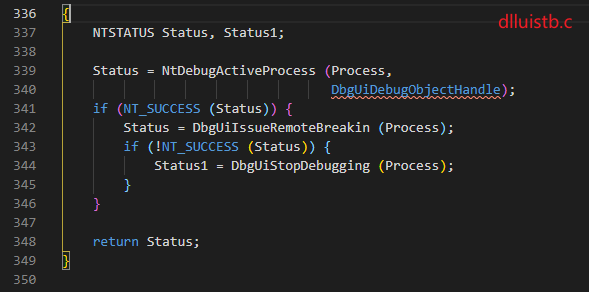
DbgUiDebugActiveProcess
This function first introduces the handle of the process and debug object into the kernel, then calls the DbgUiIssueRemoteBreakin function to create a thread with a thread beginning at DbgUiRemoteBreakin, which allows the debugging process to be broken. If the remote thread setting fails, the DbgUiStopDebugging is called to stop debugging.
Panorama