Data download: http://www.highcharts.com/download
Download File:
Open after decompression: 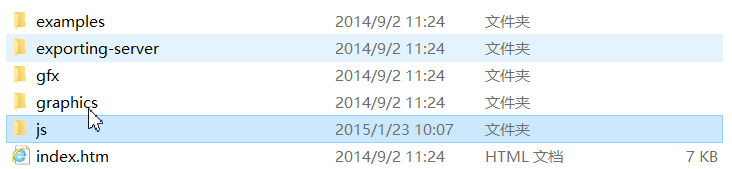
We can copy all the files under js to our project, for example, I put them in the highcharts folder
1. Import the highcharts file:
<script type="text/javascript" src="../js/jquery-1.8.3.js"></script>
        <!--highcharts Core document-->
        <script type="text/javascript" src="../js/highcharts/highcharts.js"></script>
        <!--Printing function-->
        <script type="text/javascript" src="../js/highcharts/modules/exporting.js"></script>
2. Open the index.htm file in the unzip file. After opening it in the browser, we can see various types of charts. We just need to check the source code and copy it for use
3. take the histogram as an example:
First, find the demo of the histogram: 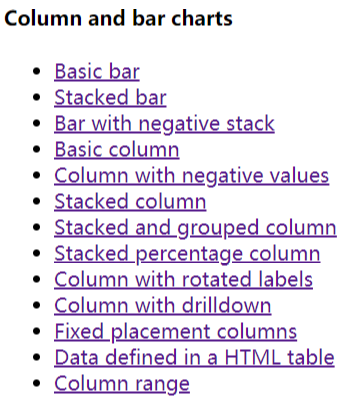
Here I choose Colume with drilldown: 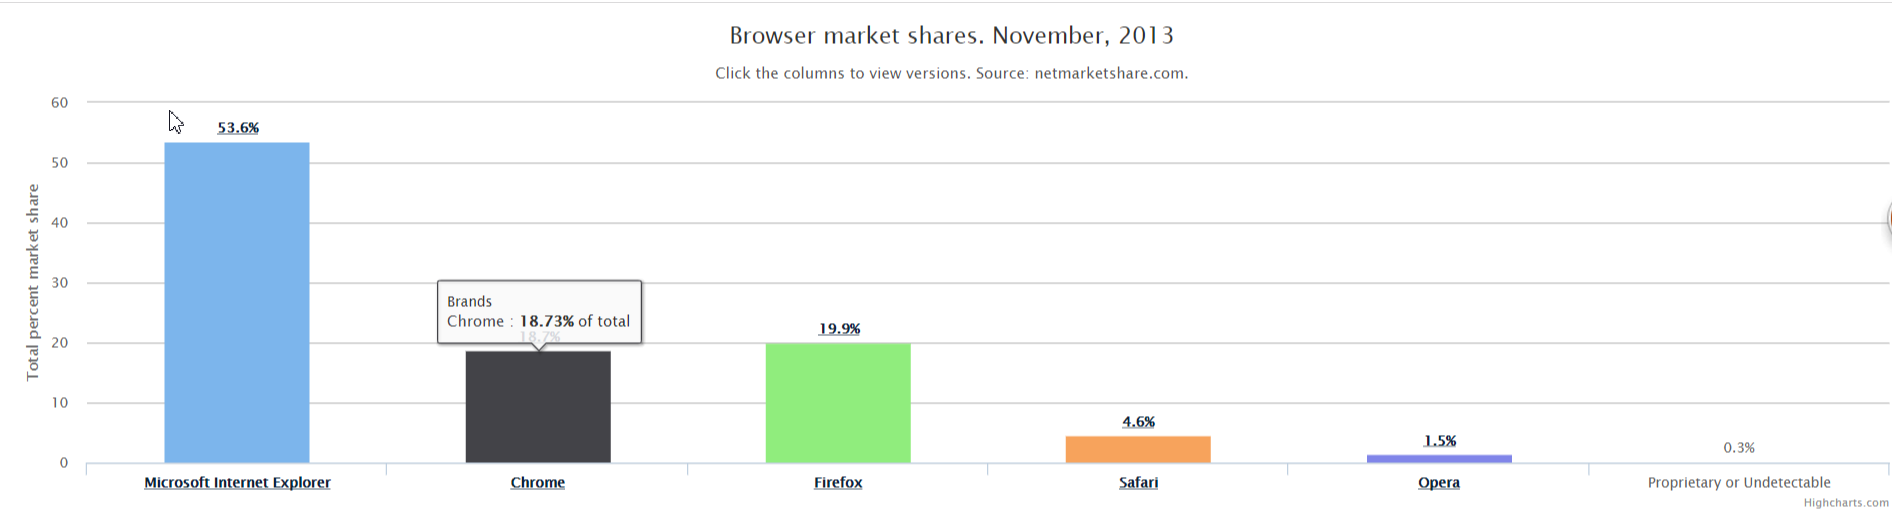
Next, right-click to view the source code, copy the whole section to our html, and then modify the fields we need:
Source code:
<!DOCTYPE HTML>
<html>
    <head>
        <meta http-equiv="Content-Type" content="text/html; charset=utf-8">
        <title>Highcharts Example</title>

        <script src="../../js/jquery-1.8.3.min.js"></script>
        <style type="text/css">
${demo.css}
        </style>
        <script type="text/javascript">
$(function () {

    Highcharts.data({
        csv: document.getElementById('tsv').innerHTML,
        itemDelimiter: '\t',
        parsed: function (columns) {

            var brands = {},
                brandsData = [],
                versions = {},
                drilldownSeries = [];

            // Parse percentage strings
            columns[1] = $.map(columns[1], function (value) {
                if (value.indexOf('%') === value.length - 1) {
                    value = parseFloat(value);
                }
                return value;
            });

            $.each(columns[0], function (i, name) {
                var brand,
                    version;

                if (i > 0) {

                    // Remove special edition notes
                    name = name.split(' -')[0];

                    // Split into brand and version
                    version = name.match(/([0-9]+[\.0-9x]*)/);
                    if (version) {
                        version = version[0];
                    }
                    brand = name.replace(version, '');

                    // Create the main data
                    if (!brands[brand]) {
                        brands[brand] = columns[1][i];
                    } else {
                        brands[brand] += columns[1][i];
                    }

                    // Create the version data
                    if (version !== null) {
                        if (!versions[brand]) {
                            versions[brand] = [];
                        }
                        versions[brand].push(['v' + version, columns[1][i]]);
                    }
                }

            });

            $.each(brands, function (name, y) {
                brandsData.push({
                    name: name,
                    y: y,
                    drilldown: versions[name] ? name : null
                });
            });
            $.each(versions, function (key, value) {
                drilldownSeries.push({
                    name: key,
                    id: key,
                    data: value
                });
            });

            // Create the chart
            $('#container').highcharts({
                chart: {
                    type: 'column'
                },
                title: {
                    text: 'Browser market shares. November, 2013'
                },
                subtitle: {
                    text: 'Click the columns to view versions. Source: netmarketshare.com.'
                },
                xAxis: {
                    type: 'category'
                },
                yAxis: {
                    title: {
                        text: 'Total percent market share'
                    }
                },
                legend: {
                    enabled: false
                },
                plotOptions: {
                    series: {
                        borderWidth: 0,
                        dataLabels: {
                            enabled: true,
                            format: '{point.y:.1f}%'
                        }
                    }
                },

                tooltip: {
                    headerFormat: '<span style="font-size:11px">{series.name}</span><br>',
                    pointFormat: '<span style="color:{point.color}">{point.name}</span>: <b>{point.y:.2f}%</b> of total<br/>'
                },

                series: [{
                    name: 'Brands',
                    colorByPoint: true,
                    data: brandsData
                }],
                drilldown: {
                    series: drilldownSeries
                }
            });
        }
    });
});


        </script>
    </head>
    <body>
<script src="../../js/highcharts.js"></script>
<script src="../../js/modules/data.js"></script>
<script src="../../js/modules/drilldown.js"></script>

<div id="container" style="min-width: 310px; height: 400px; margin: 0 auto"></div>

<!-- Data from www.netmarketshare.com. Select Browsers => Desktop share by version. Download as tsv. -->
<pre id="tsv" style="display:none">Browser Version  Total Market Share
Microsoft Internet Explorer 8.0 26.61%
Microsoft Internet Explorer 9.0 16.96%
Chrome 18.0 8.01%
Chrome 19.0 7.73%
Firefox 12  6.72%
Microsoft Internet Explorer 6.0 6.40%
Firefox 11  4.72%
Microsoft Internet Explorer 7.0 3.55%
Safari 5.1  3.53%
Firefox 13  2.16%
Firefox 3.6 1.87%
Opera 11.x  1.30%
Chrome 17.0 1.13%
Firefox 10  0.90%
Safari 5.0  0.85%
Firefox 9.0 0.65%
Firefox 8.0 0.55%
Firefox 4.0 0.50%
Chrome 16.0 0.45%
Firefox 3.0 0.36%
Firefox 3.5 0.36%
Firefox 6.0 0.32%
Firefox 5.0 0.31%
Firefox 7.0 0.29%
Proprietary or Undetectable 0.29%
Chrome 18.0 - Maxthon Edition   0.26%
Chrome 14.0 0.25%
Chrome 20.0 0.24%
Chrome 15.0 0.18%
Chrome 12.0 0.16%
Opera 12.x  0.15%
Safari 4.0  0.14%
Chrome 13.0 0.13%
Safari 4.1  0.12%
Chrome 11.0 0.10%
Firefox 14  0.10%
Firefox 2.0 0.09%
Chrome 10.0 0.09%
Opera 10.x  0.09%
Microsoft Internet Explorer 8.0 - Tencent Traveler Edition  0.09%</pre>

    </body>
</html>
Modified code:
<!DOCTYPE HTML>
<html>
    <head>
        <meta http-equiv="Content-Type" content="text/html; charset=utf-8">
        <title>Histogram</title>
        <script src="../js/jquery-1.8.3.js"></script>
        <style type="text/css">
        </style>
        <script type="text/javascript">
$(function () {

    Highcharts.data({
        csv: document.getElementById('tsv').innerHTML,
        itemDelimiter: '\t',
        parsed: function (columns) {

            var brands = {},
                brandsData = [],
                versions = {},
                drilldownSeries = [];

            // Parse percentage strings
            columns[1] = $.map(columns[1], function (value) {
                if (value.indexOf('%') === value.length - 1) {
                    value = parseFloat(value);
                }
                return value;
            });

            $.each(columns[0], function (i, name) {
                var brand,
                    version;

                if (i > 0) {

                    // Remove special edition notes
                    name = name.split(' -')[0];

                    // Split into brand and version
                    version = name.match(/([0-9]+[\.0-9x]*)/);
                    if (version) {
                        version = version[0];
                    }
                    brand = name.replace(version, '');

                    // Create the main data
                    if (!brands[brand]) {
                        brands[brand] = columns[1][i];
                    } else {
                        brands[brand] += columns[1][i];
                    }

                    // Create the version data
                    if (version !== null) {
                        if (!versions[brand]) {
                            versions[brand] = [];
                        }
                        versions[brand].push(['v' + version, columns[1][i]]);
                    }
                }

            });

            $.each(brands, function (name, y) {
                brandsData.push({
                    name: name,
                    y: y,
                    drilldown: versions[name] ? name : null
                });
            });
            $.each(versions, function (key, value) {
                drilldownSeries.push({
                    name: key,
                    id: key,
                    data: value
                });
            });

            // Create the chart
            $('#container').highcharts({
                chart: {
                    type: 'column'
                },
                title: {
                    text: 'Browser market share, 2018'
                },
                subtitle: {
                    text: 'From Wikipedia big data science popularization'
                },
                xAxis: {
                    type: 'category'
                },
                yAxis: {
                    title: {
                        text: '% of total'
                    }
                },
                legend: {
                    enabled: false
                },
                plotOptions: {
                    series: {
                        borderWidth: 0,
                        dataLabels: {
                            enabled: true,
                            format: '{point.y:.1f}%'
                        }
                    }
                },

                tooltip: {
                    headerFormat: '<span style="font-size:11px">{series.name}</span><br>',
                    pointFormat: '<span style="color:{point.color}">{point.name}</span>: <b>{point.y:.2f}%</b> of total<br/>'
                },

                series: [{
                    name: 'brand',
                    colorByPoint: true,
                    data: brandsData
                }],
                drilldown: {
                    series: drilldownSeries
                }
            });
        }
    });
});


        </script>
    </head>
    <body>
<script src="../js/highcharts/highcharts.js"></script>
<script src="../js/highcharts/modules/data.js"></script>
<script src="../js/highcharts/modules/drilldown.js"></script>

<div id="container" style="min-width: 310px; height: 400px; margin: 0 auto"></div>

<!-- Data from www.netmarketshare.com. Select Browsers => Desktop share by version. Download as tsv. -->
<pre id="tsv" style="display:none">Browser Version  Total Market Share
 Microsoft 8.0  26.61%
Microsoft 9.0  16.96%
Google 18.0 8.01%
Google 19.0 7.73%
Firefox 12 6.72%
Microsoft 6.0  6.40%
Firefox 11 4.72%
Microsoft 7.0  3.55%
Apple Safari 5.1    3.53%
Firefox 13 2.16%
Firefox 3.6  1.87%
Norway Opera 11.x    1.30%
Google 17.0 1.13%
Firefox 10 0.90%
Apple Safari 5.0    0.85%
Firefox 9.0  0.65%
Firefox 8.0  0.55%
Firefox 4.0  0.50%
Google 16.0 0.45%
Firefox 3.0  0.36%
Firefox 3.5  0.36%
Firefox 6.0  0.32%
Firefox 5.0  0.31%
Firefox 7.0  0.29%
Proprietary or undetectable 0.29%
Google 18.0 - Maxthon Edition   0.26%
Google 14.0 0.25%
Google 20.0 0.24%
Google 15.0 0.18%
Google 12.0 0.16%
Norway Opera 12.x    0.15%
Apple Safari 4.0    0.14%
Google 13.0 0.13%
Apple Safari 4.1    0.12%
Google 11.0 0.10%
Firefox 14 0.10%
Firefox 2.0  0.09%
Google 10.0 0.09%
Norway Opera 10.x    0.09%
Microsoft 8.0 - Tencent Traveler Edition   0.09%</pre>

    </body>
</html>
Design sketch: 
ps:
Title: report title
Subtitle: subtitle
xAxis: abscissa
yAxis: ordinate
series: report data