Not much nonsense. Start with historical prize-winning data.
We follow China Sports Color Network Climb the history prize data.
Because the website belongs to static web pages, it is easy to get the desired content, so the crawling process is not described in detail.
Code directly:
import requests
from bs4 import BeautifulSoup as bs
import threading
import queue


class get_history(threading.Thread):
    def __init__(self,task_q,result_q):
        super().__init__()
        self.task_queue=task_q
        self.result_queue=result_q


    def run(self):
        while True:
            if not self.task_queue.empty():
                page=self.task_queue.get()
                one_result=self.crawl(page)
                self.result_queue.put(one_result)
                self.task_queue.task_done()
                print('##Page {page} crawled ~ ~'..format(page))
            else:
                break


    def crawl(self,page):
        url = 'http://www.lottery.gov.cn/historykj/history_{}.jspx?_ltype=dlt'.format(page)
        headers = {
            'user-agent': 'Mozilla / 5.0(Windows NT 10.0;Win64;x64) AppleWebKit / 537.36(KHTML, likeGecko) Chrome / 75.0.3770.142Safari / 537.36',
            'Upgrade-Insecure-Requests': '1',
            'Host': 'www.lottery.gov.cn'
        }
        r = requests.get(url, headers=headers)
        text = bs(r.text, 'lxml')
        result = text.find_all('div', class_='result')
        result = result[0].find_all('tbody')
        result = result[0].find_all('td')
        result_list = []
        for item in result:
            result_list.append(item.get_text())
        one_page=[]
        one_page.append([result_list[19]] + result_list[0:8])
        for i in range(1, 20):
            open_data = result_list[19 + (20 * i)]
            number_list = result_list[20 + (20 * (i - 1)):21 + (20 * (i - 1)) + 7]
#            print([open_data] + number_list)
            one_page.append([open_data] + number_list)
        return one_page


if __name__ == '__main__':
    task_queue=queue.Queue()
    result_queue=queue.Queue()
    for i in range(1,94):
        task_queue.put(i)


    crawl=get_history(task_queue,result_queue)
    crawl.setDaemon(True)
    crawl.start()

    task_queue.join()


    with open('history.txt','a') as f :

        while not result_queue.empty():
            for one in result_queue.get():
                one_line=''
                for item in one:
                    one_line+=item
                f.write(one_line+'\n')
Because multithreading and queuing are used more recently, we also want to use multithreading + queuing at the beginning, but later found that, because the web page itself is very simple to obtain data statically, plus a total of only 90 pages, there is no need for multithreading at all, and a single thread can quickly crawl through. Now that it's written, it's a consolidation exercise for multithreading and queues.~
Save the crawled data to history.txt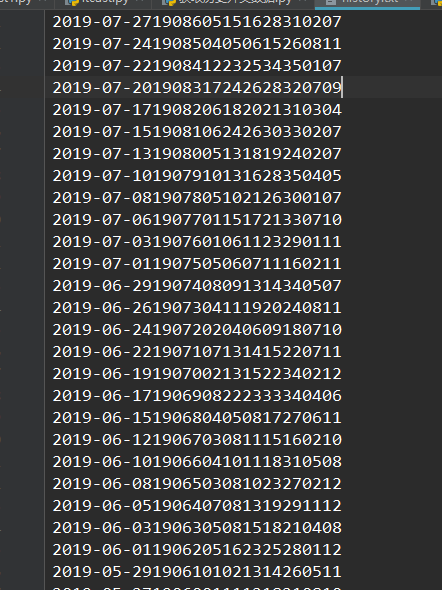
A total of 1860 data were obtained, each of which was the result of a prize opening, equivalent to 1860 prize opening data for 12 years from 2007 to 2019.
With the data, the next step is to make a simple analysis of the historical prize-winning data.
utilize pyecharts Visualization analysis
from collections import Counter
from pyecharts.charts import Bar,Page
from pyecharts import options as opts

def number_analyse():
    red_balls = []
    blue_balls = []
    with open('history.txt', 'r') as  f:
        for i in range(1860):
            oneLine_data = f.readline().strip()
            red_balls.extend([int(oneLine_data[15 + (2 * i):15 + (2 * (i + 1))]) for i in range(5)])
            blue_balls.append(int(oneLine_data[-4:-2]))
            blue_balls.append(int(oneLine_data[-2:]))

    red_counter = Counter(red_balls)
    blue_counter = Counter(blue_balls)
    print(red_balls)
    print(blue_balls)
    print(red_counter)
    print(blue_counter)
    print(red_counter.most_common())
    print(blue_counter.most_common())
    red_dict={}
    blue_dict={}
    for i in red_counter.most_common():#Using counter of collections module to count the occurrence times of each number of red ball and blue ball
        red_dict['{}'.format(i[0])]=i[1]
    for j in blue_counter.most_common():
        blue_dict['{}'.format(j[0])]=j[1]

    print(red_dict)
    print(blue_dict)

    red_list=sorted(red_counter.most_common(),key=lambda number:number[0])#Rearrange the number and number of red and blue balls
    blue_list=sorted(blue_counter.most_common(),key=lambda number:number[0])
    print(red_list)
    print(blue_list)

    red_bar=Bar()
    red_x=['{}'.format(str(x[0])) for x in red_list]
    red_y=['{}'.format(str(x[1])) for x in red_list]
    red_bar.add_xaxis(red_x)
    red_bar.add_yaxis('Number of occurrences of red balls',red_y)
    red_bar.set_global_opts(title_opts=opts.TitleOpts(title='Lottery Lottery',subtitle='Data for the past 12 years'),toolbox_opts=opts.ToolboxOpts()
                            ,yaxis_opts=opts.AxisOpts(axislabel_opts=opts.LabelOpts(formatter="{value}/second")),
                            xaxis_opts=opts.AxisOpts(name='Award Number'))
    red_bar.set_series_opts(markpoint_opts=opts.MarkPointOpts(
        data=[opts.MarkPointItem(type_='max',name='Maximum'),opts.MarkPointItem(type_='min',name='minimum value')]
    ))


    blue_bar=Bar()
    blue_x=['{}'.format(str(x[0])) for x in blue_list]
    blue_y=['{}'.format(str(x[1])) for x in blue_list]
    blue_bar.add_xaxis(blue_x)
    blue_bar.add_yaxis('Number of Blue Balls',blue_y,itemstyle_opts=opts.ItemStyleOpts(color='blue'))
    blue_bar.set_global_opts(title_opts=opts.TitleOpts(title='Lottery Lottery',subtitle='Data for the past 12 years'),toolbox_opts=opts.ToolboxOpts()
                            ,yaxis_opts=opts.AxisOpts(axislabel_opts=opts.LabelOpts(formatter="{value}/second")),
                            xaxis_opts=opts.AxisOpts(name='Award Number'))
    blue_bar.set_series_opts(markpoint_opts=opts.MarkPointOpts(
        data=[opts.MarkPointItem(type_='max',name='Maximum'),opts.MarkPointItem(type_='min',name='minimum value')]
    ))

    page=Page(page_title='Data Analysis of Grand Lottery History Award Opening',interval=3)
    page.add(red_bar,blue_bar)
    page.render('Data Analysis of Grand Lottery History Award Opening.html')
Finally, the chart is saved to "Analysis of Grand Lottery History Award Opening Data. html", and then opened with a browser.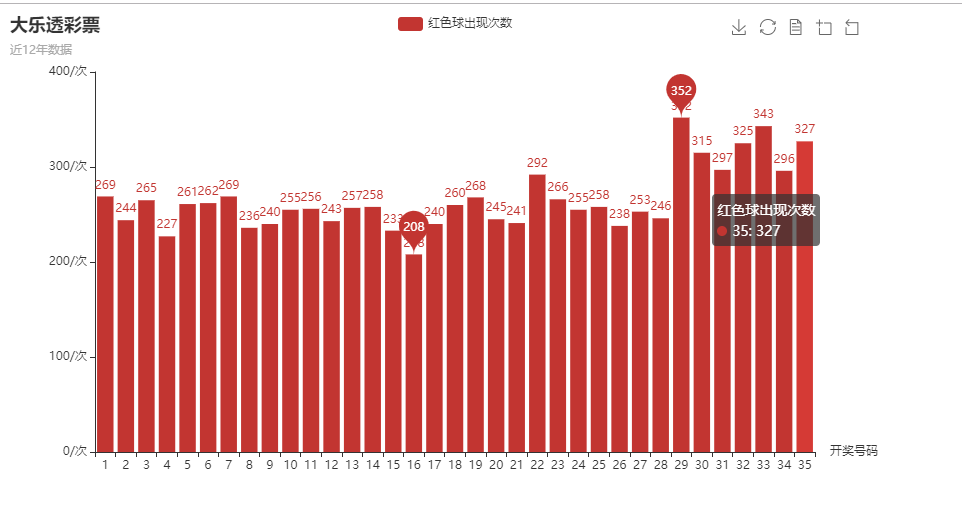
It can be seen that the number of occurrences of red balls is 29, a total of 352, a minimum of 16, a total of 208.
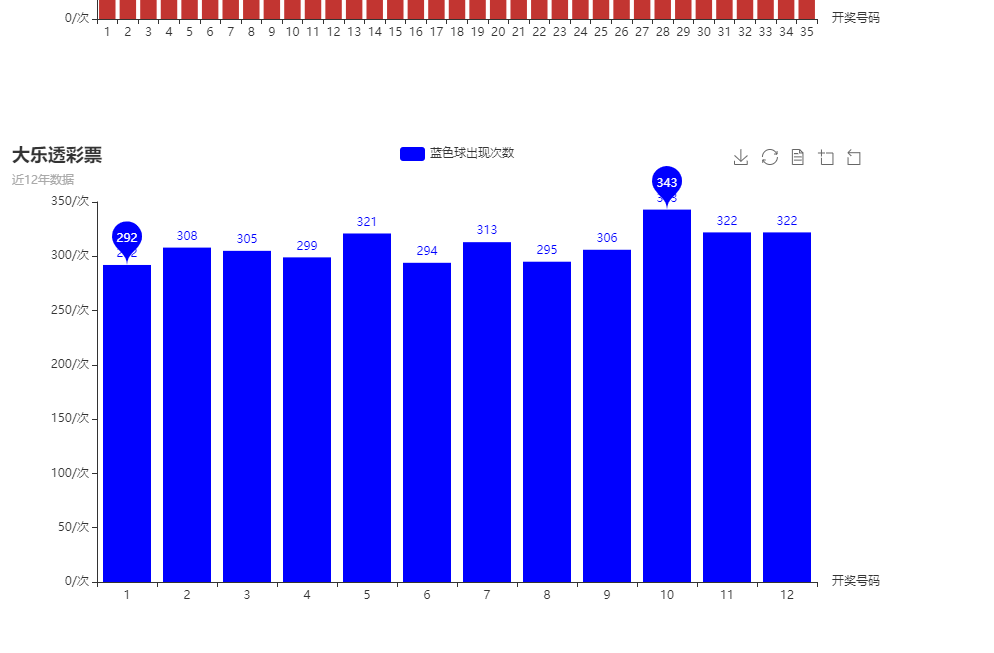
The blue ball appeared 10 times, 343 times, 1 times and 292 times.
Finally, the SVR model of sklearn er module is used to learn the history prize-opening data in depth, and then the training model is used to predict the prize-opening.
Reference to this article on the use of sklearn s: https://blog.csdn.net/lilianforever/article/details/53780613
There are seven numbers in a group of prize numbers, so seven models are established. The prize number of each position is a model. The date and period of each issue are used as eigenvalues, and the number of prize numbers of each position is labeled directly to train the model.
After that, the number of each location is predicted by inputting the next prize opening date and date number for each model, and then the seven numbers are combined to be the final prize opening number.
from sklearn import svm

def forecast():
    data=[]
    period=[]
    first_num=[]
    second_num=[]
    third_num=[]
    fourth_num=[]
    fifth_num=[]
    sixth_num=[]
    seventh_num=[]

    with open('history.txt', 'r') as  f:
        for i in range(1860):
            oneLine_data = f.readline().strip()
            data.append(int(oneLine_data[0:10].replace('-','')))
            period.append(int(oneLine_data[10:15]))
            first_num.append(int(oneLine_data[15:17]))
            second_num.append(int(oneLine_data[17:19]))
            third_num.append(int(oneLine_data[19:21]))
            fourth_num.append(int(oneLine_data[21:23]))
            fifth_num.append(int(oneLine_data[23:25]))
            sixth_num.append(int(oneLine_data[25:27]))
            seventh_num.append(int(oneLine_data[27:29]))
    # print(data)
    # print(period)
    # print(first_num)
    # print(second_num)
    # print(third_num)
    # print(fourth_num)
    # print(fifth_num)
    # print(sixth_num)
    # print(seventh_num)
    x=[]
    for j in range(len(data)):
        x.append([data[j],period[j]])

    first_model=svm.SVR(gamma='auto')
    second_model=svm.SVR(gamma='auto')
    third_model=svm.SVR(gamma='auto')
    fourth_model=svm.SVR(gamma='auto')
    fifth_model=svm.SVR(gamma='auto')
    sixth_model=svm.SVR(gamma='auto')
    seventh_model=svm.SVR(gamma='auto')
    model_list=[first_model,second_model,third_model,fourth_model,fifth_model,sixth_model,seventh_model]
    y_list=[first_num,second_num,third_num,fourth_num,fifth_num,sixth_num,seventh_num]
    for k in range(7):
        model_list[k].fit(x,y_list[k])
    res_list=[]
    for model in model_list:
        res=model.predict([[20190803,19089]]).tolist()
        res_list.append(res)

    print(res_list)
    #res=first_model.predict([[20190729,19087]])
    #print(res)
forecast()
Get the next forecast number:
I haven't learned about in-depth learning, and I don't understand some algorithms and principles for the time being. This is just a little bit of understanding and then choose a model to use directly. If we want to operate more rigorously, we need to cross-validate multiple models, select the best model, and further optimize the model. There will be no tossing (actually not yet).
Last
This prediction of lottery tickets is not reliable, the reason I think everyone knows ~, and the number of lottery openings has no correlation with the number and date of lottery openings. It is meaningless to use the number of lottery openings + the date of lottery openings for in-depth learning and prediction. It should be entertainment while consolidating and practicing relevant python knowledge.
But occasionally it's okay to buy a few lottery tickets for 8 yuan and 10 yuan (don't indulge in it). If one day you step on the dog shit, you may change your destiny. As the saying goes, your dream still needs to be realized.