demand
Source data acquisition – password: 6qpt
- Import the file and view the original data
- Combine population data with state abbreviation data
- Delete the duplicate abstraction column in the merged data
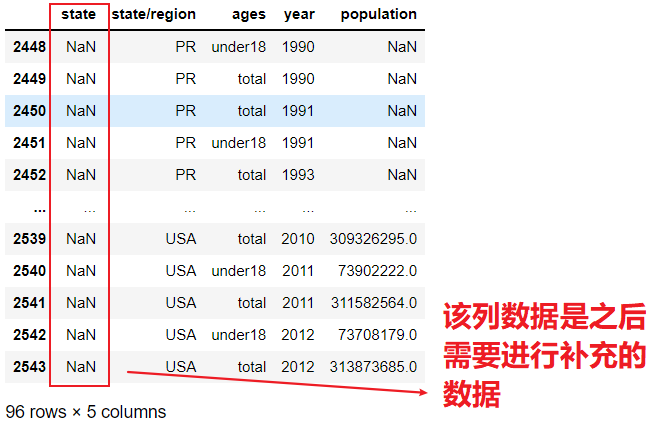
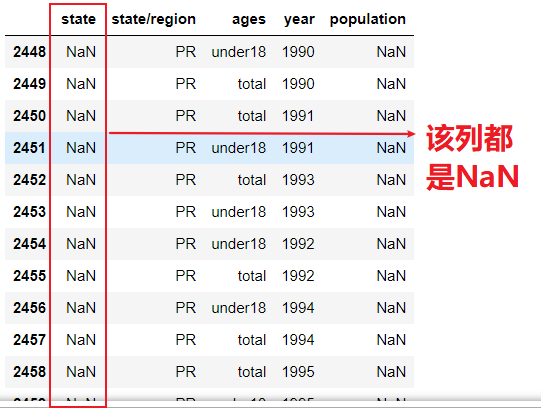
- View columns with missing data
- Find out which states / regions make the value of state NaN and perform the de duplication operation
- Fill in the correct values for the state items of these states / regions found, so as to remove all NaN in the state column
- Merge state area data areas
- We will find the missing data in the area(sq.mi) column and find out which rows
- Remove rows with missing data
- Find the population data for 2010
- Calculate the population density of each state
- Sort and find the five states with the highest population density df.sort_values()
1, Data preprocessing
- Import package
import pandas as pd
import numpy as np
from pandas import DataFrame
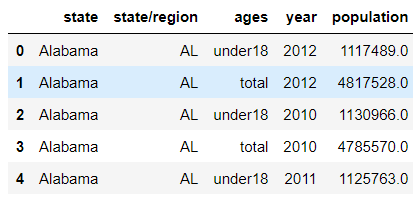
- Import file view original data
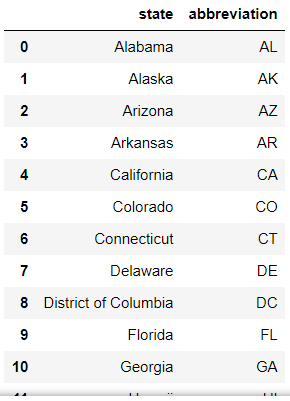
abb = pd.read_csv('./data/state-abbrevs.csv')
abb
# state: full name; abbreviation: abbreviation
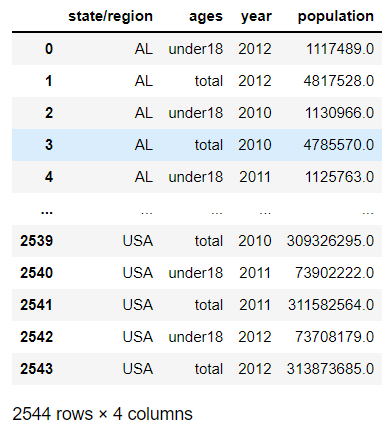
pop = pd.read_csv('./data/state-population.csv')
pop
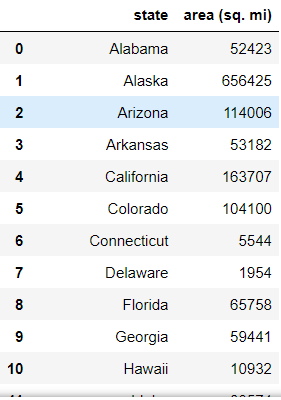
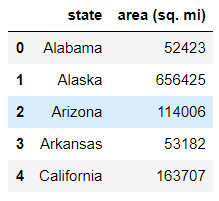
area = pd.read_csv('./data/state-areas.csv')
area
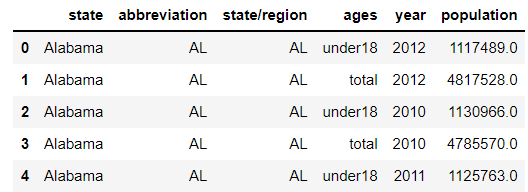
- Combine state data [abb] and population data [pop]
Using outer: ensure data integrity
[Python 3] detailed usage of pandas.merge
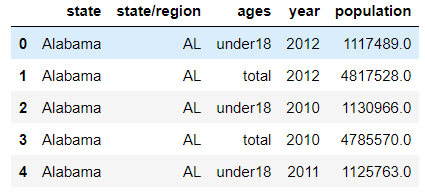
abb_pop = pd.merge(abb,pop,left_on='abbreviation',right_on='state/region',how='outer')
abb_pop.head()
- Delete the merged data column: abstraction
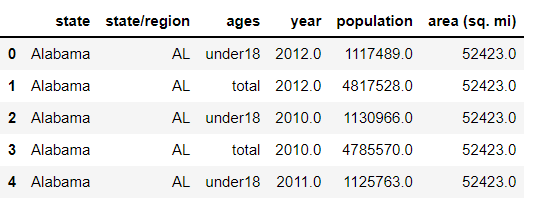
# inplace acts on the original DataFrame
abb_pop.drop(labels='abbreviation',axis=1,inplace=True)
abb_pop.head()
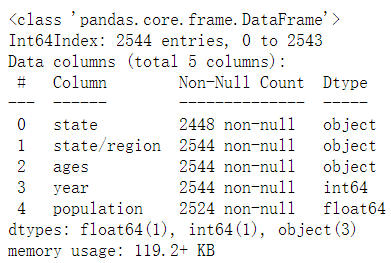
- View missing data in table
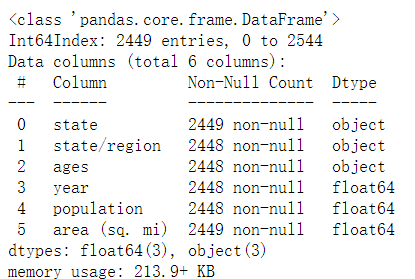
info()
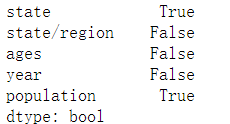
isnull().any(axis=0)⭐
abb_pop.info()
# isnull() and any connections use
abb_pop.isnull().any(axis=0)
2, Data processing
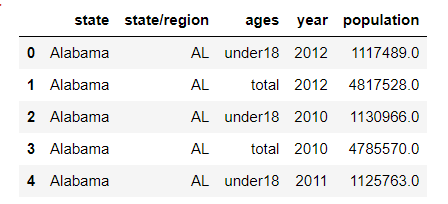
- Find out which states / regions make the state value NaN, and perform the de duplication operation [find the abbreviation corresponding to the empty state value, and perform the de duplication operation on the found abbreviation]
abb_pop.head()
Steps:
- Null value found in state
- Find the abbreviation corresponding to the null value in state
- Weight removal of abbreviation
abb_pop['state'].isnull()
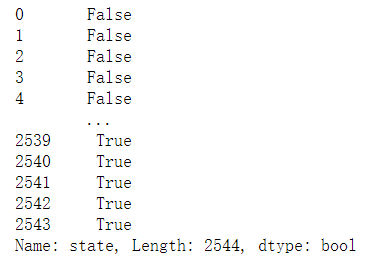
# Take the Boolean value as the index of the data and get the corresponding row data
abb_pop.loc[abb_pop['state'].isnull()]
abb_pop.loc[abb_pop['state'].isnull()]['state/region']
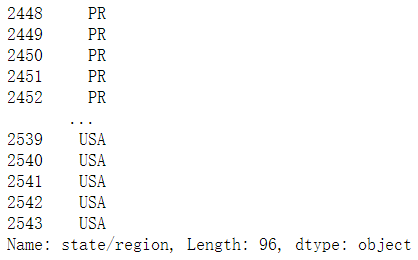
abb_pop.loc[abb_pop['state'].isnull()]['state/region'].unique()
array(['PR', 'USA'], dtype=object)
Fill in the correct values for the state items of these states / regions found, so as to remove all NaN in the state column
- fillna(): fill in consistent – not applicable to this item
-
- PR: fill in the corresponding full name USA: fill in the corresponding full name
realization:
- Find the null value of the full name corresponding to the abbreviation according to the abbreviation
- Fill the found null value with the corresponding full name
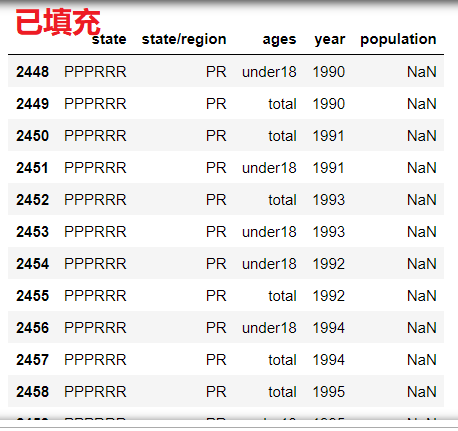
# 1. Find the row corresponding to PR
abb_pop['state/region'] == 'PR'
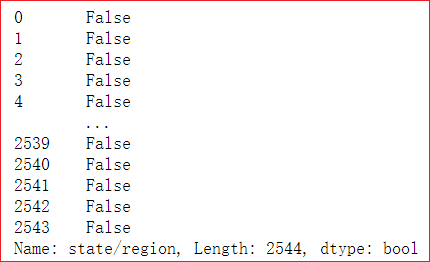
Although the display is False, True is hidden in it!
abb_pop.loc[abb_pop['state/region'] == 'PR']
# 2. Get row index
indexs = abb_pop.loc[abb_pop['state/region'] == 'PR'].index
indexs
Int64Index([2448, 2449, 2450, 2451, 2452, 2453, 2454, 2455, 2456, 2457, 2458,2459, 2460, 2461, 2462, 2463, 2464, 2465, 2466, 2467, 2468, 2469, 2470, 2471, 2472, 2473, 2474, 2475, 2476, 2477, 2478, 2479, 2480,2481, 2482, 2483, 2484, 2485, 2486, 2487, 2488, 2489, 2490, 2491,2492, 2493, 2494, 2495],dtype='int64')
# 3. Batch assignment
abb_pop.loc[indexs,'state'] = 'PPPRRR'
abb_pop.loc[abb_pop['state/region'] == 'PR']
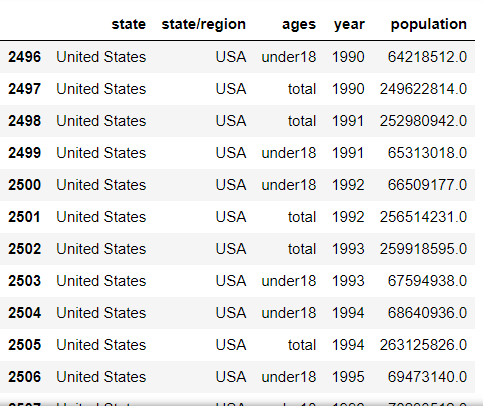
Similarly, the operation referred to as USA is the same
abb_pop['state/region'] == 'USA'
indexsusa = abb_pop.loc[abb_pop['state/region'] == 'USA'].index
abb_pop.loc[indexsusa,'state'] = 'United States'
 abb_pop.loc[abb_pop['state/region'] == 'USA']
- Merge state area data areas
abb_pop.head()
area.head()
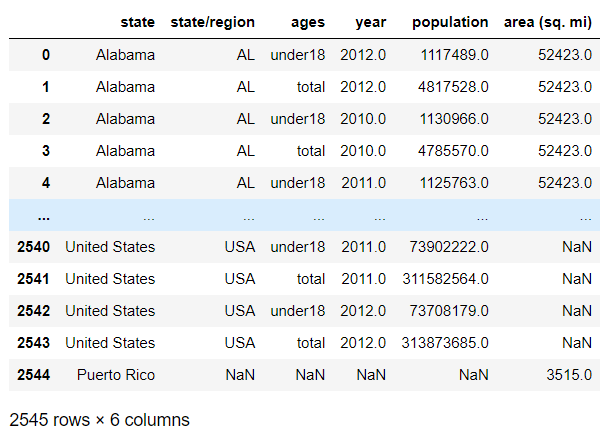
abb_pop_area = pd.merge(abb_pop,area,on='state',how='outer')
abb_pop_area
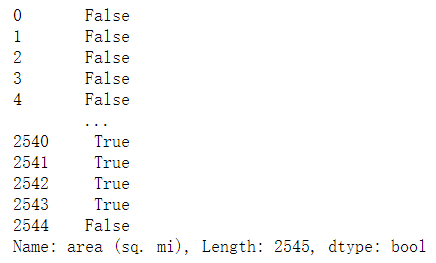
- We will find the missing data in the area(sq.mi) column and find out which rows
abb_pop_area['area (sq. mi)'].isnull()
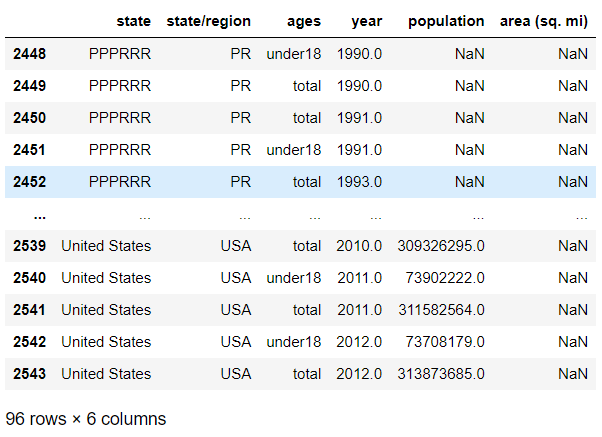
abb_pop_area.loc[abb_pop_area['area (sq. mi)'].isnull()]
# Get index
indexs = abb_pop_area.loc[abb_pop_area['area (sq. mi)'].isnull()].index
indexs
Int64Index([2448, 2449, 2450, 2451, 2452, 2453, 2454, 2455, 2456, 2457, 2458,2459, 2460, 2461, 2462, 2463, 2464, 2465, 2466, 2467, 2468, 2469,2470, 2471, 2472, 2473, 2474, 2475, 2476, 2477, 2478, 2479, 2480,2481, 2482, 2483, 2484, 2485, 2486, 2487, 2488, 2489, 2490, 2491,2492, 2493, 2494, 2495, 2496, 2497, 2498, 2499, 2500, 2501, 2502,2503, 2504, 2505, 2506, 2507, 2508, 2509, 2510, 2511, 2512, 2513,2514, 2515, 2516, 2517, 2518, 2519, 2520, 2521, 2522, 2523, 2524,2525, 2526, 2527, 2528, 2529, 2530, 2531, 2532, 2533, 2534, 2535, 2536, 2537, 2538, 2539, 2540, 2541, 2542, 2543], dtype='int64')
- Remove rows with missing data
# drop series function 0: row 1: column
abb_pop_area.drop(labels=indexs,axis=0,inplace=True)
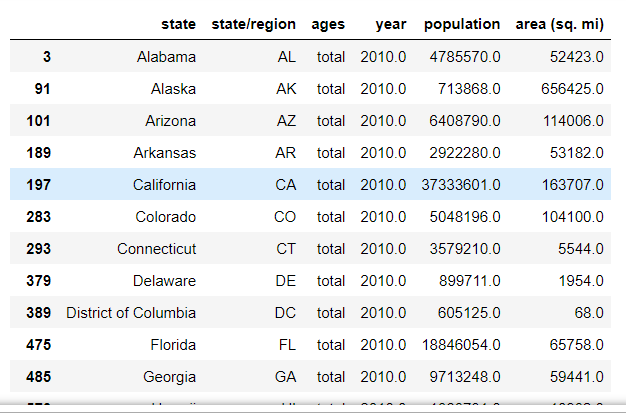
- Find the population data for 2010
query(): condition query ⭐
abb_pop_area.head()
abb_pop_area.info()
abb_pop_area.query('ages == "total" & year == 2010')
- Calculate the population density / area of each state and summarize the population density data to the source data (add a column)
abb_pop_area['population'] / abb_pop_area['area (sq. mi)']
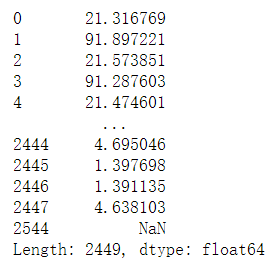
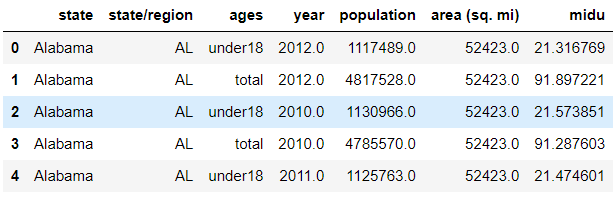
abb_pop_area['midu']  = abb_pop_area['population'] / abb_pop_area['area (sq. mi)']
abb_pop_area.head()
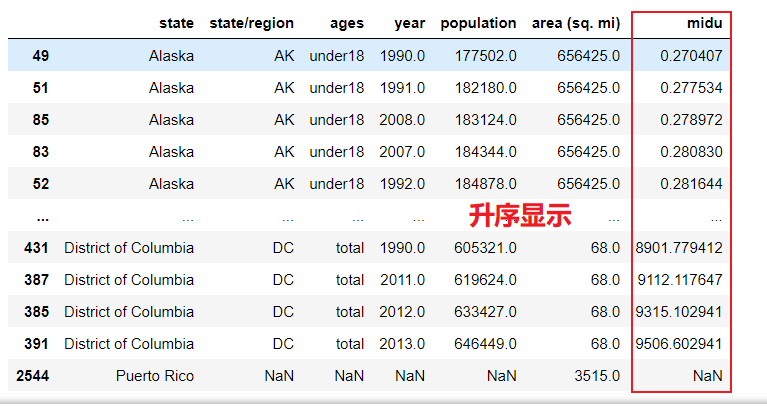
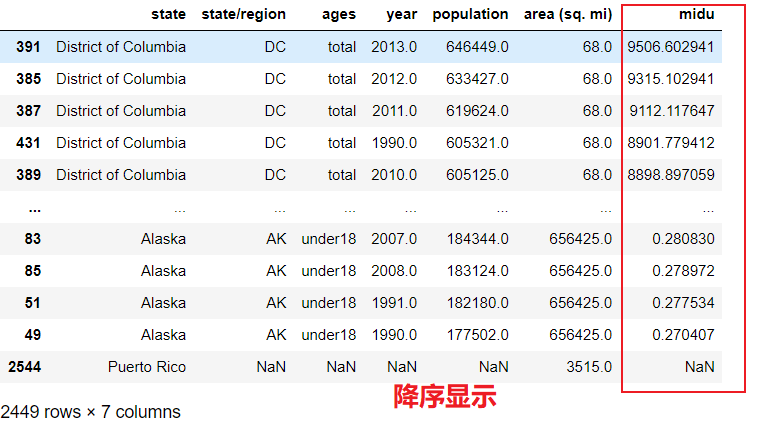
- Sort and find the five states with the highest population density df.sort_values()
abb_pop_area.sort_values(by='midu')
abb_pop_area.sort_values(by='midu',axis=0,ascending=False)
summary
- On the index of iloc and loc
- loc: display index
- iloc: hidden world index
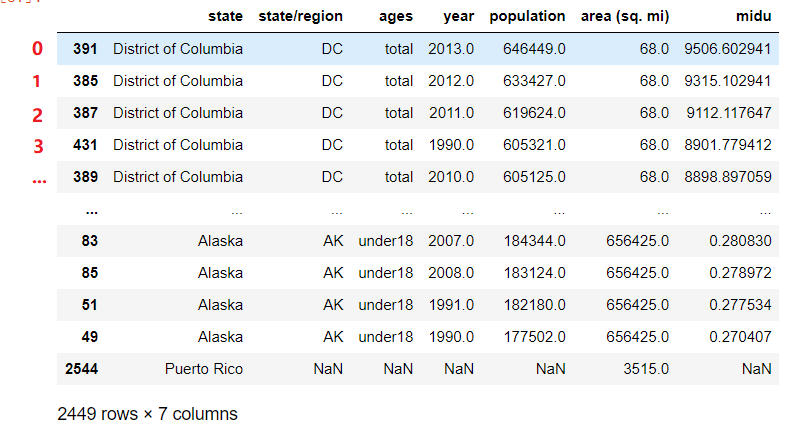
abb_pop_area.sort_values(by='midu',axis=0,ascending=False).iloc[0]['state']
'District of Columbia'
abb_pop_area.sort_values(by='midu',axis=0,ascending=False).loc[51]['state']
'Alaska'