Ring chart effect:
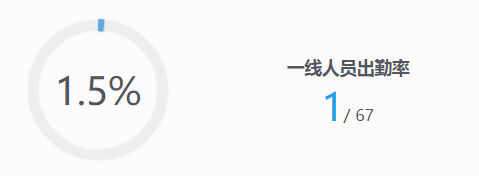
The left statistical chart data is bound to the attendance rate of the right personnel. When the attendance rate of several personnel changes, the statistical chart is updated.
Introduce js and set css:
<script src="scripts/jquery/jquery.circliful.min.js"></script>
/*Ring chart style start*/
.circliful {
    position: relative;
}

.circle-text, .circle-info, .circle-text-half, .circle-info-half {
    width: 100%;
    position: absolute;
    text-align: center;
    display: inline-block;
}

.circle-info, .circle-info-half {
    color: #999;
}

.circliful .fa {
    margin: -10px 3px 0 3px;
    position: relative;
    bottom: 4px;
}
/*Ring chart style end*/
HTML:
<div class="row">
            <!--Pie chart start-->
            <div class="col-md-6 chart-content" style="height:130px;width:130px;">
                <div id="circleStat" data-dimension="130" data-text="0%" data-info="" data-width="10" data-fontsize="30" data-percent="0" data-fgcolor="#61a9dc" data-bgcolor="#eee"></div>
            </div>
            <!--Pie chart end-->
            <!--Front line attendance start-->
            <div class="col-md-6 chart-title pull-right">
                <h4>Front line attendance</h4>
                <p><span id="onlines" class="text-primary" style="font-size: 30px;">0</span>/
                    <span id="totalUser" class="allnumber">0</span></p>
            </div>
            <!--Front line attendance  end-->
        </div>
initialization:
//Load ring chart
      $(document).ready(function () {
        $('#circleStat').circliful();
      });
Binding data:
//Ring chart percentage
      var persent = Math.round(results.total / results.totalUser * 1000) / 10;//percentage
      persent = isNaN(persent) ? 0 : persent;//When the number of online people is 0, you need to set persent to 0 to displayvar statId = $('#circleStat').attr('id');//Get the id of the chart element
      var statHtml = '<div id="' + statId + '" data-dimension="130" data-text="' + persent + '%' + '" data-info=""' +
        'data-width="10" data-fontsize="30" data-percent="' + persent + '" data-fgcolor="#61a9dc"' +
        'data-bgcolor="#eee"></div>';//New chart element
      $('.chart-content').html(statHtml);//Replace chart elements
      $('#' + statId).circliful();//Load statistics
      // $('#circleStat').attr("data-text", persent + "%");
      // $('#circleStat').attr("data-percent", persent);
      // $('.circle-text').html(persent + "%");
results.total and results.totalUser are the number of people online and the total number of people respectively.
Note: it was originally assigned directly to the data text and data percent attributes of the element to change the number and figure proportion in the middle of the ring statistical chart. However, the graph will not refresh automatically, so after setting parameters, you can directly replace the real div, and then load the ring chart.