brief introduction
pinpoint is an open source APM monitoring tool on github. It is written in Java for large-scale distributed system monitoring. It has the smallest impact on performance (only about 3% increase in resource utilization), and the installation agent is non-intrusive.
Major APM tools are almost based on this classic apper paper by google, so you must read it. Here is its source address: https://research.google.com/p... Thank you for your translation. http://bigbully.github.io/Dap...
pinpoint provides some functionality:
- Service mapping: Visualize how its components interconnect to understand the relationships of any distributed system. Clicking on a node displays detailed information about the component, such as its current state and transaction count.
- Number of active threads in real time
- Request/response scatterplot
- Call stack
- See other details about the application, such as CPU utilization, memory/garbage collection, TPS and JVM parameters
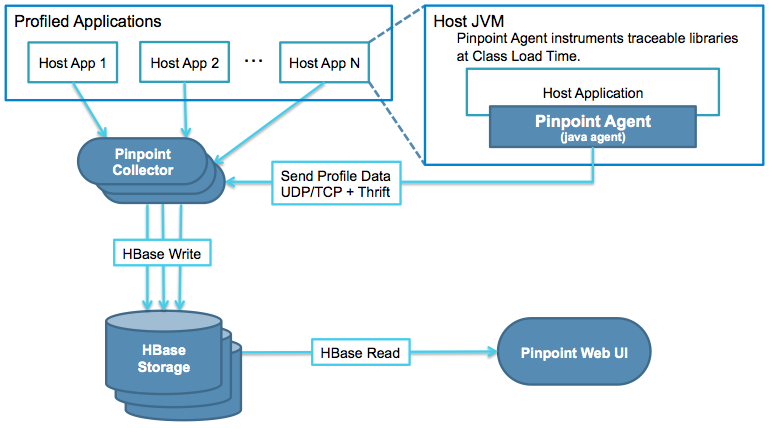
The whole pinpoint architecture is divided into three parts: pinpoint-collector, pinpoint-agent and pinpoint-webUI.
pinpoint-agent: Used to collect information about a single application and send the collected application information to pinpoint-collector
pinpoint-collector: Used to process information sent by pinpoint-agent and store it in HBase
pinpoint-webUI: Find out the data in HBase and display it
So I need to prepare two machines here:
10.200.201.xxx: Used to install pinpoint-collector, pinpoint-webUI, HBase
10.200.201.yyy y: Used to install pinpoint-agent, responsible for collecting application information
Environmental installation
Install jdk
I'm using RPM packages installed directly: rpm-ivh jdk-8u171-linux-x64.rpm
After installation, configure JAVA_HOME:
Use vim to configure environment variables:
vim /etc/profile
export JAVA_HOME=/usr/java/jdk1.8.0_45
export CLASSPATH=.:$JAVA_HOME/lib/dt.jar:$JAVA_HOME/lib/tools.jar
export PATH=$PATH:$JAVA_HOME/bin
Then load some profile files:
source /etc/profile
Install HBase
Here is a comparison chart:
From the above we can see that we need to install version 1.2.x for HBase.
Download address:
http://archive.apache.org/dis...
I downloaded version 1.2.12 here.
- Put Hbse in the specified directory
cd /app/install
tar -zxvf hbase-1.2.12-bin.tar.gz
- Modify configuration information
Modify hbase-env.sh
vim /app/install/hbase-1.2.12/conf/hbase-env.sh

#Add JAVA_HOME
export JAVA_HOME=/usr/java/jdk1.8.0_45
Modify hbase-site.xml
vim /app/install/hbase-1.2.12/conf/hbase-site.xml

<configuration>
        <property>
            <name>hbase.rootdir</name>
            <value>file:///app/data/hbase</value>
        </property>
        <property>
            <name>hbase.zookeeper.property.dataDir</name>
            <value>/app/data/zookeeper</value>
        </property>
        <property>
         <name>hbase.zookeeper.property.clientPort</name>
         <value>2181</value>
         <description>Property from ZooKeeper'sconfig zoo.cfg. The port at which the clients will connect.
         </description>
        </property>
        <!-- false It's a stand-alone mode. true It's a distributed model.  -->
        <property>
         <name>hbase.cluster.distributed</name>
         <value>false</value>
        </property>
</configuration>
- Start HBase
cd /app/install/hbase-1.2.12/bin
./start-hbase.sh

# Check if Hbase started successfully, and if it started successfully, you'll see the "HMaster" process
[root@localhost bin]# jps
12075 Jps
11784 HMaster
- Initialize the pinpoint Library
Download the script: https://github.com/naver/pinp...
#Enter into the bin directory of hbase
cd /app/install/hbase-1.2.12/bin
#Execution script
./bin/hbase shell /app/install/pinpoint/hbase/scripts/hbase-create.hbase

# After execution, enter Hbase
./hbase shell

#After entering, you can see the version of Hbase and some related information.
2019-10-12 16:18:28,074 WARN  [main] util.NativeCodeLoader: Unable to load native-hadoop library for your platform... using builtin-java classes where applicable
HBase Shell; enter 'help<RETURN>' for list of supported commands.
Type "exit<RETURN>" to leave the HBase Shell
Version 1.2.12, r91d5ec4c4dcd10ceec984c6e663ea82acf353995, Sat Apr  6 15:27:28 CDT 2019

# Enter status'detailed'to see if the table you just initialized exists
hbase(main):002:0> status 'detailed'
You can also log on to the web to see if the data of HBase has been initialized successfully.
http://10.200.201.xxx:16010/master-status
Install pinpoint-collector
Make a tomcat container with port number 8081
#Drop the pinpoint-collector's war package into Tomcat's webapps directory
cp pinpoint-collector-1.8.5.war ../apache-tomcat-8081/webapps/

#Change the name of the war package
mv pinpoint-web-1.8.5.war pp-collector.war

#Start tomcat
./bin/startup.sh

# Check the log to see if it started successfully
tail -f ../logs/catalina.out

#If hbase is installed on another machine, you need to modify the configuration
cd /app/install/apache-tomcat-8081
vim webapps/pp-collector/WEB-INF/classes/hbase.properties
#Modify the port numbers corresponding to hbase's ip and HBase
hbase.client.host=10.200.201.xxx
hbase.client.port=2181
Install pinpoint-web
Unzip a tomcat container with port number 8080
#Place pinpoint-web in tomcat's webapps container
cp pinpoint-web-1.8.5.war  ../apache-tomcat-8080/webapps/

#Modify the war package name
mv pinpoint-web-1.8.5.war pp-web.war

#Start tomcat
./bin/startup.sh

# Check the log to see if it starts successfully
tail -f ../logs/catalina.out

#If hbase is installed on another machine, you need to modify the configuration
cd /app/install/apache-tomcat-8080
vim webapps/pp-web/WEB-INF/classes/hbase.properties

#Modify the port numbers corresponding to hbase's ip and HBase
hbase.client.host=10.200.201.xxx
hbase.client.port=2181
Then in the browser: http://10.200.201.xxx:8080/pp-web/

Deploying pinpoint-agent to collect monitoring data
- Input pinpoint-agent package
First, pinpoint-agent-1.8.5.tar.gz is passed into / app/install/pinpoint-agent/of server 10.200.201.yyy.
Then perform tar-zxvf pinpoint-agent-1.8.5.tar.gz decompression
- Configuring pp-agent collector
cd /app/install/pinpoint-agent
vim pinpoint.config

# Mainly modify IP, just specify the IP to install pp-col. After installing pp-col, the ports of 9994, 9995 and 9996 are opened automatically. There is no need to worry about this. If you have port requirements, go to the pp-col configuration file ("pp-collector/webapps/ROOT/WEB-INF/classes/pinpoint-collector.properties") and modify these ports.
profiler.collector.ip=10.200.201.xxx
- If tomcat is monitored
# Modify the Tomcat startup file "catalina.sh" under the test project. Modify this as long as Tomcat is used to monitor the test environment and add probes.
vi catalina.sh

# The first line is the jar package location of the pp-agent
# The second line is the ID of the agent. This ID is unique. I named it with pp + today's date, as long as it doesn't duplicate the ID of other projects.
# The third line is the name of the collection project, which can be picked up at will, as long as the items do not repeat.
CATALINA_OPTS="$CATALINA_OPTS -javaagent:$AGENT_PATH/pinpoint-bootstrap-$VERSION.jar"
CATALINA_OPTS="$CATALINA_OPTS -Dpinpoint.agentId=$AGENT_ID"
CATALINA_OPTS="$CATALINA_OPTS -Dpinpoint.applicationName=$APPLICATION_NAME"

# Configured. Now that we can start monitoring, let's start Tomcat's server for testing.
cd /data/pp-test/bin/
./startup.sh

# Check the startup log to see that Tomcat actually started
tail -f ../logs/catalina.out
- springboot package deployment
If it is a jar package deployment, add startup parameters directly to the startup command:
nohup java -javaagent:/app/install/pinpoint-agent/pinpoint-bootstrap-1.8.5.jar -Dpinpoint.agentId=$AGENT_ID -Dpinpoint.applicationName=$APPLICATION_NAME
Function settings
Set up monitoring
If you install it according to the above method, you will make an error when you make monitoring settings or user settings:
So you need to configure mysql:
First you need to run two sql scripts:
https://github.com/naver/pinp...
https://github.com/naver/pinp...
Then go into the container of tomcat where the war of pinpoint-web is located and modify the configuration file: WEB-INF/classes/jdbc.properties.
Concurrent mysql Account Password
jdbc.url=jdbc:mysql://localhost:13306/pinpoint?characterEncoding=UTF-8
jdbc.username=admin
jdbc.password=admin
We can set different alert rules for different applications in the application. The specific alert rules are as follows:
SLOW COUNT: Triggered when the number of slow requests sent to the application exceeds the configured threshold

SLOW RATE
   Triggered when the percentage of slow requests sent to the application (%) exceeds the configured threshold

ERROR COUNT
   Triggered when the number of failed requests sent to the application exceeds the configured threshold.

ERROR RATE
   Triggered when the percentage of failed requests sent to the application (%) exceeds the configuration threshold.

TOTAL COUNT
   Triggered when all requests sent to the application exceed the configured threshold.

SLOW COUNT TO CALLEE
   Triggered when the number of slow requests sent by the application exceeds the configured threshold. You must specify a domain or address (IP, port) in the Notes... Box of the configuration UI.
     For example, www.naver.com, 127.0.0.1:8080

SLOW RATE TO CALLEE
   Triggered when the percentage of slow requests sent by the application (%) exceeds the configured threshold. You must specify the domain or address (IP, port) in the "comment..." box of the configuration UI.
   ex) www.naver.com, 127.0.0.1:8080

ERROR COUNT TO CALLEE
   Triggered when the number of failed requests sent by the application exceeds the configured threshold. You must specify a domain or address (IP, port) in the Notes... Box of the configuration UI.
   ex) www.naver.com, 127.0.0.1:8080

ERROR RATE TO CALLEE
   Triggered when the percentage of failed requests sent by the application (%) exceeds the configured threshold. You must specify a domain or address (IP, port) in the Notes... Box of the configuration UI.
   ex) www.naver.com, 127.0.0.1:8080

TOTAL COUNT TO CALLEE
   Triggered when all requests sent by the application exceed the configured threshold. You must specify a domain or address (IP, port) in the Notes... Box of the configuration UI.
   ex) www.naver.com, 127.0.0.1:8080

HEAP USAGE RATE
   Triggered when the heap utilization (%) of the application exceeds the configuration threshold.

JVM CPU USAGE RATE
   Triggered when the application's CPU utilization (%) exceeds the configured threshold.

SYSTEM CPU USAGE RATE
   Alerts are sent when the CPU utilization (%) of the application exceeds the configured threshold.

DATASOURCE CONNECTION USAGE RATE
   Triggered when the application's data source connection utilization (%) exceeds the configuration threshold.

FILE DESCRIPTOR COUNT
   Send an alert when the number of open file descriptors exceeds the configuration threshold.
Then you need to configure the information of the mail server in webapps/pp-web/WEB-INF/classes/batch.properties:
pinpoint.url= #pinpoint-web server url
alarm.mail.server.url= #smtp server address
alarm.mail.server.port= #smtp server port
alarm.mail.server.username= #username for smtp server authentication
alarm.mail.server.password= #password for smtp server authentication
alarm.mail.sender.address= #sender's email address

#for example
pinpoint.url=http://pinpoint.com
alarm.mail.server.url=stmp.server.com
alarm.mail.server.port=583
alarm.mail.server.username=pinpoint
alarm.mail.server.password=pinpoint
alarm.mail.sender.address=pinpoint_operator@pinpoint.com