Reference link
https://www.cnblogs.com/ryanzheng/p/10575790.html
Five years of intermittent php, debug is only on the development machine in the early stage, never debug in the mid-term. What's wrong with var_dump? Now we have a problem with fpdf, but we have to debug server.
I just recorded the problems I encountered, basically in accordance with the original ideas.
Environmental Introduction:
Local: win7 + vscode
Remote: CentOS + Apache + PHP 5.6 + Xdebug
The running environment of PHP is in the remote server, the project code is localized and mapped to the virtual machine using nfs sharing.
1.ssh to the virtual machine, check and install php's xdebug extension
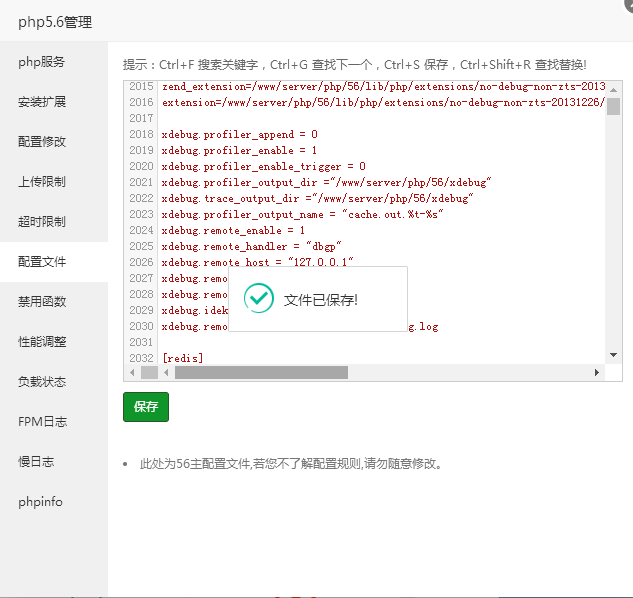
2. Configure xdebug in php.ini
zend_extension=xdebug.so
[XDebug]
xdebug.remote_enable = on
xdebug.remote_autostart = 1
;xdebug.remote_host = 192.168.10.1
xdebug.remote_port = 9000
xdebug.remote_connect_back = 1
xdebug.auto_trace = 1
xdebug.collect_includes = 1
xdebug.collect_params = 1
xdebug.remote_log = /tmp/xdebug.log
"remote_enable" allows remote debugging
remote_autostart remote debugging autostart?
"remote_host" is the IP that specifies which IP to debug remotely, which is where your IDE is located (192.168.10.1 is my local, but when remote_connect_back is set below, this IP setting is invalid, so I commented).
"remote_port" is a listening port set up in vscode and a local port. When debugging begins, xdebug will communicate with this port.
"remote_connect_back" doesn't know what it means, but if this is turned on, the settings of xdebug.remote_host above will be ignored.
Other xdebug configuration instructions can be self-searched.
Because I'm using a pagoda here, all the phpinfo is played directly.
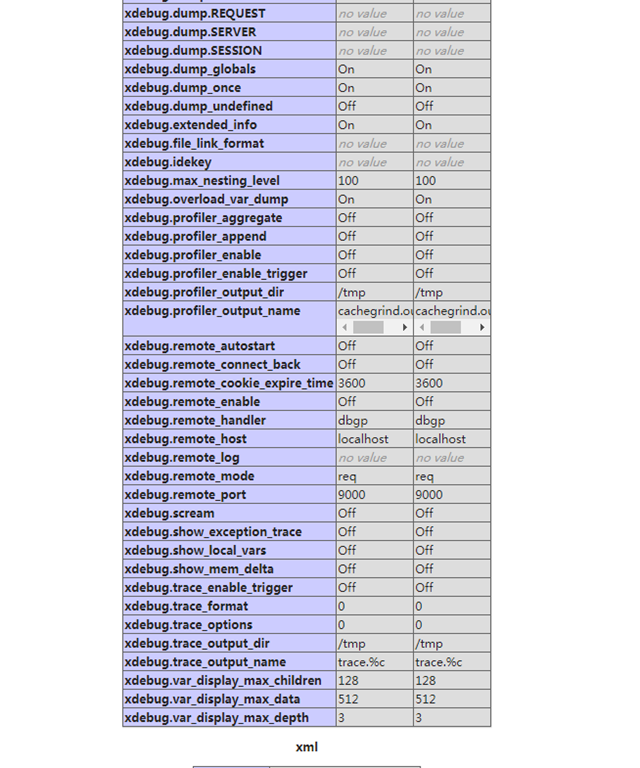
Several of them did not meet the requirements, so I put all the configuration in the reference link into it.
3. Restart php-fpm, or web environment
4. Install Plug-in "PHP Debug" in vscode
5. Configure launch.json
{
    "name": "Listen for XDebug",
    "type": "php",
    "request": "launch",
    "stopOnEntry":false,
    "localSourceRoot": "Z://php_project/",
    "serverSourceRoot": "/home/ryan/php_project/",
    "port": 9000
},
{
    "name": "Launch currently open script",
    "type": "php",
    "request": "launch",
    "program": "${file}",
    "cwd": "${fileDirname}",
    "port": 9000
}
Above, where "localSourceRoot" is the local path of the project code, setting the value of the current workspace root directory, that is, my project root directory.
” SerrSourceRoot is the code path in the remote virtual machine, and port is the port that the local IDE will listen on when debug, which is used when remote xdebug communicates with vscode.
After the above settings are completed, breakpoint debugging can begin!!!
And then I tried, there is no egg, there must be something wrong with the configuration, so all right, one by one, debug locally, because it was never in vscode before, but debug in phpstrom.
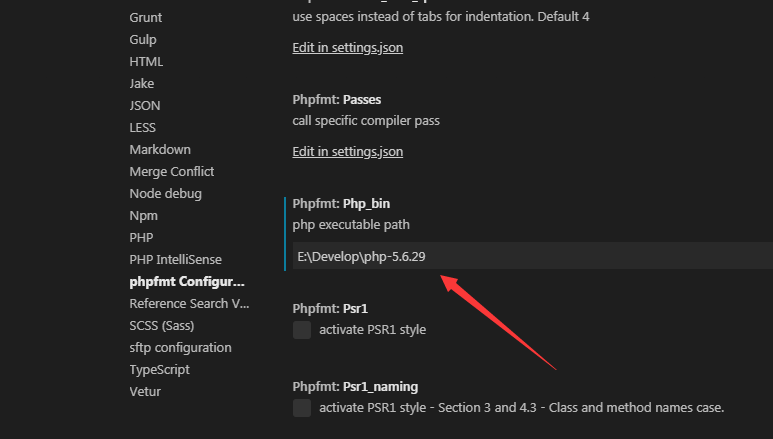
zend_extension              = "E:\Develop\php-5.6.29\ext\php_xdebug-2.5.0-5.6-vc11-x86_64.dll"
;Allow remote IDE debugging
xdebug.remote_enable        = true
;Remote Host
xdebug.remote_host          = 127.0.0.1
;xdebug.remote_port         = 9000 ;Default port 9000
xdebug.profiler_enable      = on
;Temporary Tracking Information Output
xdebug.trace_output_dir     = "E:\Develop\ApacheServer\xdebug\trace"
xdebug.profiler_output_dir  = "E:\Develop\ApacheServer\xdebug\profiler"
;Other parameters
;Turn on automatic tracking. Automatic Opening"Monitoring function call process"The mode of work. This function can output the monitoring information of function calls in the form of files in the directory you specify.
xdebug.auto_trace           = On
;Turn on exception tracking
xdebug.show_exception_trace = On
;Open remote debugging auto-start
xdebug.remote_autostart     = On
;Collect variables
xdebug.collect_vars         = On
;Collect return values
xdebug.collect_return       = On
;Collect parameters
xdebug.collect_params       = On
;Display local variables
xdebug.show_local_vars      = On
;Display default error messages
xdebug.default_enable       = On
;Be used for zend studio Application Layer Communication Protocol for Remote Debugging
xdebug.remote_handler       = dbgp
;If set too small,If there are too many recursive calls in a function, the maximum number of nested errors will be reported.
xdebug.max_nesting_level    = 10000
xdebug.idekey = PHPSTORM
The blogger, vscode, was not familiar with the launch.json configuration file, and accidentally found that the launch.json configuration file was global.

So finally we can debug locally. The interface of debug is beautiful and super concise.

As a result, I solved the problem in local debug, but remote debug still can't. Keep this post for the next time. Don't scold me.