I got a Nginx service monitor the other day, and I'll try php service monitor again today.
Operating System: CentOS 7.2
PHP Version: 5.6.30
zabbix version: 2.2.5
We found that php-fpm, like Nginx, has its own status page that can be viewed, so we can open it in the configuration file.
First check if your php profile has enabled status page viewing
# cat  /data0/php/etc/php-fpm.conf | grep status_path
;pm.status_path = /status
If that's the same, it's not open yet, so we'll modify the configuration to support viewing php-fpm status.
# vim  /data0/php/etc/php-fpm.conf
pm.status_path = /status   ---Remove;Number Note
Save out
Restart the php-fpm service to enable the view status function to take effect
# pkill -9 php-fpm
# /data0/php/sbin/php-fpm
Add settings to the Nginx configuration that support getting PHP status
# vim  /data0/nginx/conf/nginx.conf
##Add it in the server module
server {
    listen 80;
     server_name  www.sss.com;
     #20170701 php-fpm status for zabbix to fetch data
      location ~ ^/(status|ping)$ {
          include fastcgi_params;
          fastcgi_pass   172.17.0.2:9000;
          fastcgi_param  SCRIPT_FILENAME  $document_root$fastcgi_script_name;
          }
     #20170701 php-fpm status for zabbix to fetch data end
}
Note: Because my PHP runs in docker, the fatstcgi_pass above depends on your own situation.
Set up, save the exit, restart the Nginx service, let the settings take effect
# /data0/nginx/sbin/nginx -t
nginx: the configuration file /data0/nginx/conf/nginx.conf syntax is ok
nginx: configuration file /data0/nginx/conf/nginx.conf test is successful
# /data0/nginx/sbin/nginx -s reload
Now that PHP and Nginx are ready, you can start to see the results.
View your status page
There are two ways:
1. Visit locally
# curl http://www.sss.com/status
pool:                 www
process manager:      dynamic
start time:           30/Jun/2017:14:14:02 +0800
start since:          94540
accepted conn:        75834
listen queue:         0
max listen queue:     2
listen queue len:     128
idle processes:       99
active processes:     1
total processes:      100
max active processes: 9
max children reached: 0
slow requests:        122
2. Open Browser Access
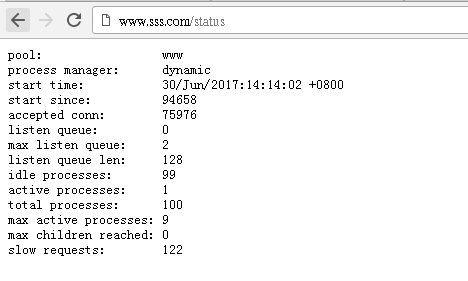
Content Interpretation:
Pool: www -- php-fpm pool name
 Process manager: dynamic -- process management approach
 Start time: 30/Jun/2017:14:14:02+0800 -- Start date, once you update the php-fpm service, it will also be updated
 Start Since: 94540 -- How long it takes to run up to now
 Accepted conn: 75834 -- Number of requests accepted by the current pool
 Listen queue: 0 -- The number of waiting queues for requests, if this value is greater than 0, will increase the number of php-fpm processes
 Max listen queue: 2 -- Maximum number of request waiting queues
 Listen queue len: 128 -- socket waiting queue length
 Idle processes: 99 -- Number of idle processes
 Active processes: 1 -- Number of active processes
 Total processes: 100 -- Total number of processes
 max active processes: 9 -- Maximum number of active processes
 max children reached: 0 - The maximum number of times a highway process is limited, and if this value is not zero, the maximum ongoing process needs to be expanded to meet the demand.
Slow requests: 122 -- Number of slow requests
The php-fpm status page is very friendly. When cooperating with zabbix monitoring, you don't need to write shell scripts to get data. It's good, and you can be lazy!
Believe it or not, try the following on your monitored host (PHP-fpm host)
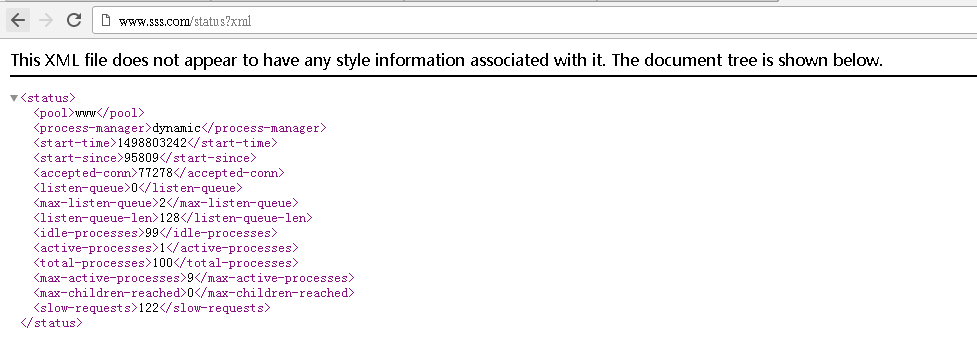
1. Add at the end of the access URL? xml
curl http://www.sss.com/status?xml
<?xml version="1.0" ?>
<status>
<pool>www</pool>
<process-manager>dynamic</process-manager>
<start-time>1498803242</start-time>
<start-since>95730</start-since>
<accepted-conn>77180</accepted-conn>
<listen-queue>0</listen-queue>
<max-listen-queue>2</max-listen-queue>
<listen-queue-len>128</listen-queue-len>
<idle-processes>99</idle-processes>
<active-processes>1</active-processes>
<total-processes>100</total-processes>
<max-active-processes>9</max-active-processes>
<max-children-reached>0</max-children-reached>
<slow-requests>122</slow-requests>
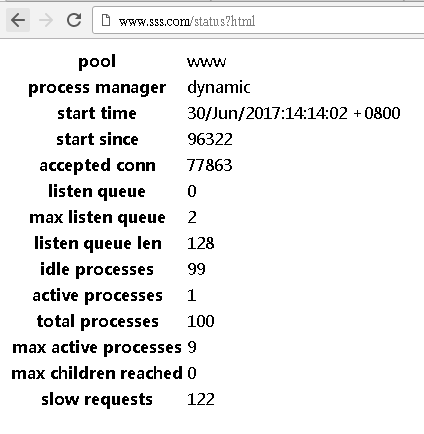
2. Add at the end of the access URL? html
curl http:/www.sss.com/devopsfjjerpstatus?html
<!DOCTYPE html PUBLIC "-//W3C//DTD XHTML 1.0 Strict//EN" "http://www.w3.org/TR/xhtml1/DTD/xhtml1-strict.dtd">
<html xmlns="http://www.w3.org/1999/xhtml" xml:lang="en" lang="en">
<head><title>PHP-FPM Status Page</title></head>
<body>
<table>
<tr><th>pool</th><td>www</td></tr>
<tr><th>process manager</th><td>dynamic</td></tr>
<tr><th>start time</th><td>30/Jun/2017:14:14:02 +0800</td></tr>
<tr><th>start since</th><td>95954</td></tr>
<tr><th>accepted conn</th><td>77437</td></tr>
<tr><th>listen queue</th><td>0</td></tr>
<tr><th>max listen queue</th><td>2</td></tr>
<tr><th>listen queue len</th><td>128</td></tr>
<tr><th>idle processes</th><td>99</td></tr>
<tr><th>active processes</th><td>1</td></tr>
<tr><th>total processes</th><td>100</td></tr>
<tr><th>max active processes</th><td>9</td></tr>
<tr><th>max children reached</th><td>0</td></tr>
<tr><th>slow requests</th><td>122</td></tr>
</table>
</body></html>
3. Add at the end of the access URL? json
# curl http://www.sss.com/status?json
{"pool":"www","process manager":"dynamic","start time":1498803242,"start since":96133,"accepted conn":77639,"listen queue":0,"max listen queue":2,"listen queue len":128,"idle processes":99,"active processes":1,"total processes":100,"max active processes":9,"max children reached":0,"slow requests":122}
Add custom parameter s to the configuration of zabbix agent of monitored machine
vim  /data0/zabbix/etc/zabbix_agentd.conf
##monitoring for php-fpm status
UserParameter=php-fpm.status[*],/usr/bin/curl -s "http://www.sss.com/devopsfjjerpstatus?xml" | grep "<$1>"| awk -F '>|<' '{ print $$3}'
In order for the modified configuration to take effect, we need to restart the zabbix_agent service
# pkill -9 zabbix_agentd
# /data0/zabbix/sbin/zabbix_agentd
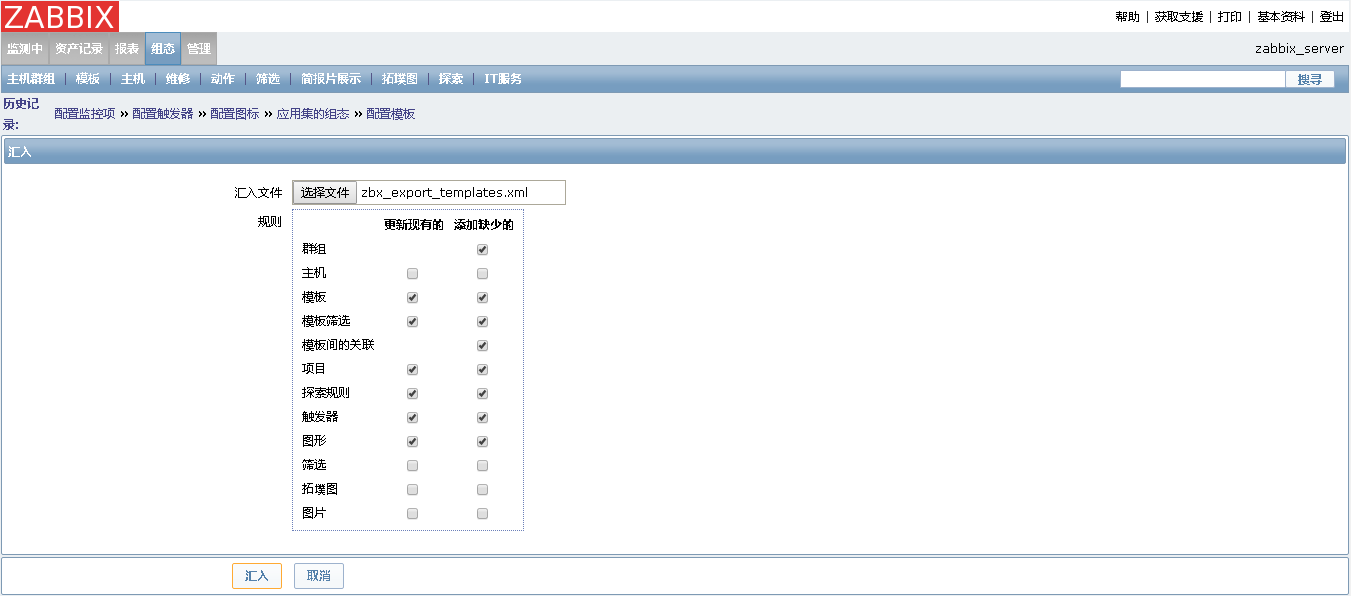
At present, the settings on the monitored machine are basically over. Now we are going to switch to zabbix server, just as before, as long as we import PHP-fpm monitoring template into the zabbix web management interface.
Note: Friends in need can download my zabbix php-fpm monitoring template at the end of this article

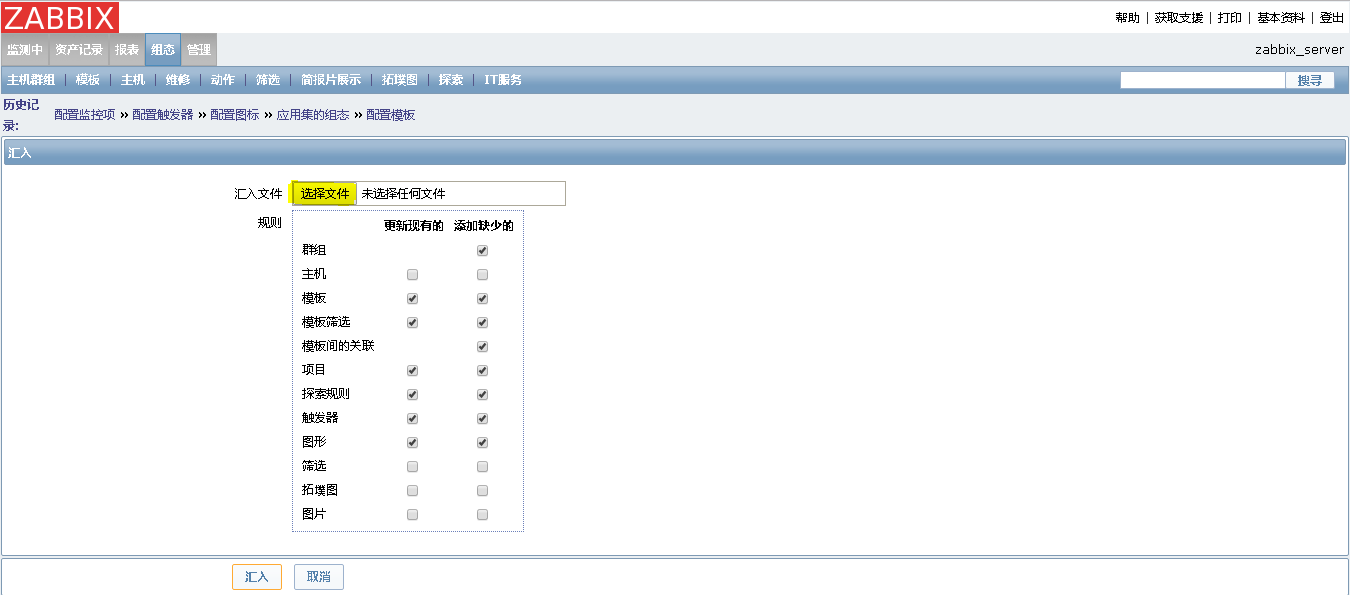
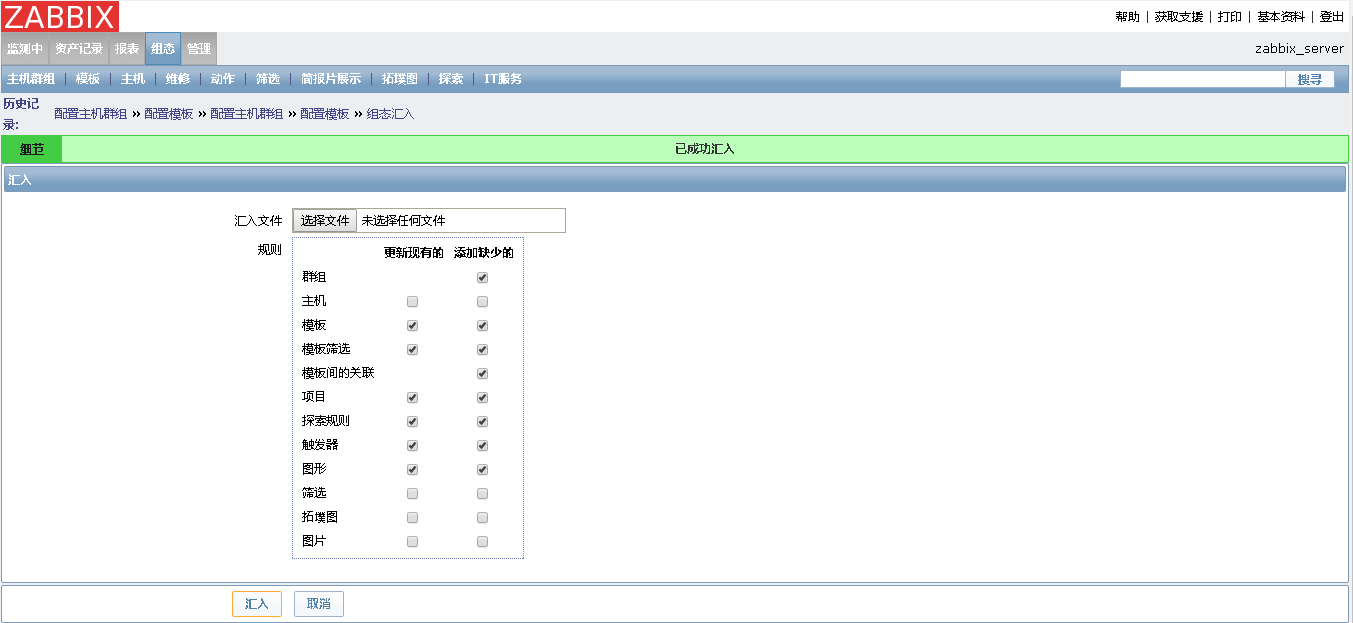
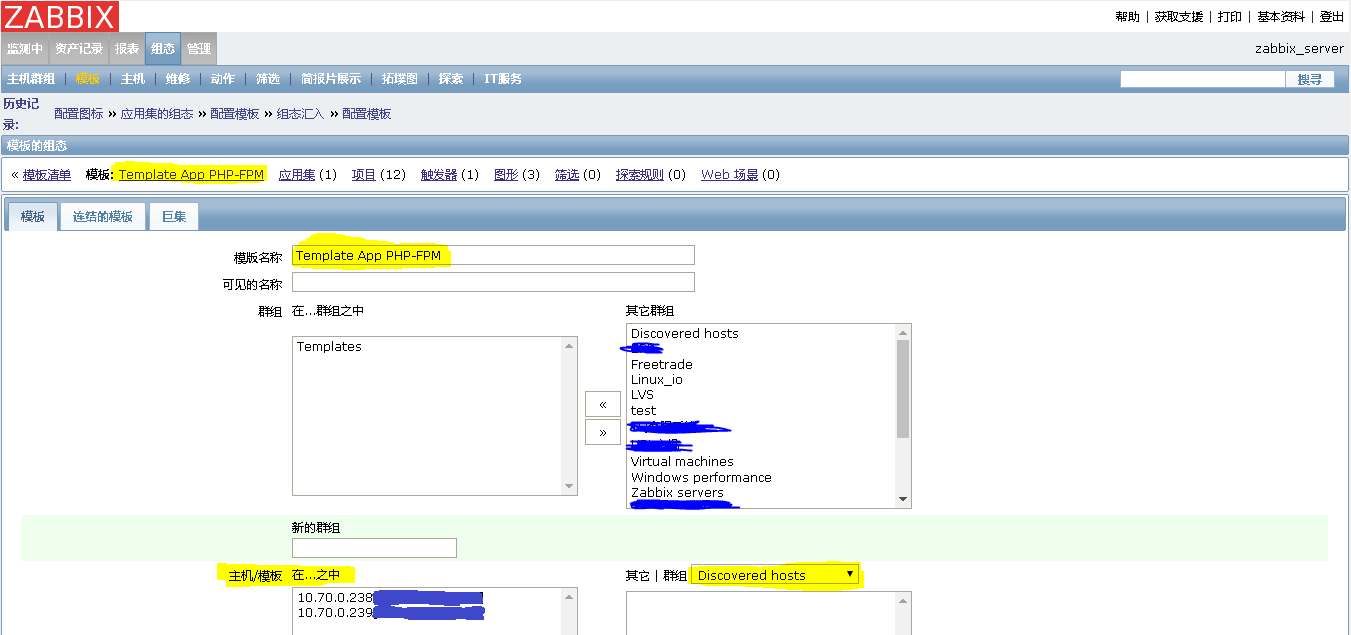
When the import above succeeds, look in your template list to see if it has already been imported.

As you can see from the figure above, a template called Template App PHP-FPM already exists.
View monitoring project content
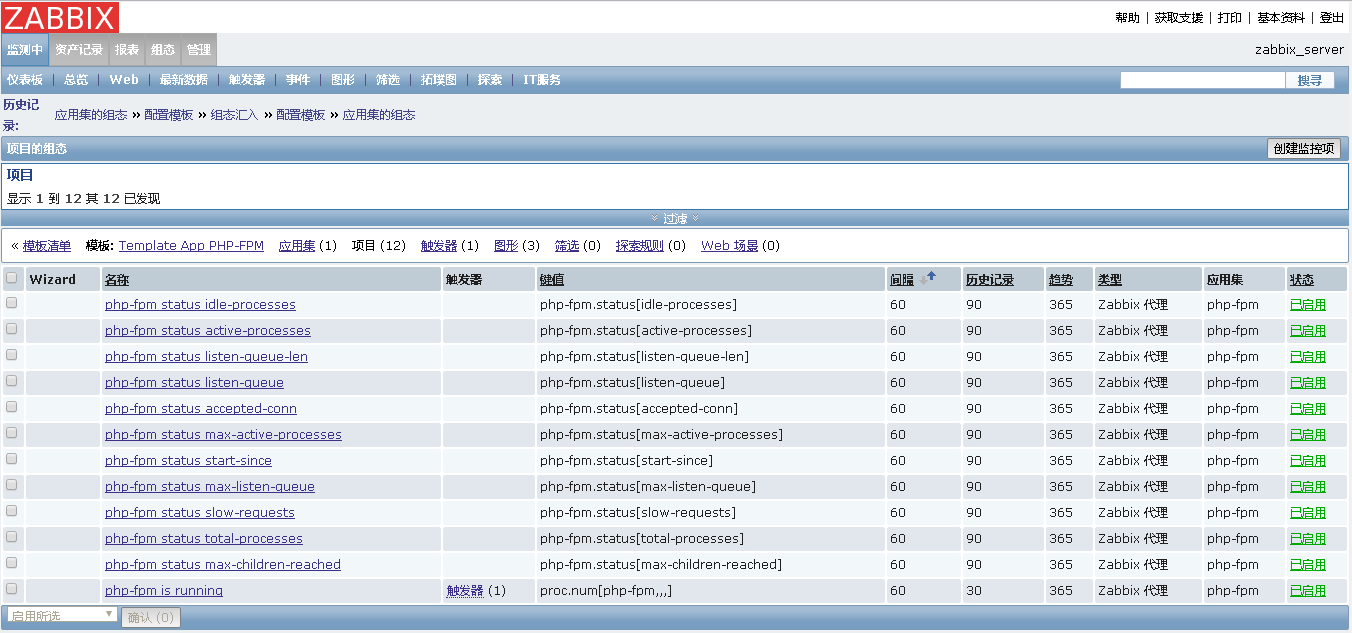
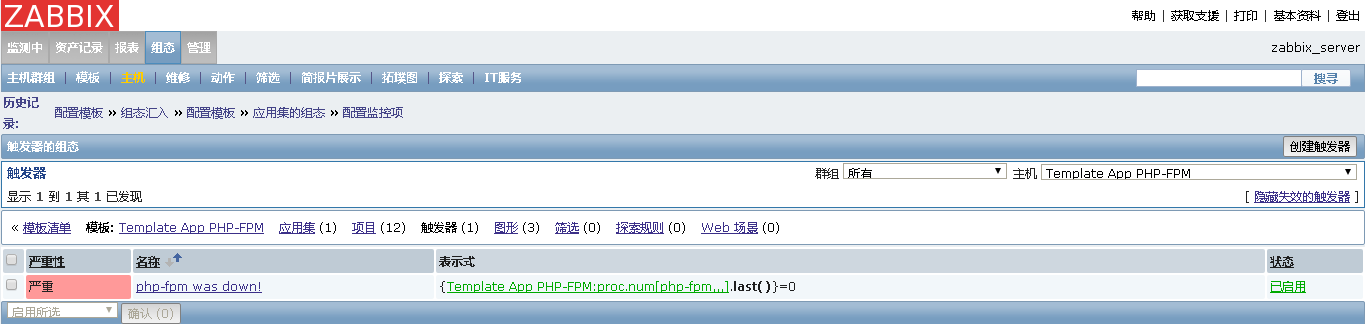
View monitor triggers
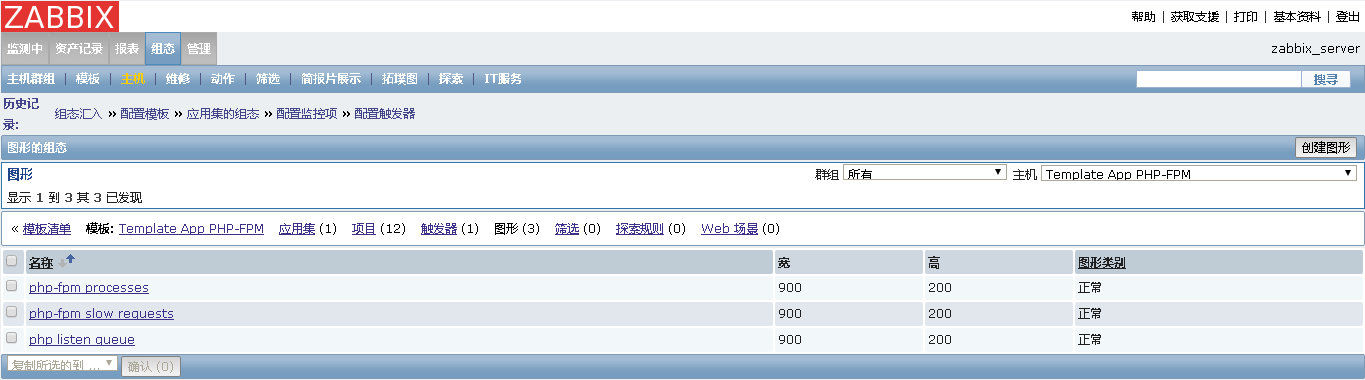
View Monitoring Graphics Content
Next, link the template to the host that you need to monitor the php-fpm service. The easiest way is to include the host in the monitoring template.
You can go back to your host and see if it has been connected to your host.
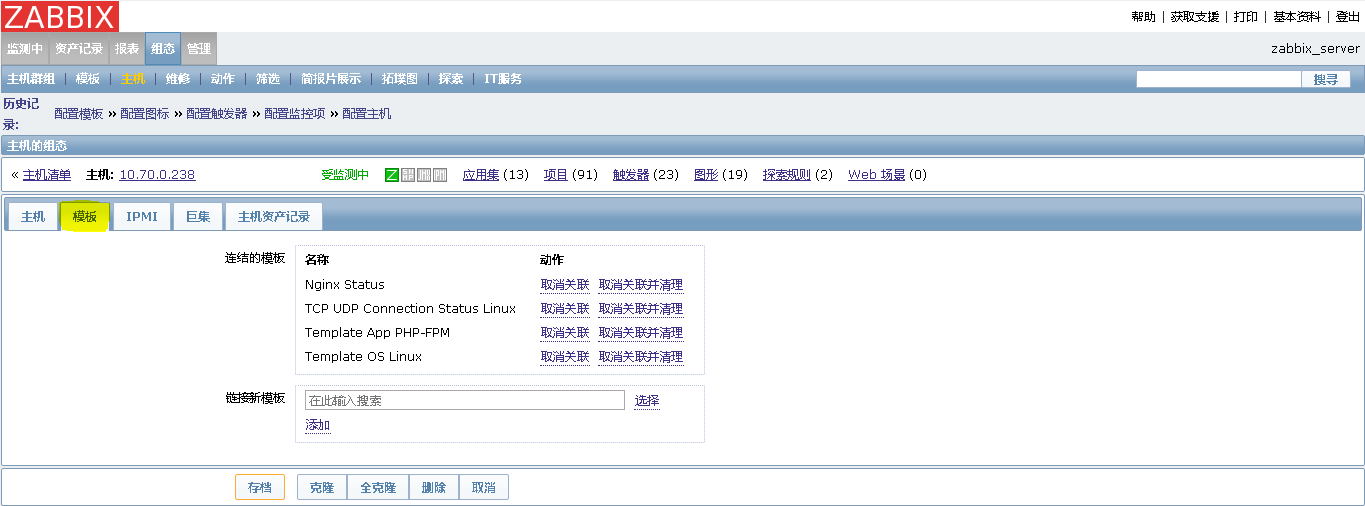
It was found that Template App PHP_FPM was already in the host's connection template.
If the template is not suitable, you can build monitoring template step by step. It may be different versions of zabbix monitoring, but it is basically the same. You can set it according to your own needs.
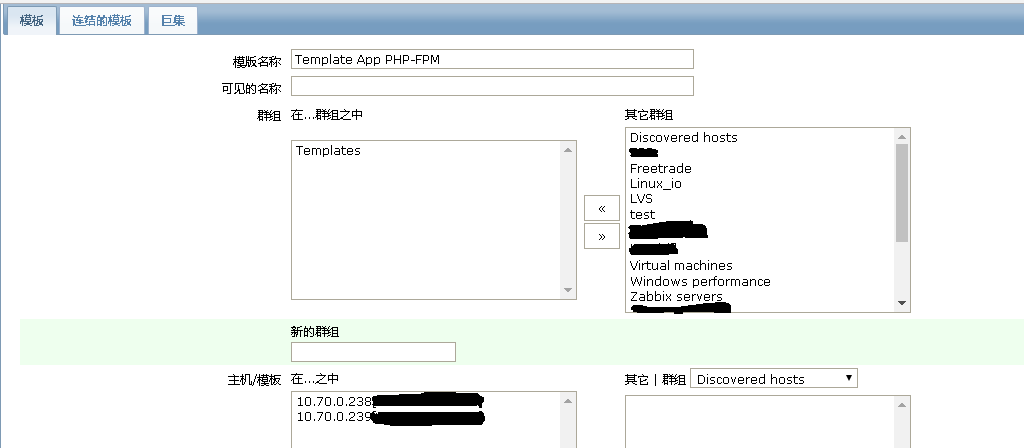
First create the monitoring template

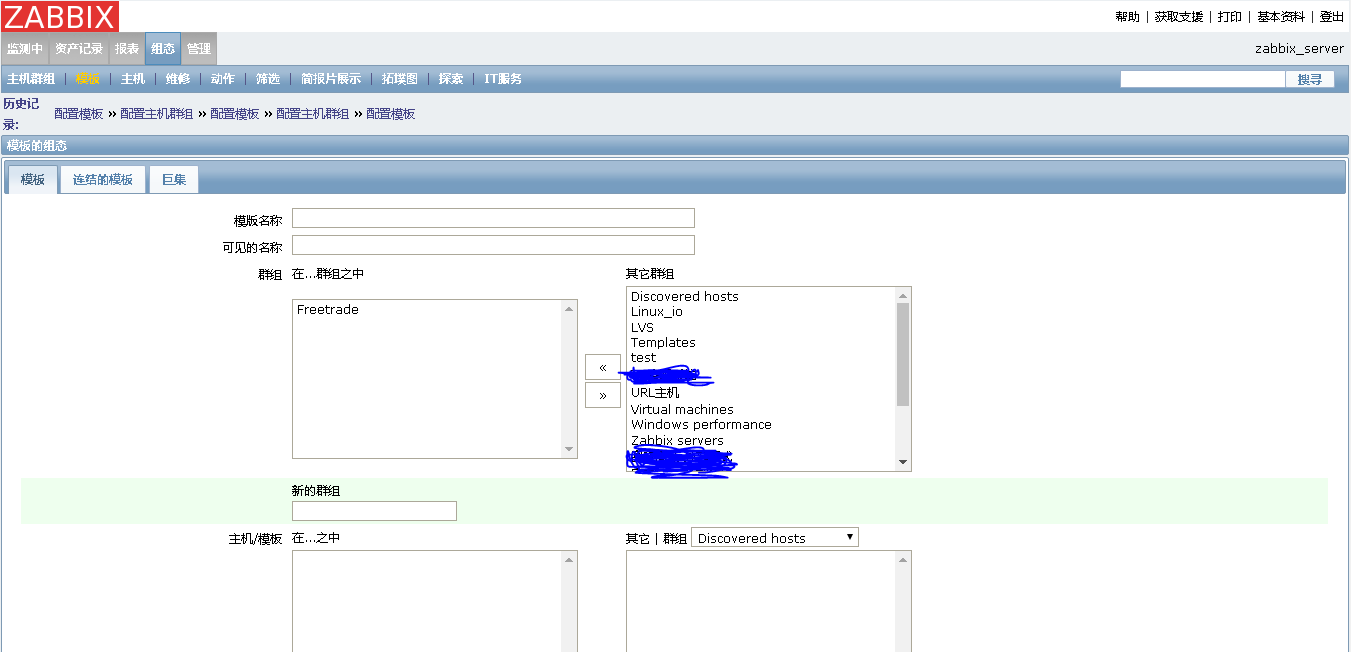
Select the group template, then fill in the desired template name and host that needs to be included in the monitoring template.
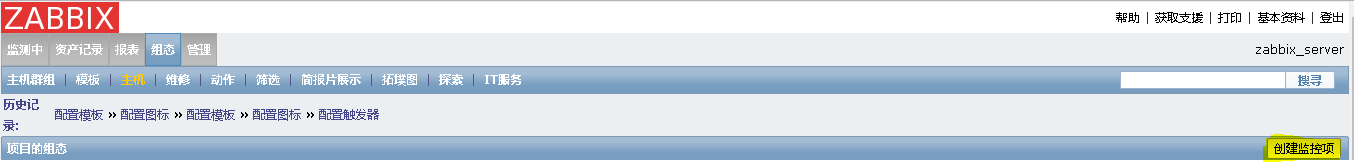
2. After configuring the template, create the application set


3. Adding monitoring items to the application set
Note: For the monitoring project, you can refer to the name and key value of the monitoring project in the content of the monitoring project posted above.
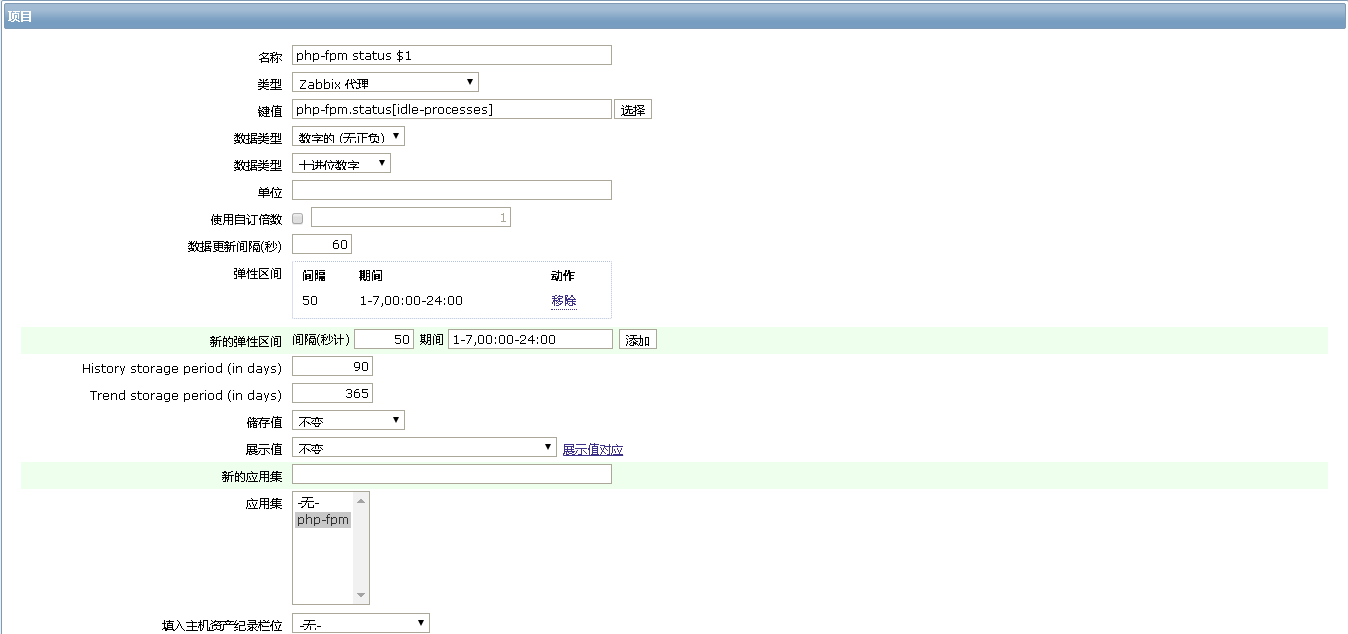
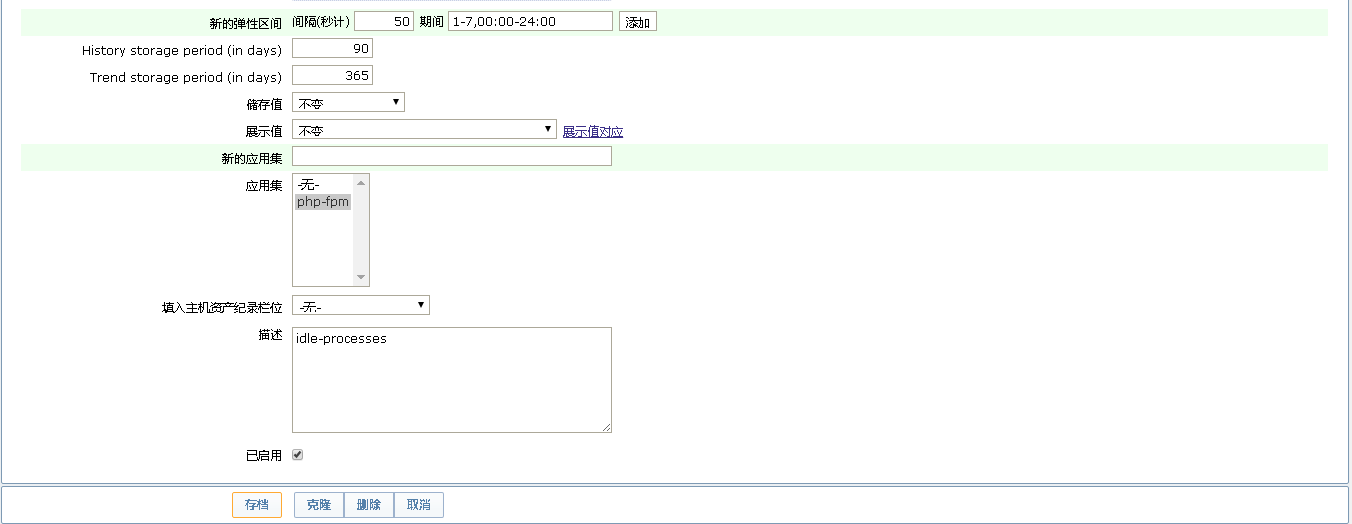
Other monitoring items and the above contents are the same except for the name, key value and comment description information.
4. Adding monitoring alarms

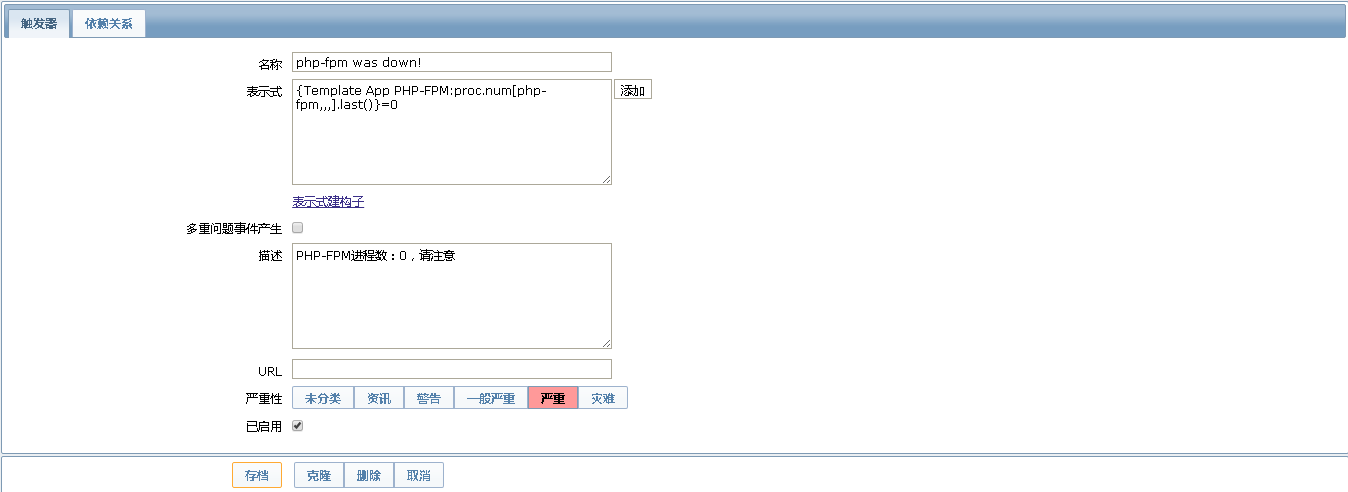
The warning above is that when the php-fpm process is zero, a serious warning is performed
5. Adding Monitoring Items to View Graphics
Note: For the monitoring graphics, you can refer to the name of the monitoring graphics in the content of the monitoring graphics posted above as a reference. It will be more accurate to set the monitoring graphics according to your own needs.

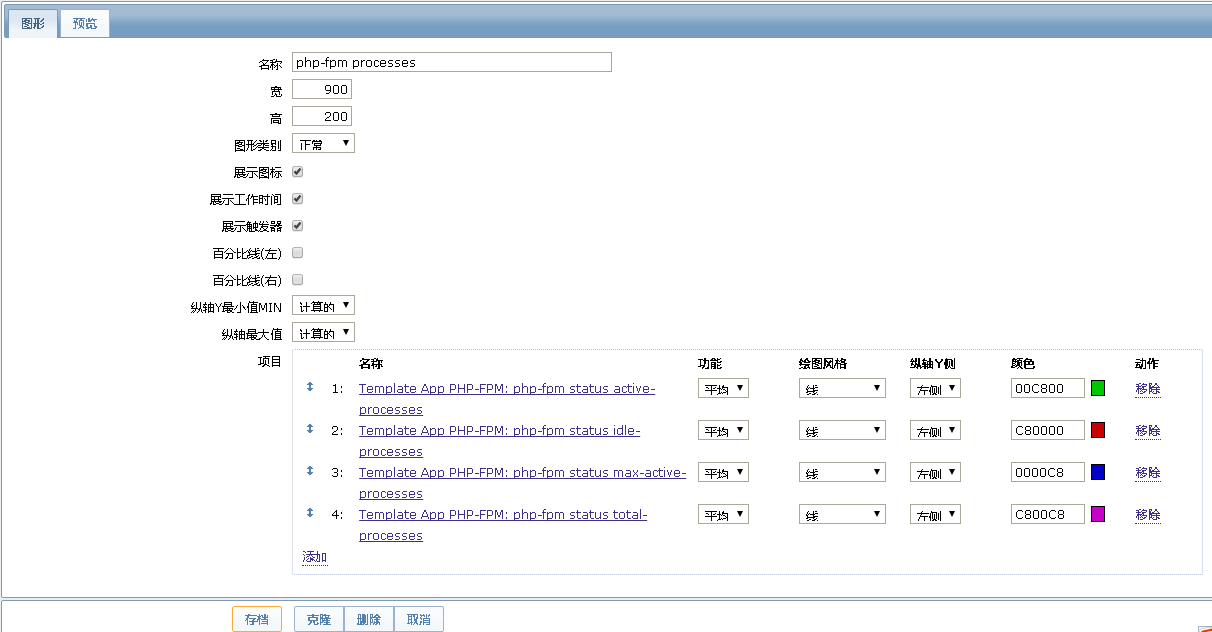
Fill in the name of the monitoring you want, and select the items you have added in the monitoring items. Anyway, you can set them according to your personal needs.
Set up the above, then you can directly check in the monitor to see if your monitor graphics have data generated.
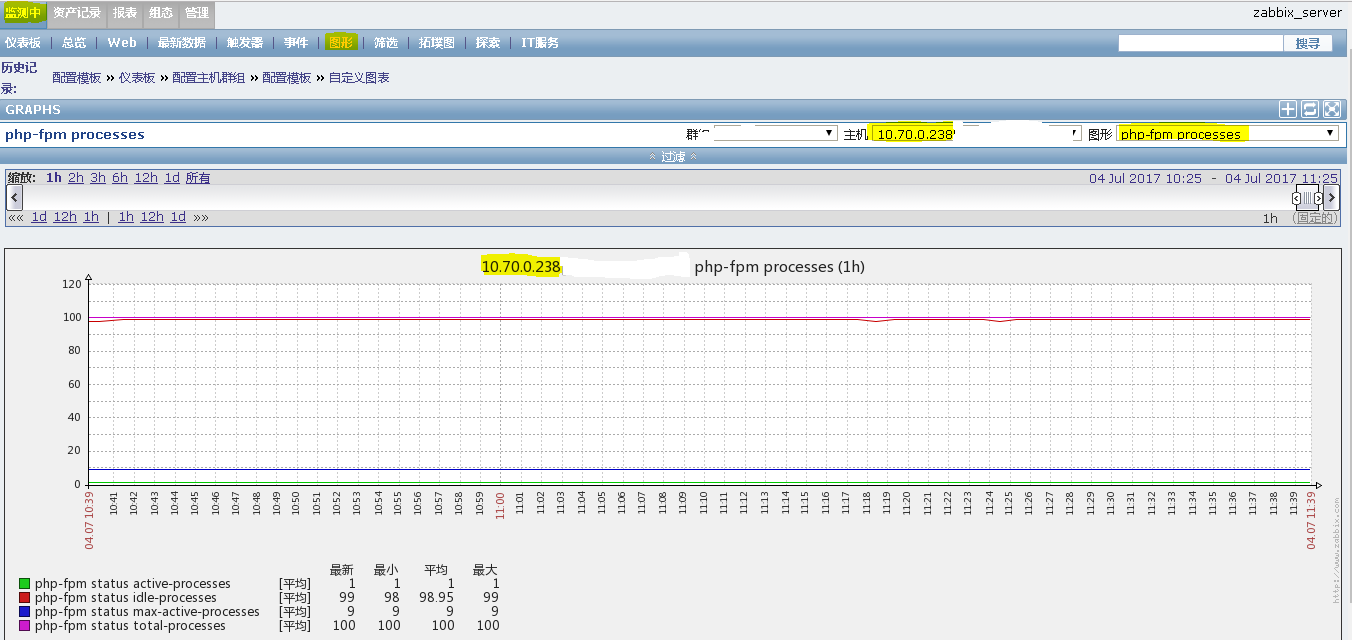
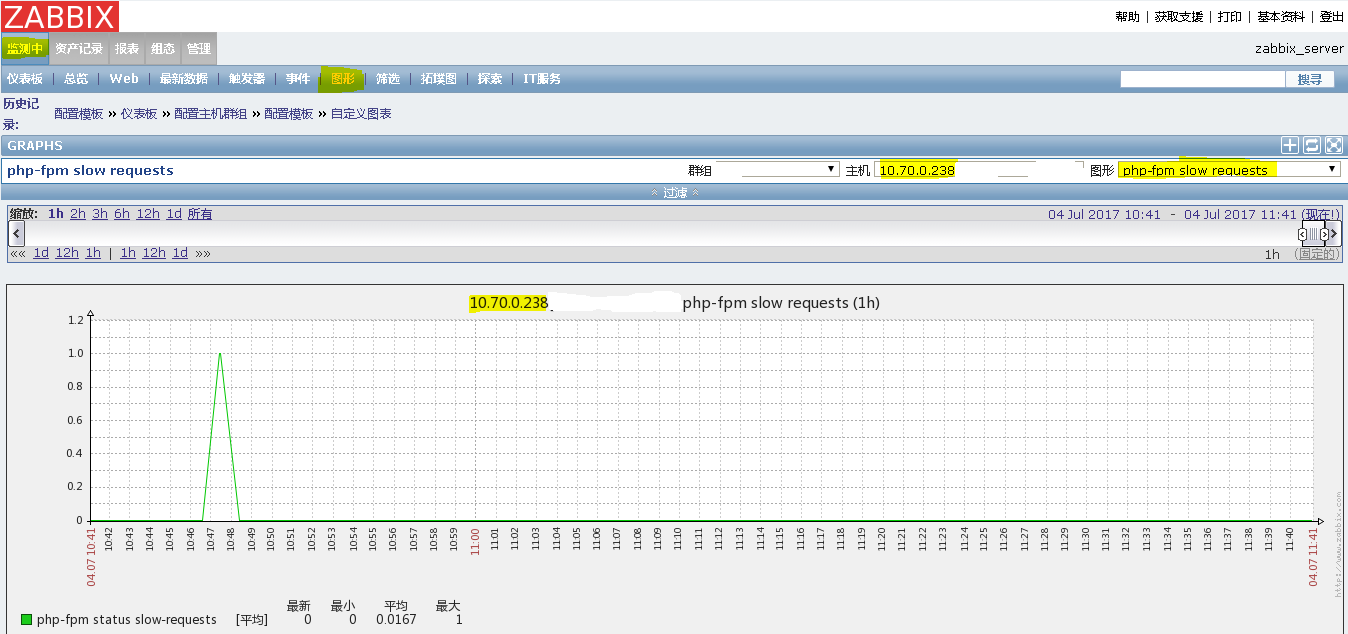
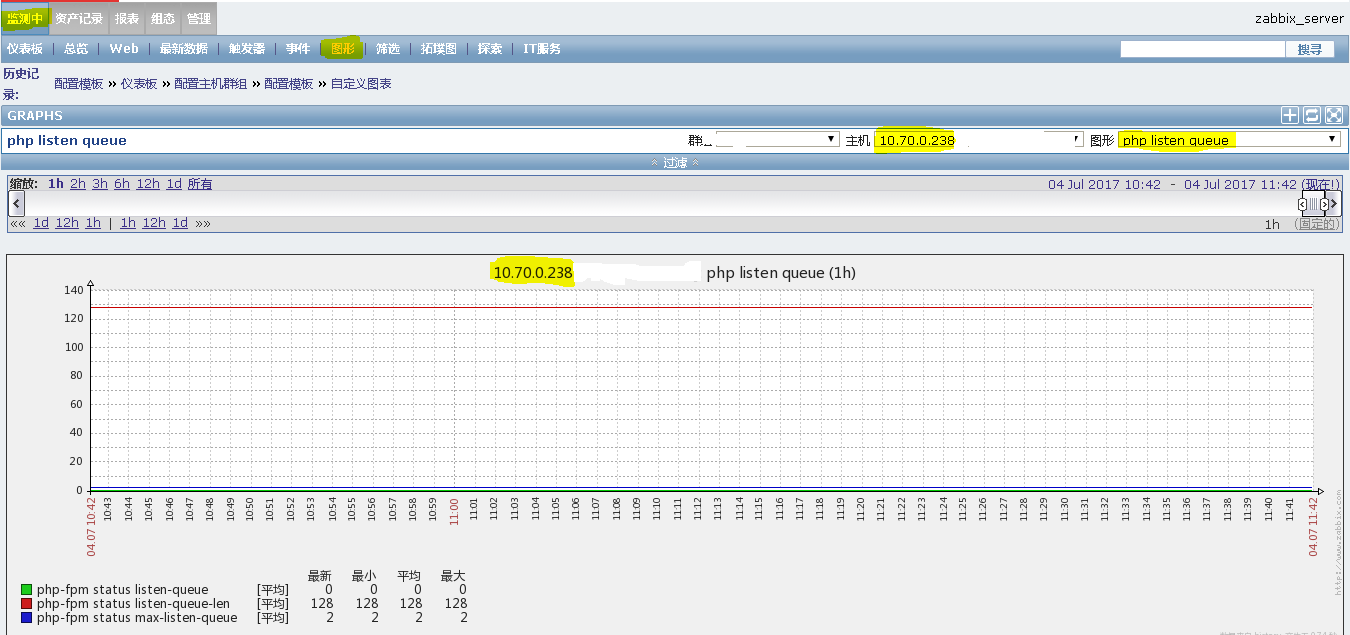
At this point, all the creation actions are finished. If the drawing is drawn, the setting is successful.