1, Algorithm principle
1. Principle overview
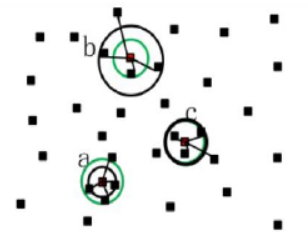
the point cloud data set generated by lidar sometimes receives echo signals incorrectly, which will lead to some wrong values. Due to the influence of measurement errors caused by scanning results, errors will inevitably occur in other processing of the point cloud, and some noise will inevitably appear in the point cloud data due to equipment accuracy, surrounding environment and other factors, Only by removing the outliers and noise in the point cloud in the filtering process can the subsequent point cloud data be better processed, such as point cloud segmentation, registration, reconstruction and so on. In order to remove these errors, the statistical filtering method is used to process the laser point cloud data. The statistical filtering is to statistically analyze the neighborhood of each point, and the points beyond the normal range are defined as outlier noise for removal. Outlier point clouds are usually scattered point clouds outside most of the point clouds. This noise has a great impact on the imaging, segmentation and subsequent target recognition of point clouds. The spatial distance of such points is greater than that between ordinary point clouds. In point cloud imaging, the number of point clouds can represent the imaging objects in a space. The more the number of point clouds in a region, the more dense it is, It can be explained that the more information contained in this area, the more likely it is to contain objects, and the less the number, the more likely it is not the measured target but noise points. By calculating the average distance in the point cloud, points outside a certain range can be regarded as outliers. Figure 1 shows the schematic diagram of point cloud statistical filtering. Here, the calculation point cloud model is shown in Figure 1. The average distance in the four neighborhoods of the calculation point is a black circle, while the calculation threshold is a green circle. Both points a and c are effective point clouds, and point b exceeding the threshold distance is regarded as outlier elimination.
2. Calculation process
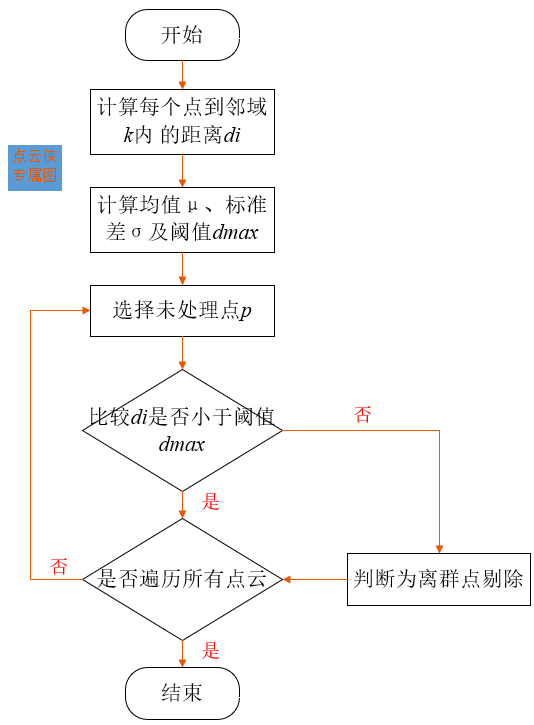
the algorithm flow chart is shown in the figure. Neighborhood calculation is carried out for all point clouds, and each point and its k k The distance set between k neighborhoods, and then calculate all points to its k k Mean value of k-Neighborhood distance μ μ μ And standard deviation σ σ σ, Distance threshold d m a x d_{max} dmax , can be expressed as d m a x = μ + α × σ d_{max}=μ+α×σ dmax=μ+α×σ, α α α Is the scale factor; All point clouds are processed, compared and eliminated k k The average distance of k neighbor points is greater than d m a x d_{max} dmax point. The steps of the algorithm are:
-
Calculate the total number of point clouds n n n. For point p p p pass k k k neighborhood search to find its neighborhood and calculate p p The average distance between p point and each point in its neighborhood;
-
Will get n n n distance sets{ d 1 , d 2 , d 3 , ... ... d n d_1,d_2,d_3,......d_n d1, d2, d3,... dn}, average μ μ μ Sum standard deviation σ σ σ Calculation of;
The mean value is:
μ = 1 n ∑ i = 1 n d i (1) μ=\frac{1}{n}\sum_{i=1}^n\ d_i\tag{1} μ=n1i=1∑n di(1)
The standard deviation is:
σ = 1 n ∑ i = 1 n ( d i − μ ) 2 (2) σ= \sqrt{\frac{1}{n}\sum_{i=1}^n\ (d_i-μ)^2}\tag{2} σ=n1i=1∑n (di−μ)2 (2) -
According to the mean μ μ μ Sum standard deviation σ σ σ The maximum threshold based on Gaussian distribution is obtained d m a x = μ + α × σ d_{max}=μ+α×σ dmax= μ+α×σ, among a a a is the coefficient of standard deviation, a a a determines the threshold value range. For different point cloud distribution and different degrees of noise, a a The value of a also needs to be changed. If the coefficient is too small, some useful point clouds will be removed as outliers. If it is too large, the denoising effect will be poor. It is necessary to select appropriate parameters to obtain better filtering effect.
-
Compare each average distance μ μ μ And threshold d m a x d_{max} The size of dmax , and processing points will exceed the threshold d m a x d_{max} dmax # value points are defined as outlier noise point removal.
2, Code implementation
from pclpy import pcl


def point_cloud_viewer(cloud, cloud_filtered):
    # Open 3D viewer and add point cloud and normals
    viewer = pcl.visualization.PCLVisualizer("viewer")
    v0 = 1
    viewer.createViewPort(0.0, 0.0, 0.5, 1.0, v0)
    viewer.setBackgroundColor(0.0, 0.0, 0.0, v0)
    single_color = pcl.visualization.PointCloudColorHandlerCustom.PointXYZ(cloud, 0.0, 255.0, 0.0)
    viewer.addPointCloud(cloud, single_color, "sample cloud1", v0)

    v1 = 2
    viewer.createViewPort(0.5, 0.0, 1.0, 1.0, v1)
    viewer.setBackgroundColor(0.0, 0.0, 0.0, v1)
    single_color = pcl.visualization.PointCloudColorHandlerCustom.PointXYZ(cloud_filtered, 255.0, 0.0, 0.0)
    viewer.addPointCloud(cloud_filtered, single_color, "sample cloud2", v1)

    viewer.setPointCloudRenderingProperties(0, 1, "sample cloud1", v0)
    viewer.setPointCloudRenderingProperties(0, 1, "sample cloud2", v1)
    viewer.addCoordinateSystem(1.0)
    while not viewer.wasStopped():
        viewer.spinOnce(10)


if __name__ == '__main__':
    # Read point cloud data
    cloud = pcl.PointCloud.PointXYZ()
    filtered_cloud = pcl.PointCloud.PointXYZ()
    pcl.io.loadPCDFile('table_scene_lms4001.pcd', cloud)
    # reader = pcl.io.PCDReader()
    # reader.read('table_scene_lms4001.pcd', cloud)
    print("The number of points before filtering is: ", cloud.size())

    # Create sor filter
    sor = pcl.filters.StatisticalOutlierRemoval.PointXYZ()
    sor.setInputCloud(cloud)
    sor.setMeanK(50)
    sor.setStddevMulThresh(1.0)
    sor.filter(filtered_cloud)
    print("The number of filtered points is: ", filtered_cloud.size())
    writer = pcl.io.PCDWriter()
    writer.write("table_scene_lms400_inliers.pcd", filtered_cloud)
    cloud_filtered_outliers= pcl.PointCloud.PointXYZ()
    sor.setNegative(True)
    sor.filter(cloud_filtered_outliers)
    writer.write("table_scene_lms400_outliers.pcd", cloud_filtered_outliers)

    # Main cycle
    point_cloud_viewer(cloud, filtered_cloud)
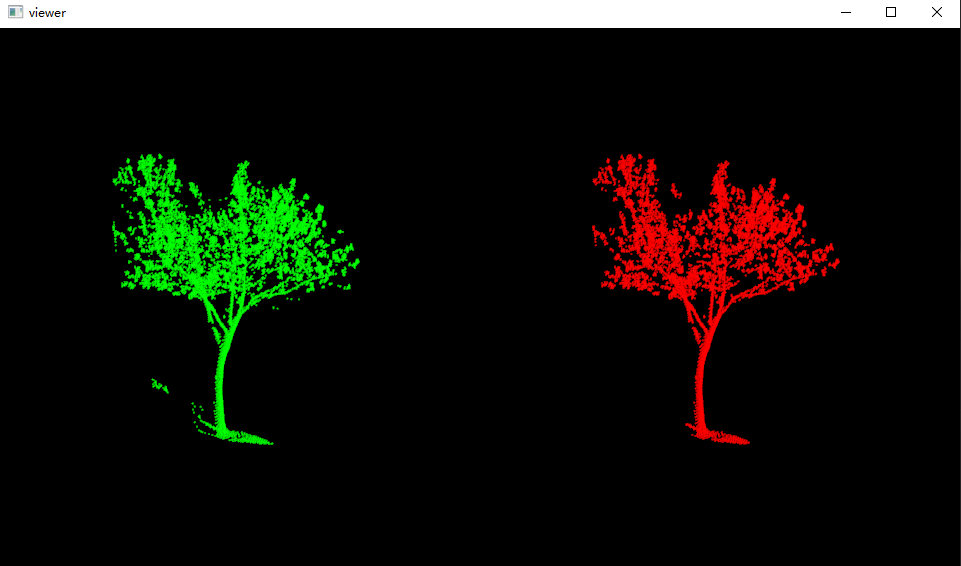
3, Result display