Graylog can collect nginx logs in two ways: one is through the Graylog Collector Sidecar (active mode), and the other is through modifying the nginx configuration file (passive mode).
This time, let's change the nginx configuration file (passive mode). The advantage of passive mode is that nginx sends the defined log fields to the user-defined port of graylog in json format, and graylog extracts the fields directly through json parsing. The advantage is that it does not need to configure complex regularities to parse log fields, which greatly reduces the cpu resource consumption of graylog. If you use regular parsing log fields, every time you add a new field, the corresponding regular parsing needs to be modified, which is very inflexible. Of course, this method also has disadvantages. First, nginx version 1.12.1 or above is required. Second, the ip sent to graylog by nginx configuration is fixed. If this node of the graylog cluster is hung, it cannot be transferred to other nodes. Third, after nginx directly sends the log to graylog, the local will not print the log output.
Taking graylog 2.5.2 as an example, this paper introduces how to collect nginx logs passively.
1. Go to graylog marketplace to download the content pack file and import it into graylog.
(1) content pack file download link: nginx content pack
(2) Select system / content packs - > content packs - > import content pack in the menu, select the file and upload it
(3) Select content packs - > Web servers - > nginx from the menu and click the Apply content button
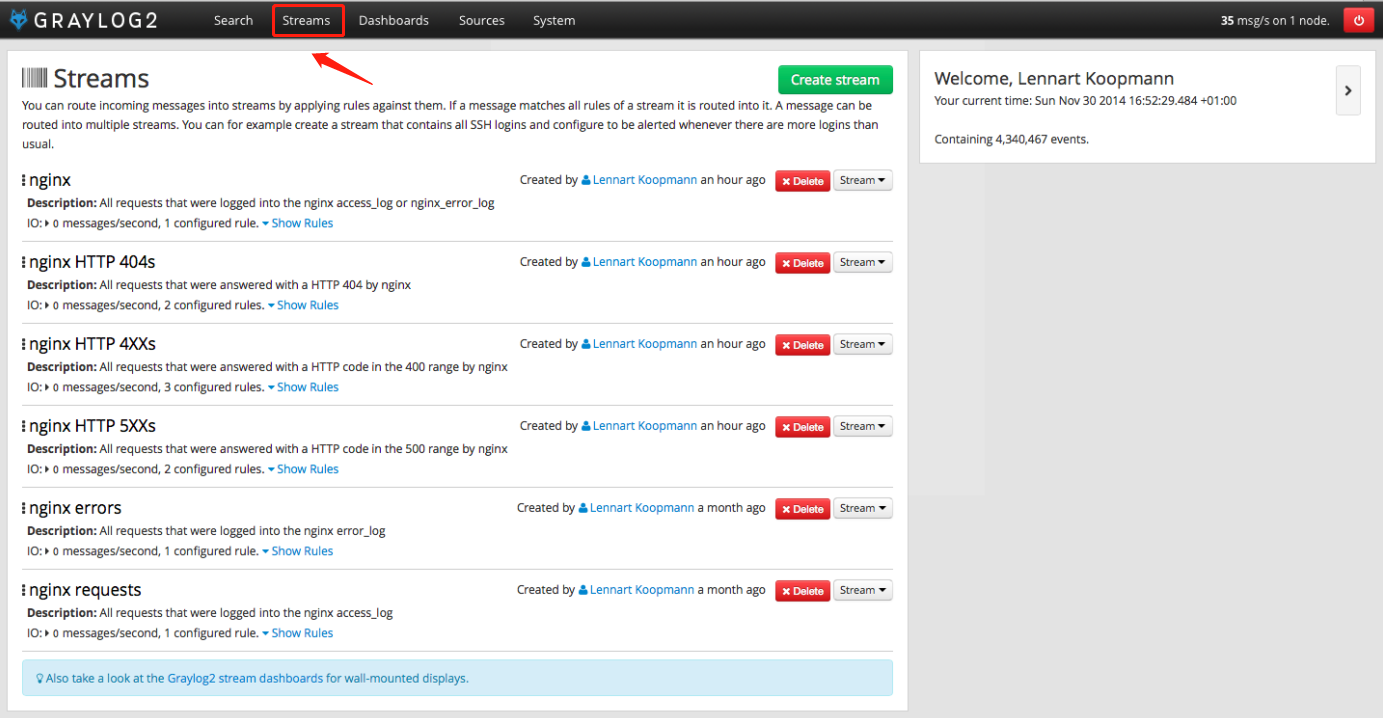
(4) Select the navigation bar Streams to view. The related Streams about nginx have been created automatically
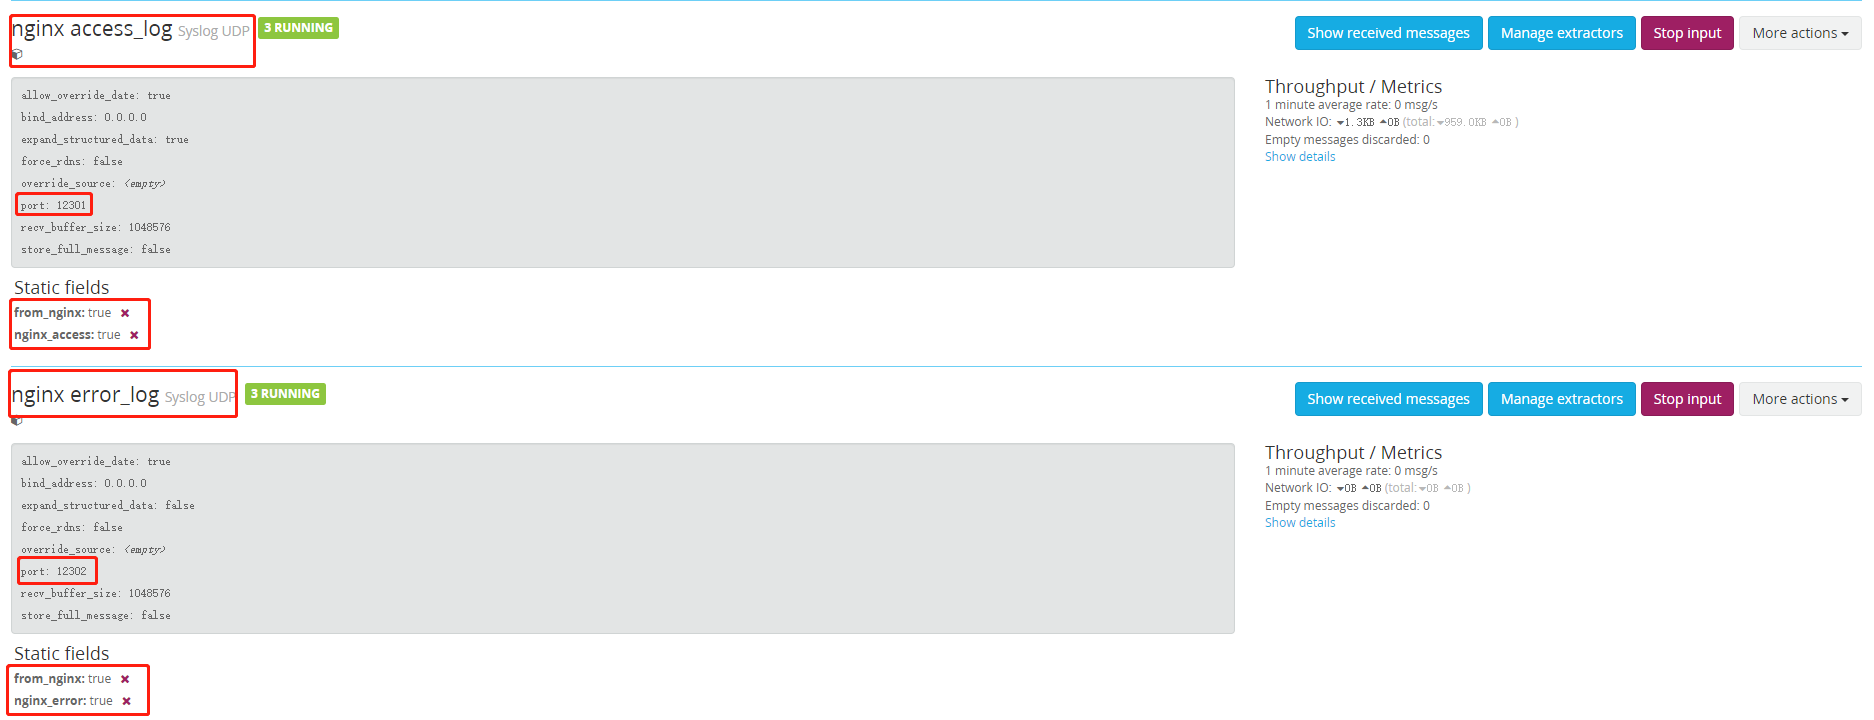
(5) Select system / inputs - > input in the navigation bar to see that the input port related to nginx has been established
2. Modify the related configuration of nginx, assuming that the ip address of graylog server is 192.168.251.3
(1) Modify related configuration of nginx log format
             '"remote_addr": "$remote_addr", '
             '"remote_user": "$remote_user", '
             '"body_bytes_sent": $body_bytes_sent, '
             '"request_time": $request_time, '
             '"status": $status, '
             '"request": "$request", '
             '"request_method": "$request_method", '
             '"host": "$host",'
             '"source": "192.168.251.3",'
             '"upstream_cache_status": "$upstream_cache_status",'
             '"upstream_addr": "$upstream_addr",'
             '"http_x_forwarded_for": "$http_x_forwarded_for",'
             '"http_referrer": "$http_referer", '
             '"http_user_agent": "$http_user_agent" }';
access_log syslog:server=192.168.251.3:12301 graylog2_json;
error_log syslog:server=192.168.251.3:12302;
(2) nginx configuration with ssl
 '"remote_addr": "$remote_addr", '
 '"remote_user": "$remote_user", '
 '"request_url": "$request_uri", '
 '"req_status": "$status", '
 '"response_size_B": "$bytes_sent", '
 '"req_protocol": "$server_protocol",'
 '"req_method": "$request_method",'
 '"req_srvname": "$server_name",'
 '"req_time": "$request_time",'
 '"connection-id": "$request_id",'
 '"ssl_prot_version": "$ssl_protocol",'
 '"ssl_cipher": "$ssl_cipher",'
 '"ssl_conn_reused": "$ssl_session_reused",'
 '"ssl_session_id": "$ssl_session_id",'
 '"http_referrer": "$http_referer", '
 '"http_user_agent": "$http_user_agent", '
 '"http_x_referer": "$http_x_referer" }';

access_log syslog:server=192.168.251.3:12301,facility=local0,tag=nginx,severity=info graylog2_json;
error_log  syslog:server=192.168.251.3:12302,facility=local0,tag=nginx,severity=error warn;
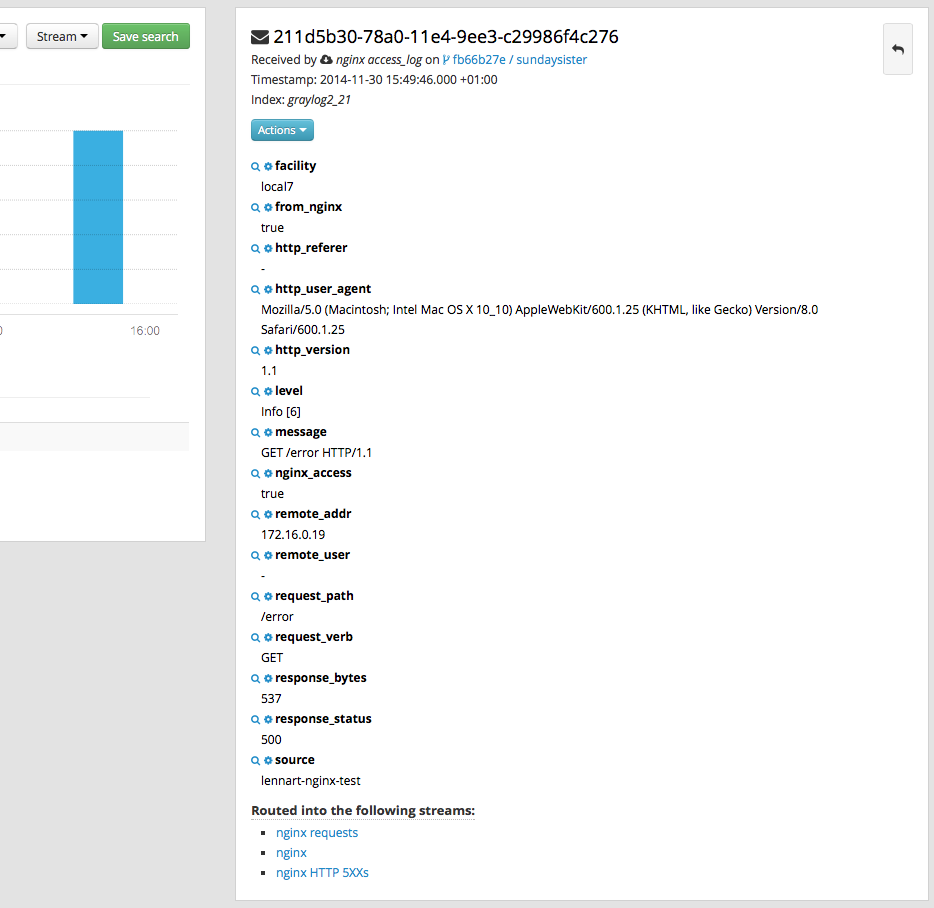
(3) After modification, execute nginx -t to check whether the configuration is correct, and finally execute nginx -s reload to load the configuration. Select navigation bar streams - > nginx to see that the related nginx logs have been collected and the fields have been resolved.