Official account: Special House
Author: Peter
Editor: Peter
Hello, I'm Peter~
This article mainly introduces how to beautify the data of Pandas DataFrame. It is mainly realized through two methods in Pandas:
- Styler.applymap: returns a single string with CSS attribute value pairs element by element
- Styler.apply: returns Series or DataFrame with the same shape in the form of columns, tables and rows, where each value is a string with CSS attribute value pairs. When the method works, it is passed through the parameter axis. axis=0 means acting by column and axis=1 means acting by row.
Official website learning address:
- https://pandas.pydata.org/pandas-docs/version/1.1.5/user_guide/style.html#Export-to-Excel
- https://pandas.pydata.org/pandas-docs/stable/user_guide/style.html

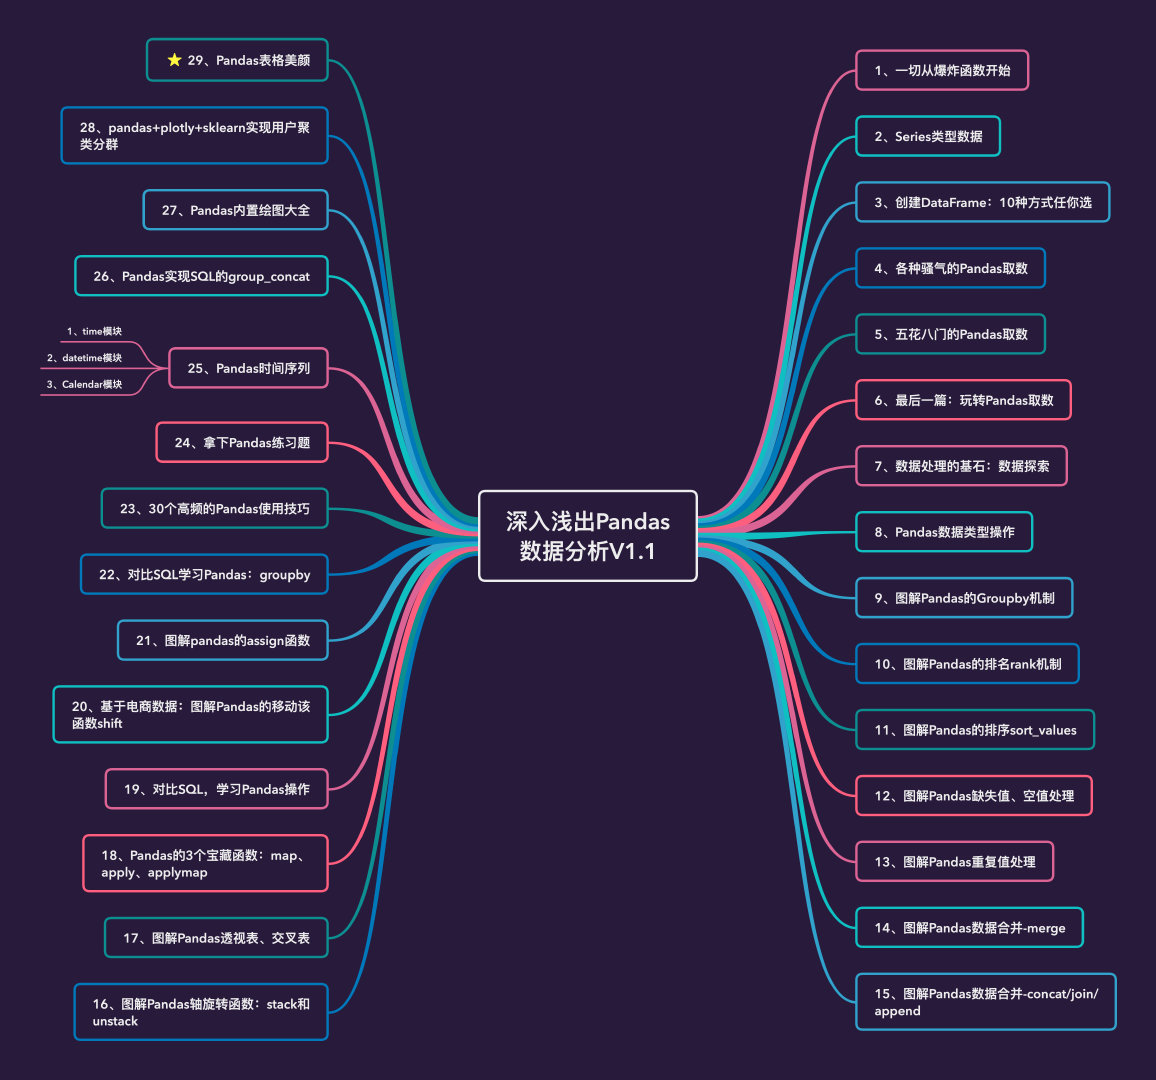
Pandas serial
Pandas's articles have been serializing:
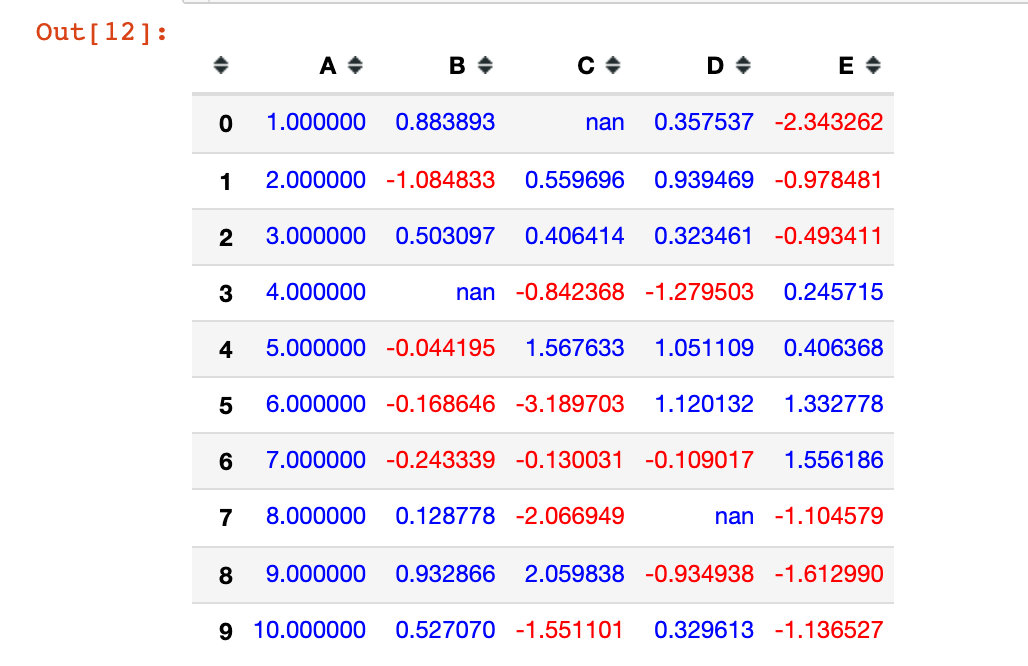
Analog data
import pandas as pd
import numpy as np
# Set random seeds to ensure the same results every time
np.random.seed(20)
# Analog data
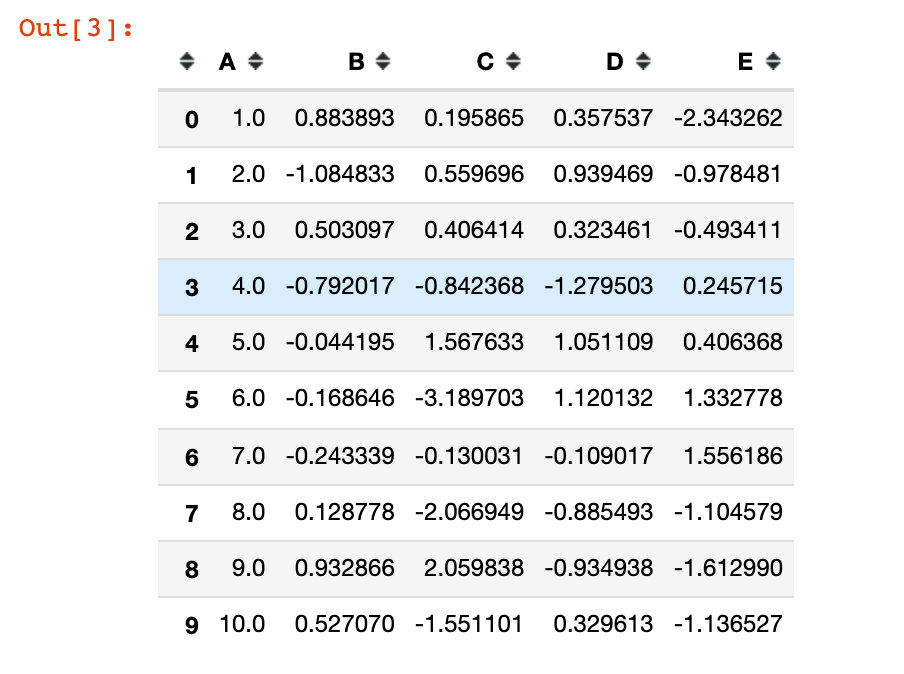
df = pd.DataFrame({'A': np.linspace(1, 10, 10)})
# Merge two dataframes
df1 = pd.concat([df, pd.DataFrame(np.random.randn(10,4), columns=list("BCDE"))],axis=1)
df1
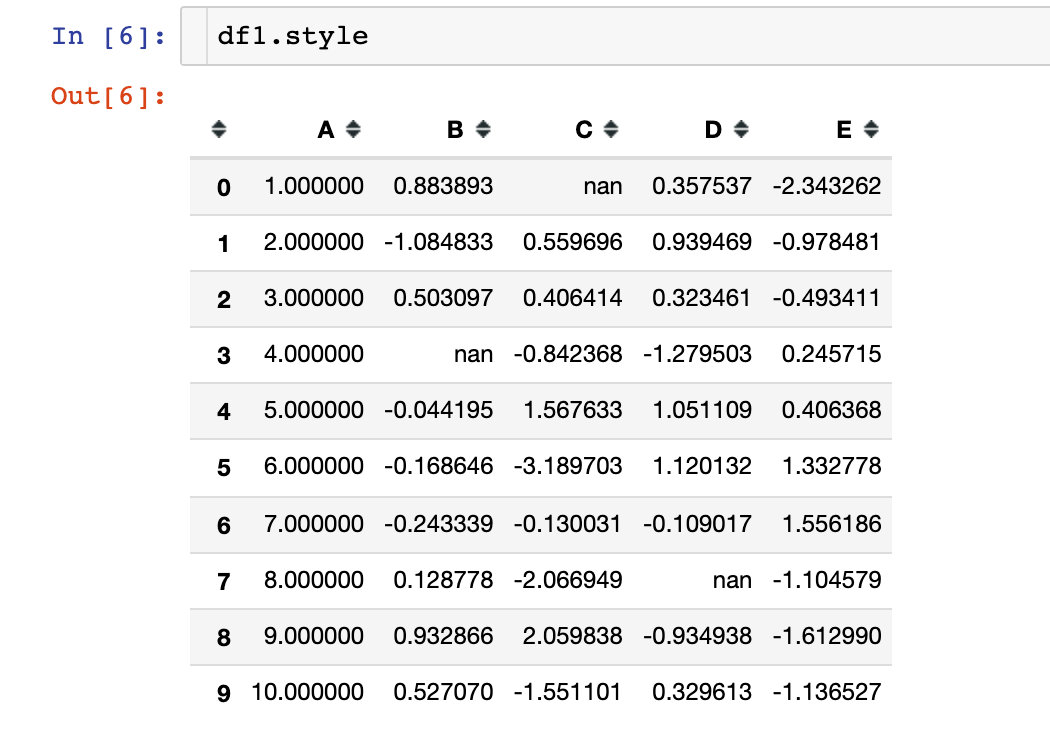
Linspace (start, stop, set) in numpy: indicates that the data is retrieved according to the step size, including the head and tail data:
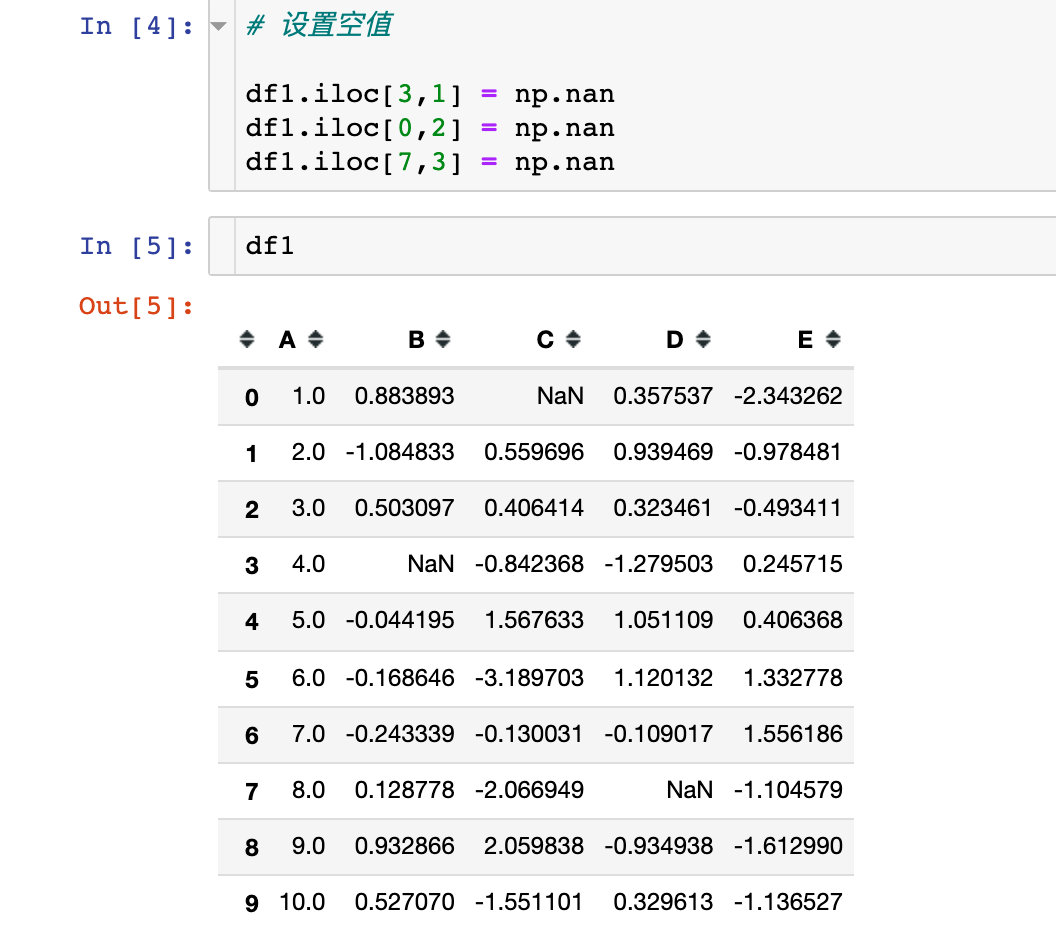
In order to see the effect of null values, three null values nan are specially set:
View and Hide Styles
First, view the style settings of the DataFrame:
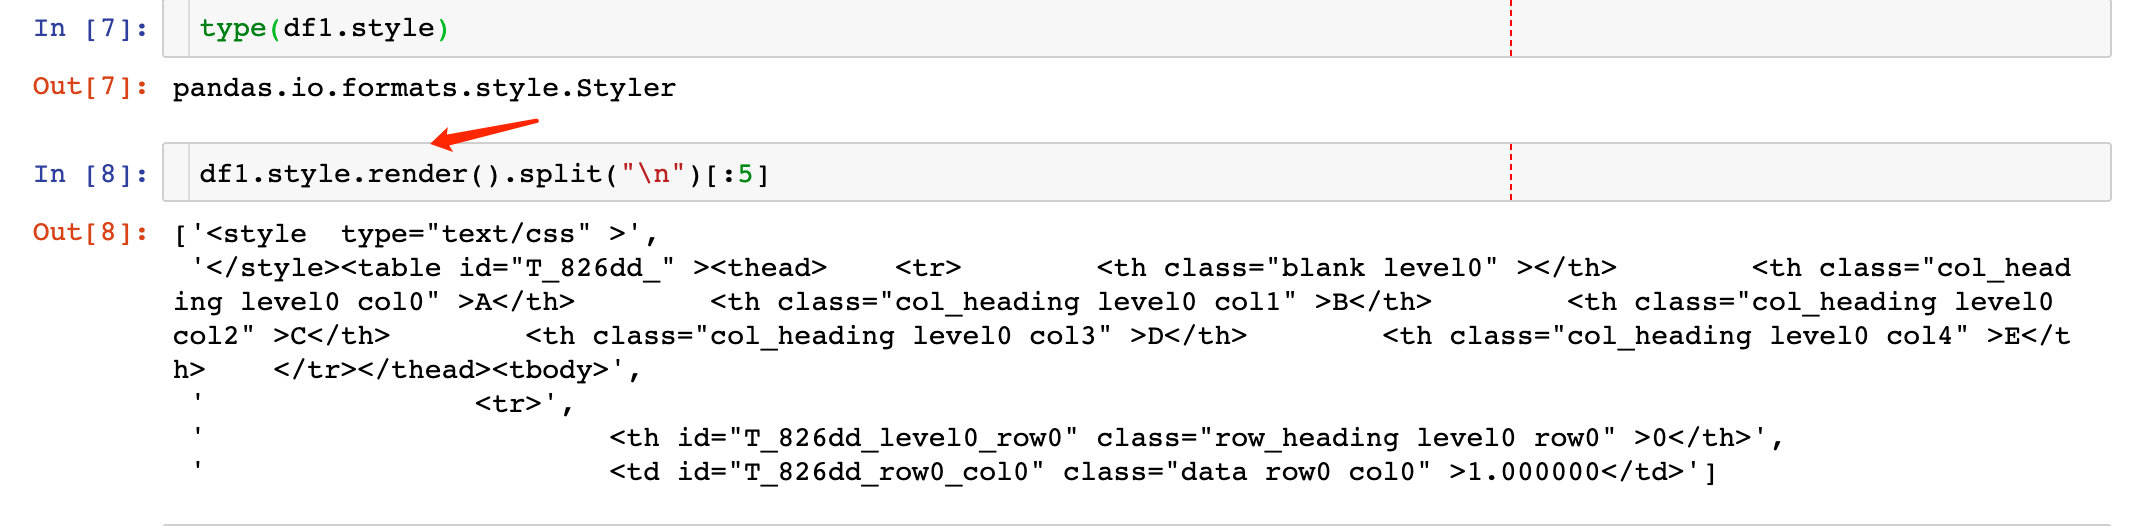
We can use the render method to view the specific values of the data frame style: we find that the code is the default CSS style
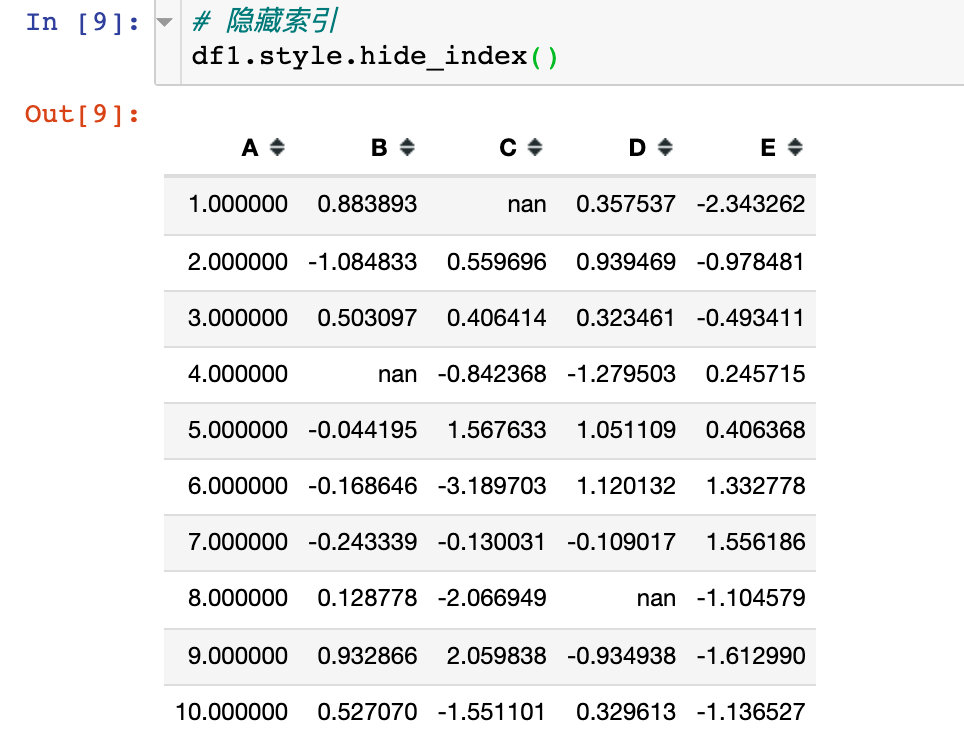
Hide index
Code to hide index:
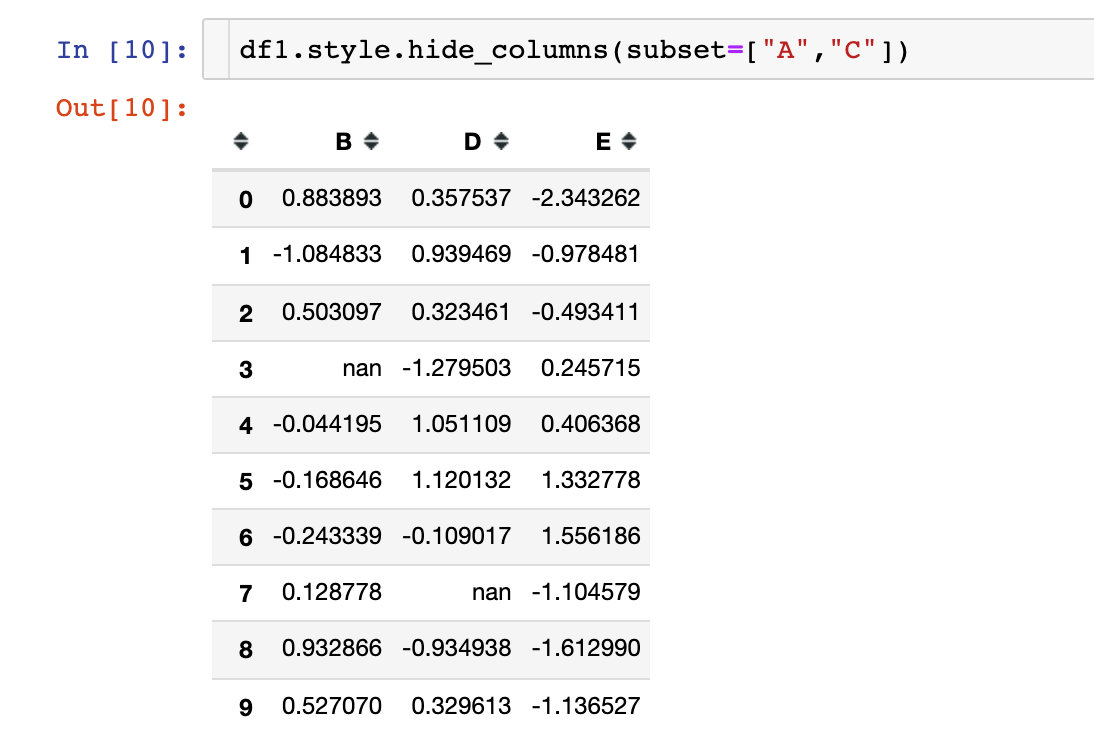
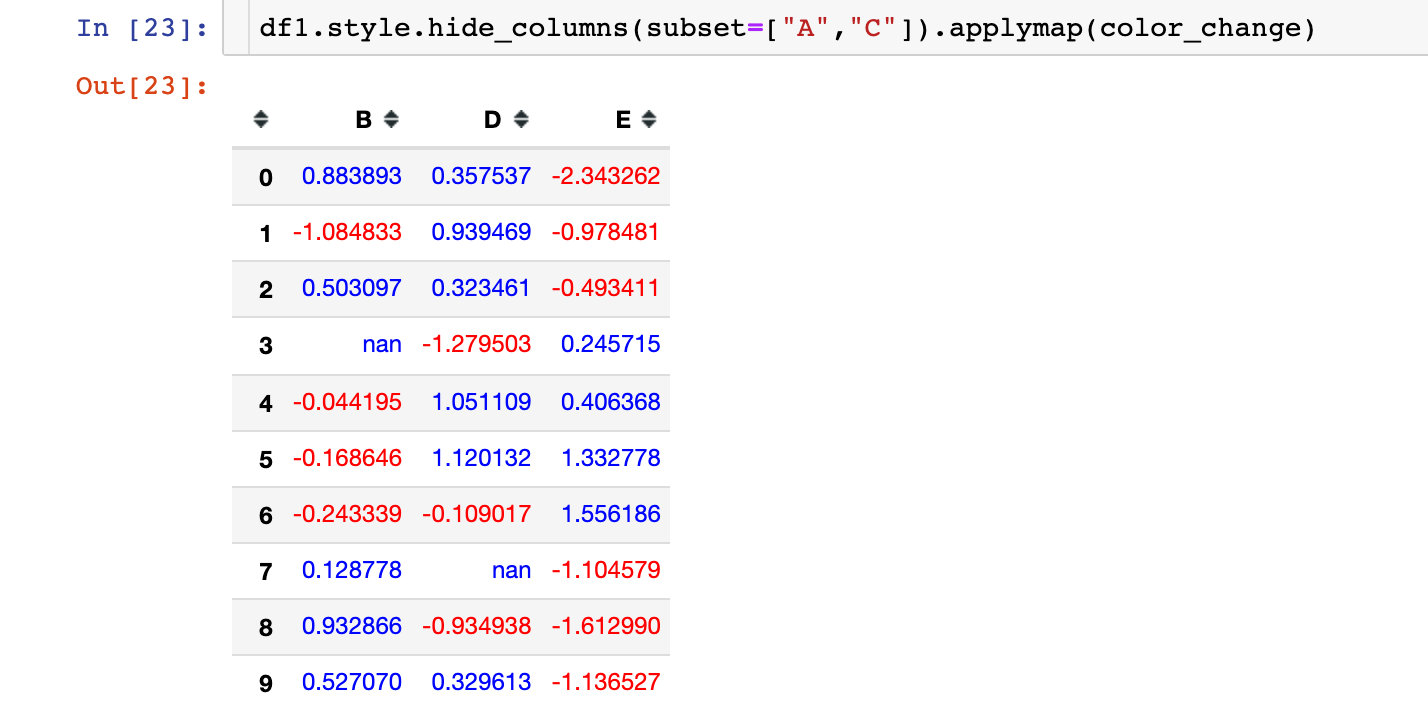
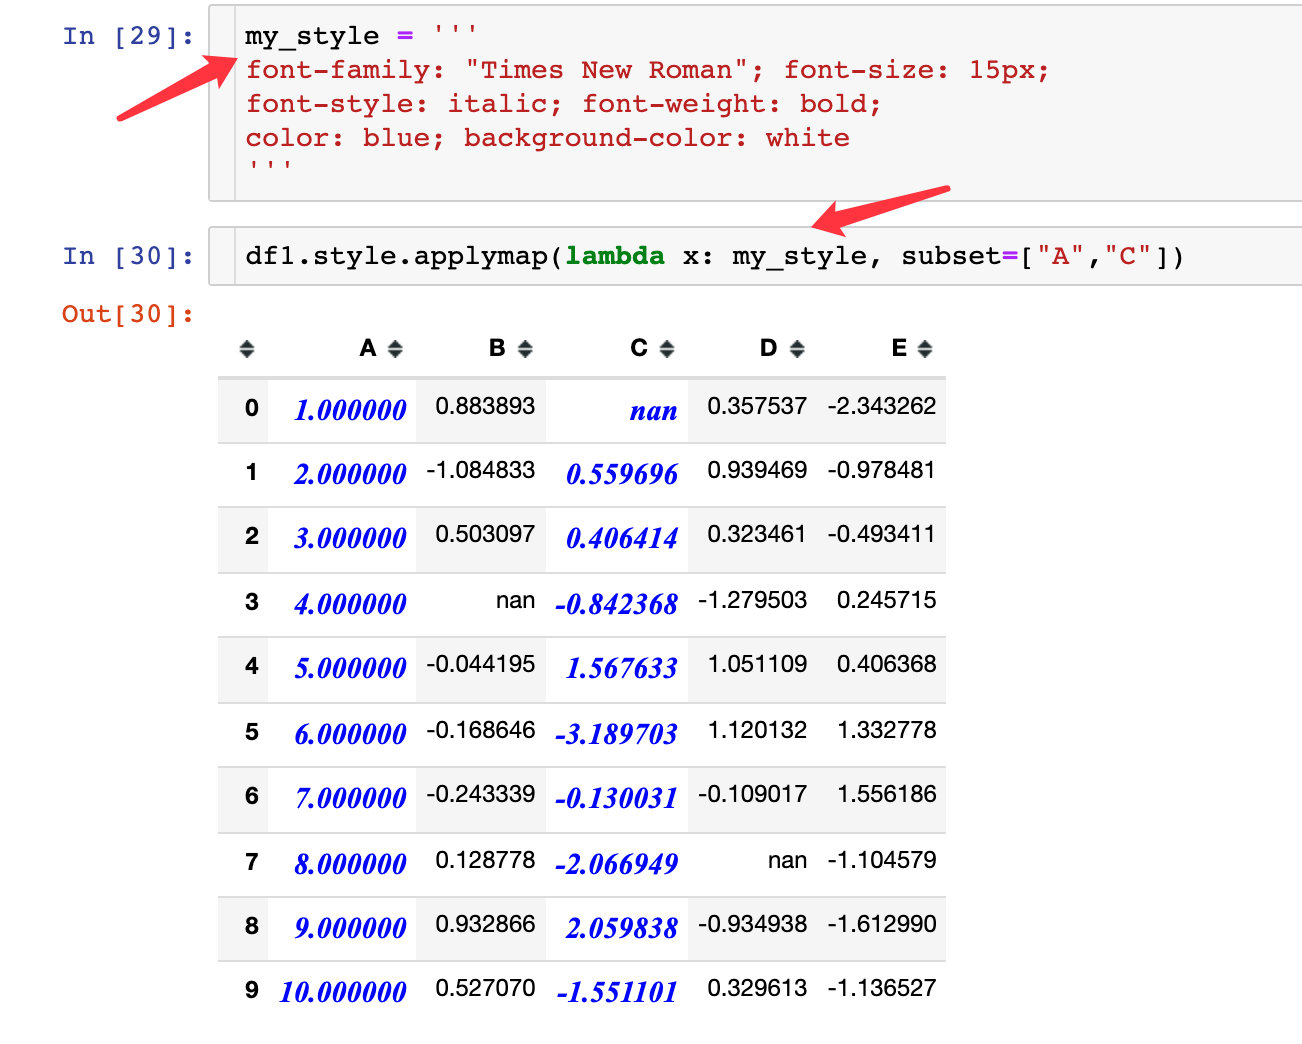
Hides the specified column
We found that the AC two columns are hidden, using the parameter subset parameter:
The following are examples of various display styles:
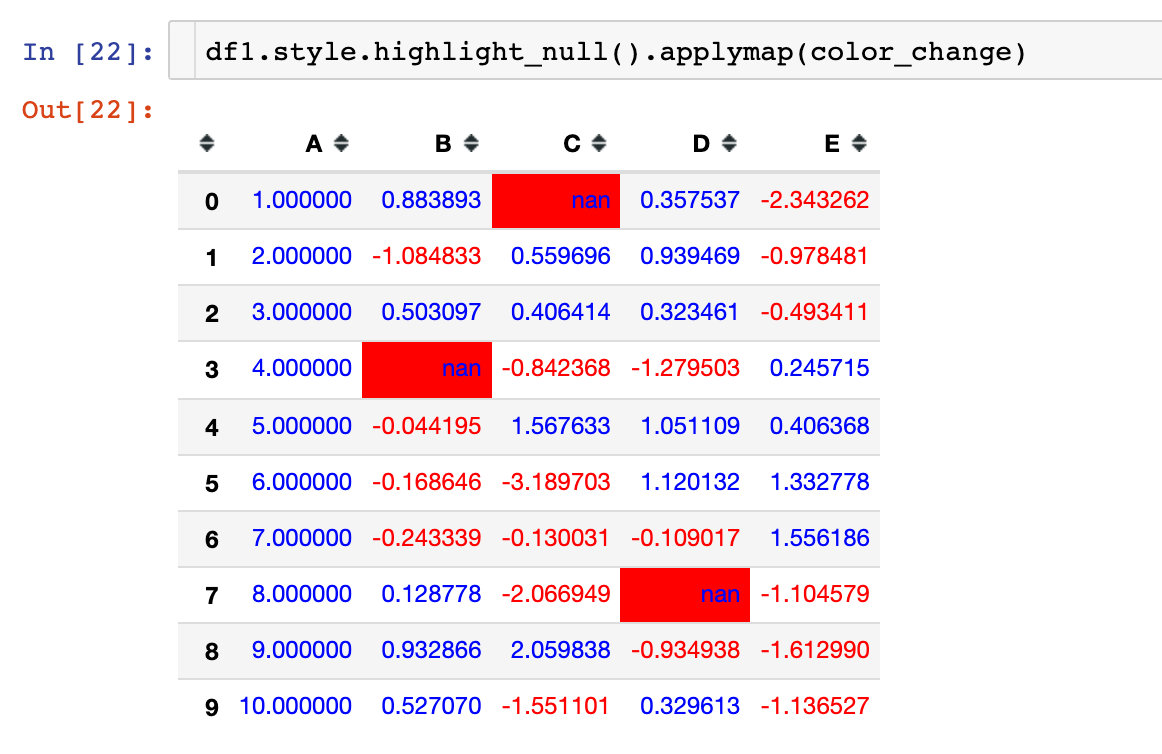
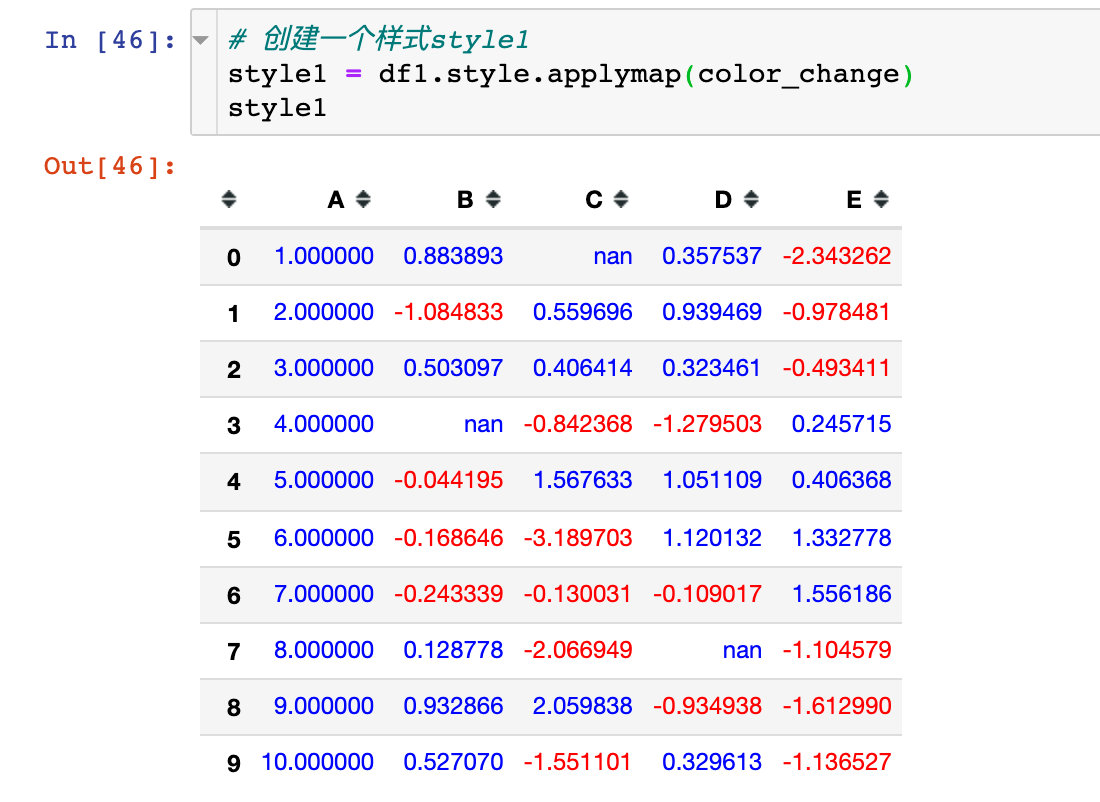
Case 1: positive and negative colors
Less than 0 shows red, greater than 0 shows blue
def color_change(val):
    color = 'red' if val < 0 else 'blue'
    return 'color: %s' % color
# Use applymap and call the written function
df1.style.applymap(color_change)
The applymap method is for the entire DataFrame
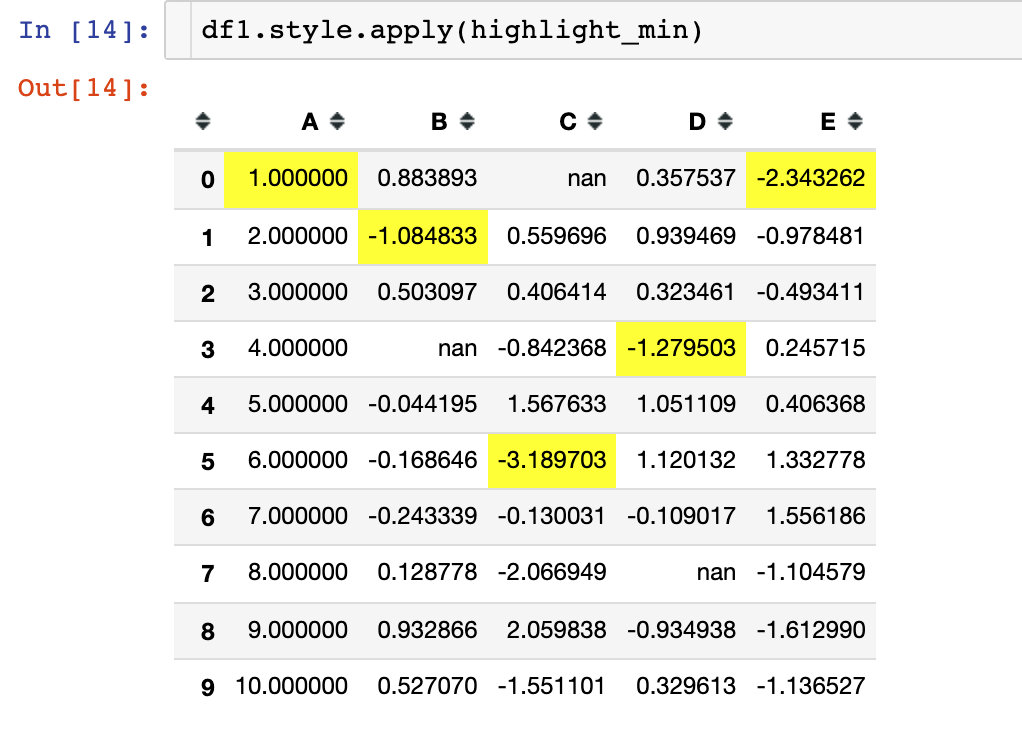
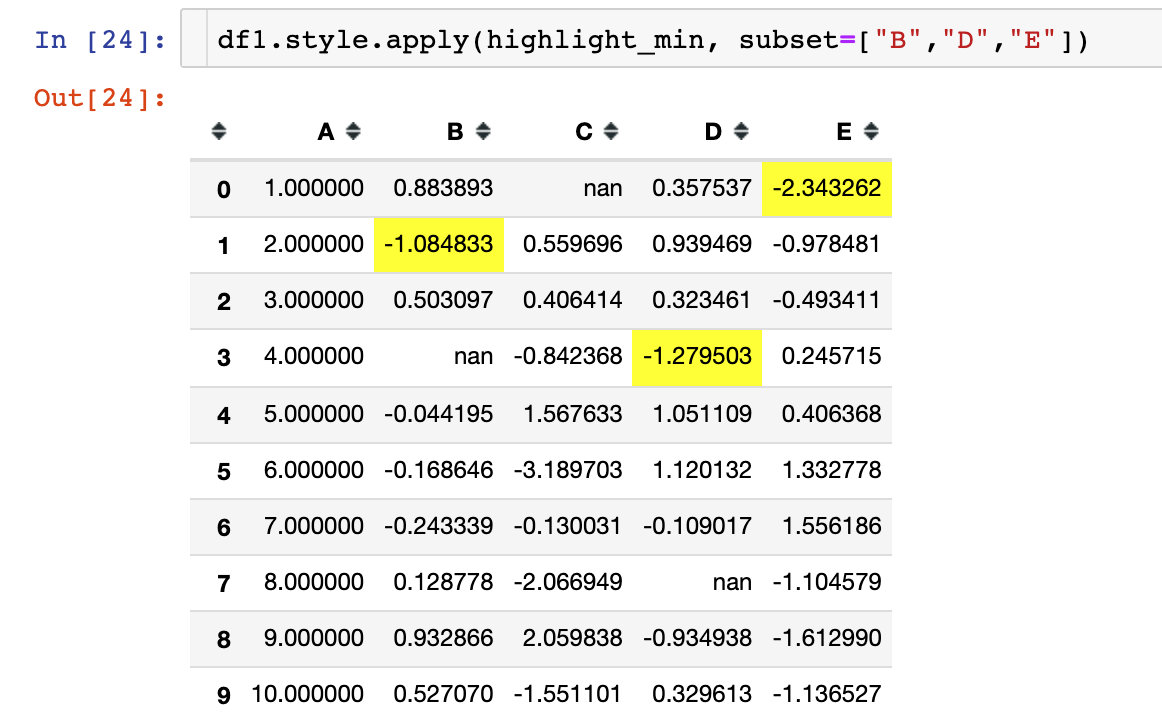
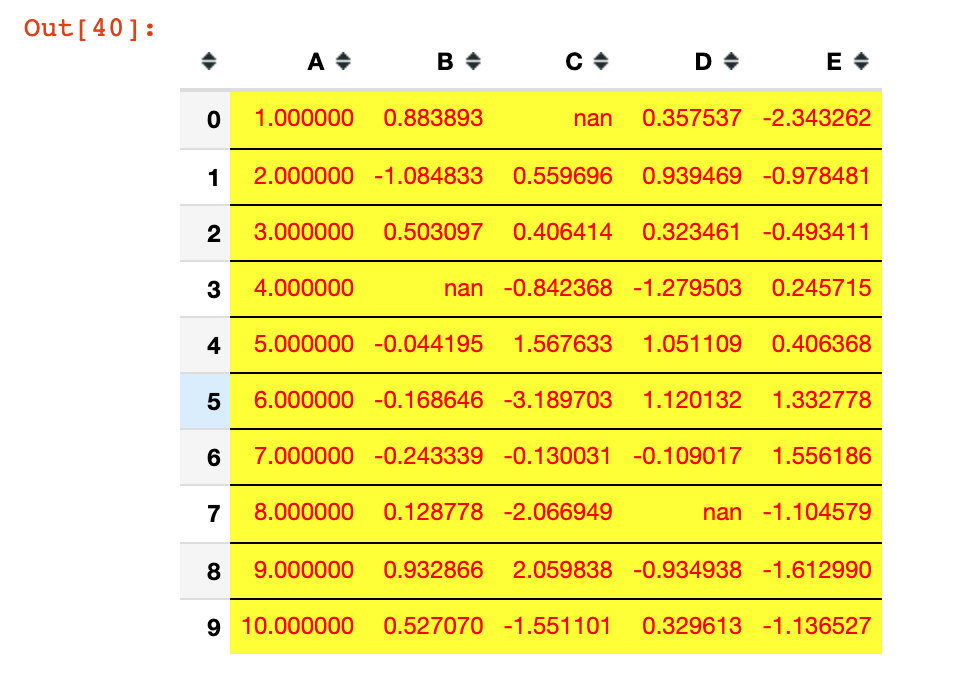
Case 2: highlight data
You can highlight the maximum, minimum, and missing values. Write a simple highlight function:
def highlight_min(x):
    is_min = x == x.min()
    return ["background-color: yellow" if v else '' for v in is_min]
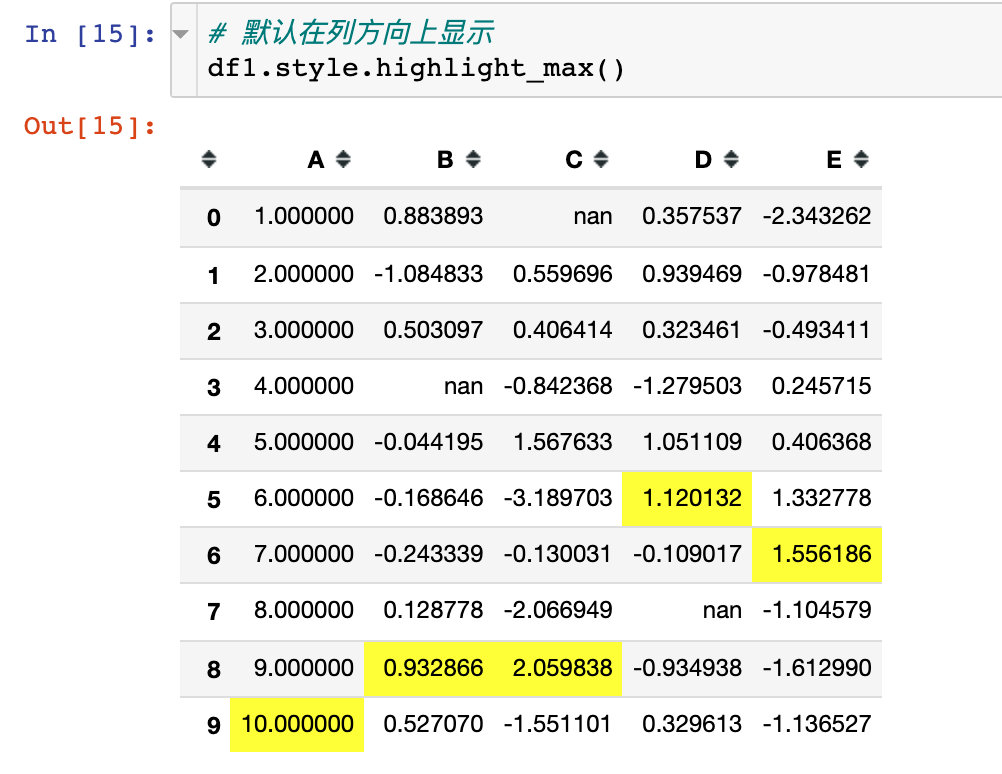
Example 3: use the default highlight function
Three built-in highlighting functions have been written in Pandas by default:
- highlight_max(): Max
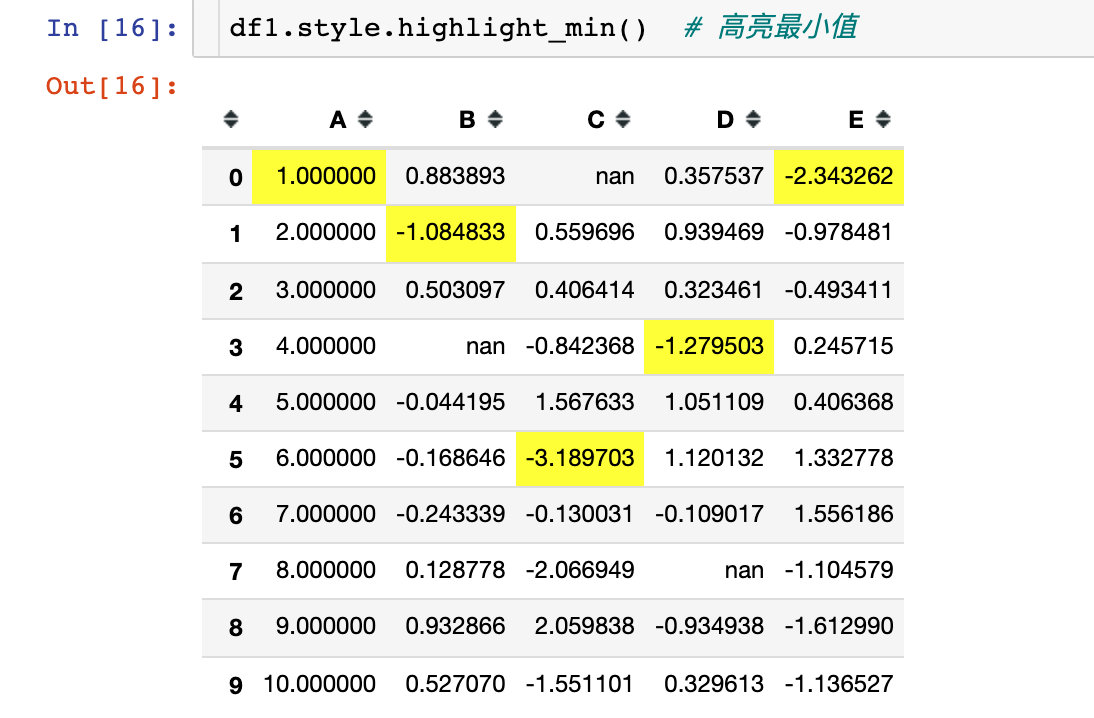
- highlight_min(): Min
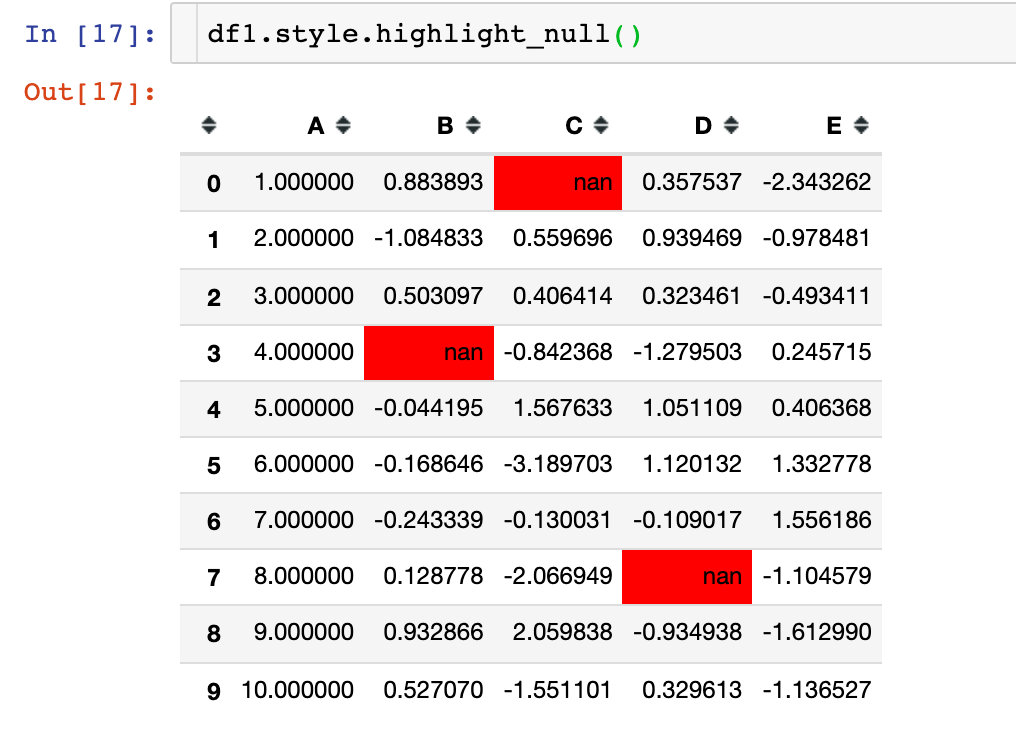
- highlight_null(): null value
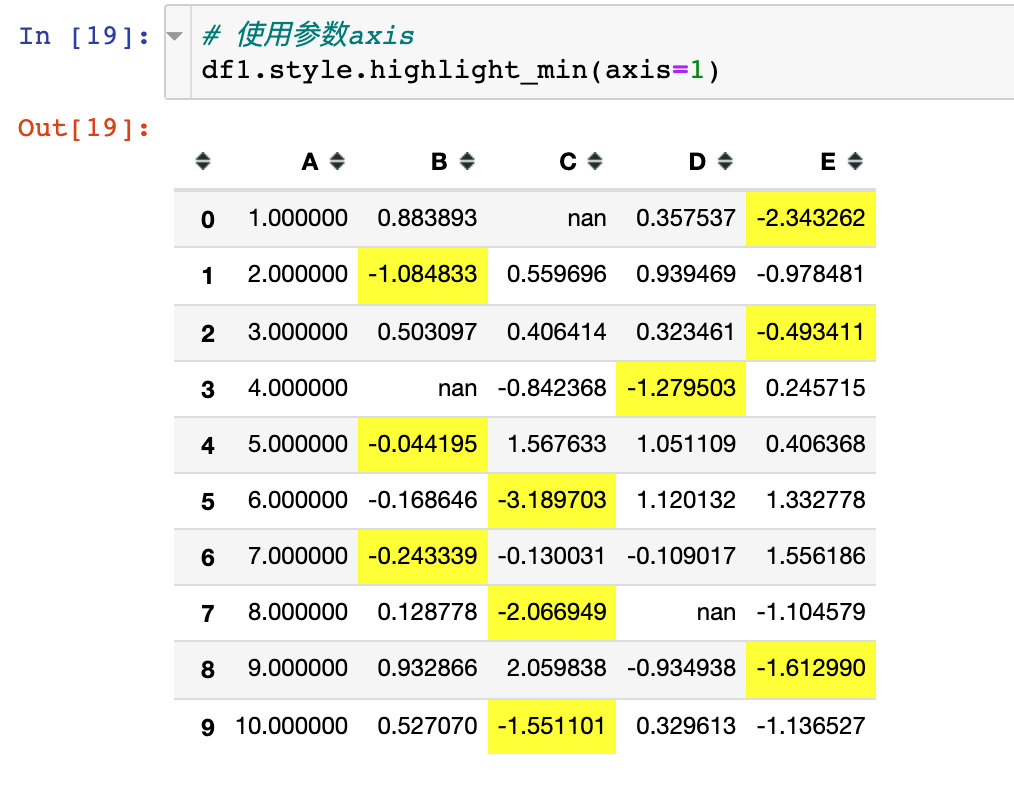
At the same time, we can also use the parameter axis to display rows or columns
1. Highlight Max
2. Highlight the minimum value for each column
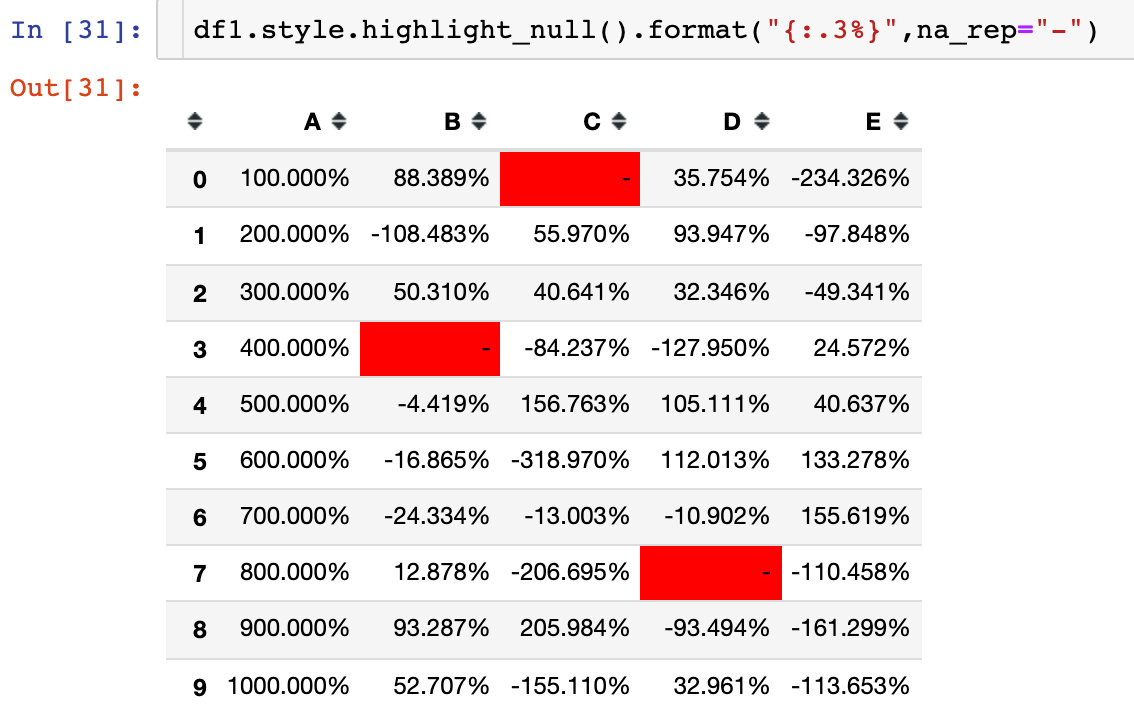
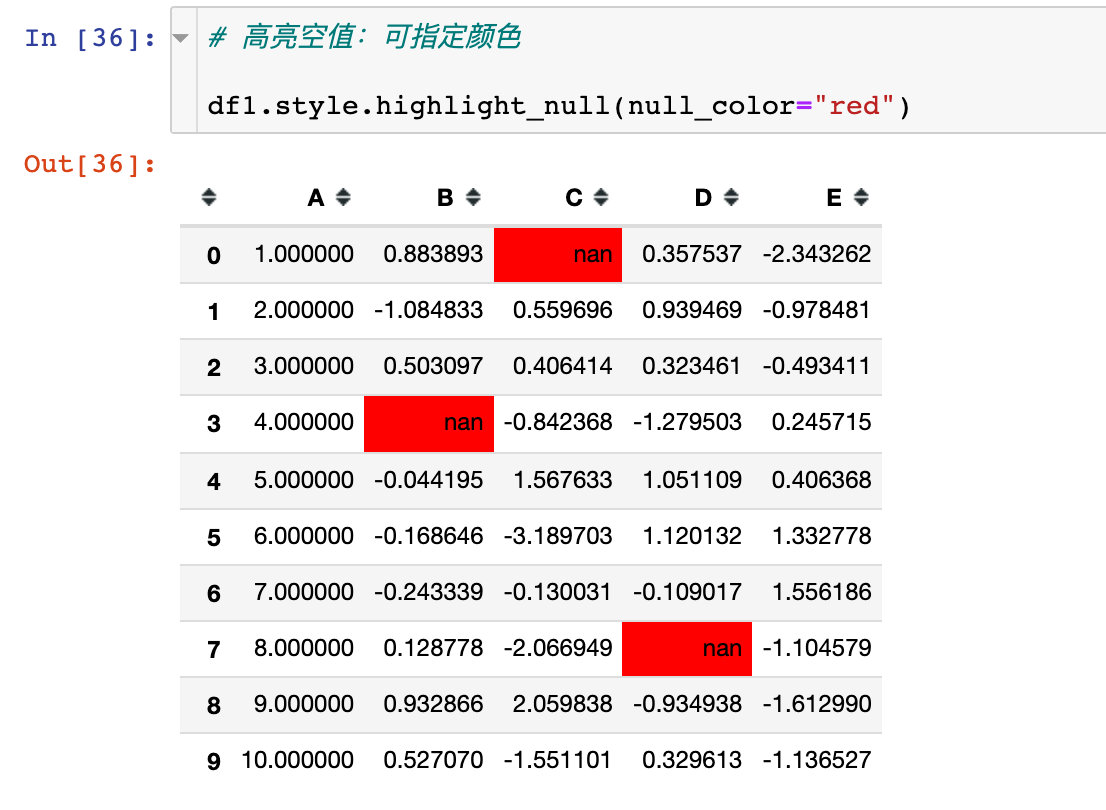
3. Highlight null: the default is red
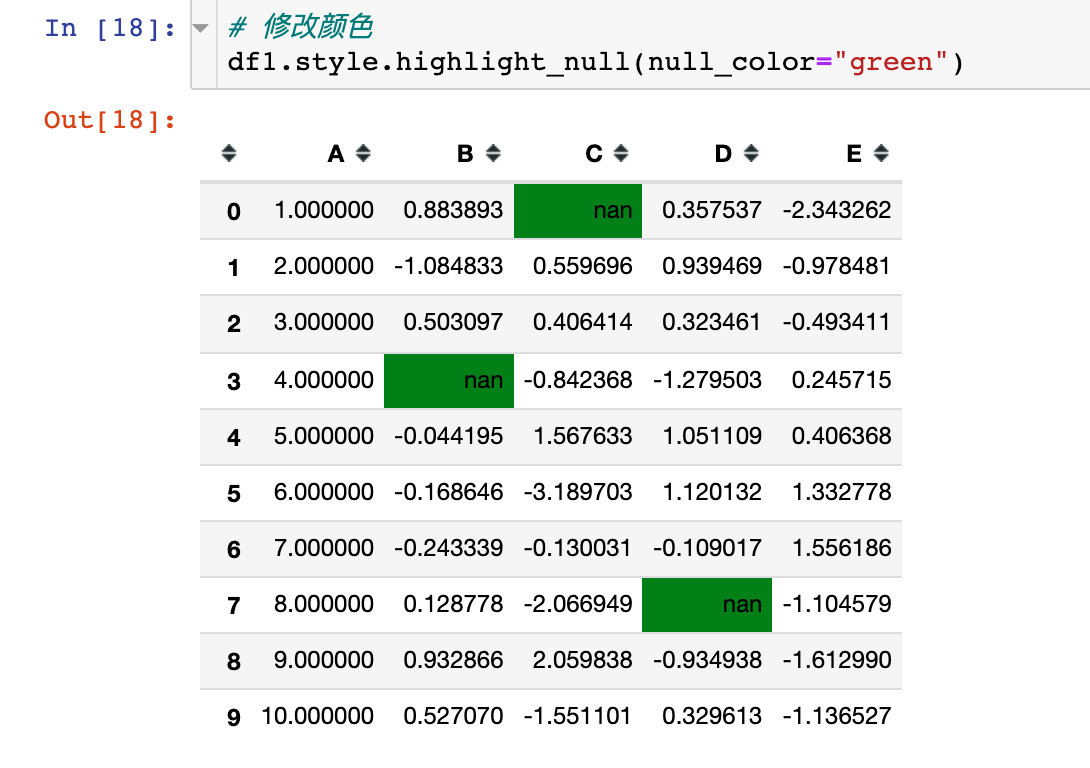
Of course, we can change the color by using the parameter null_color:
The parameter axis=1 indicates that the operation is performed in the direction of the row:
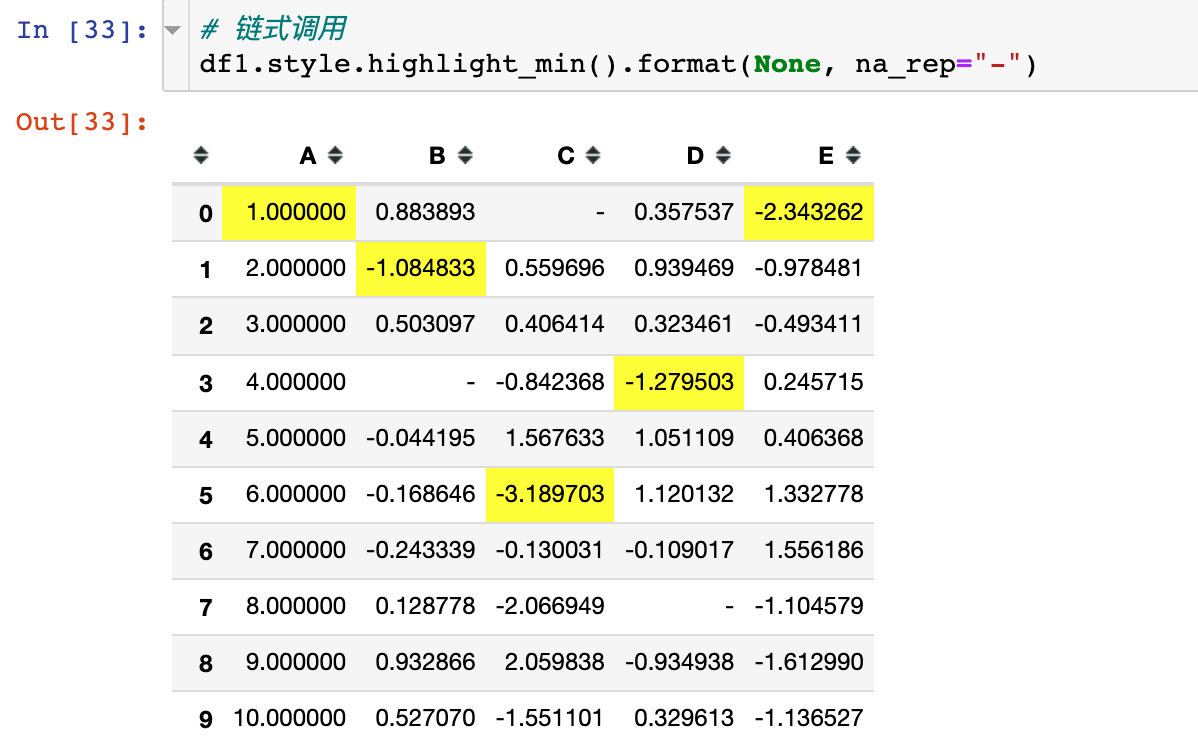
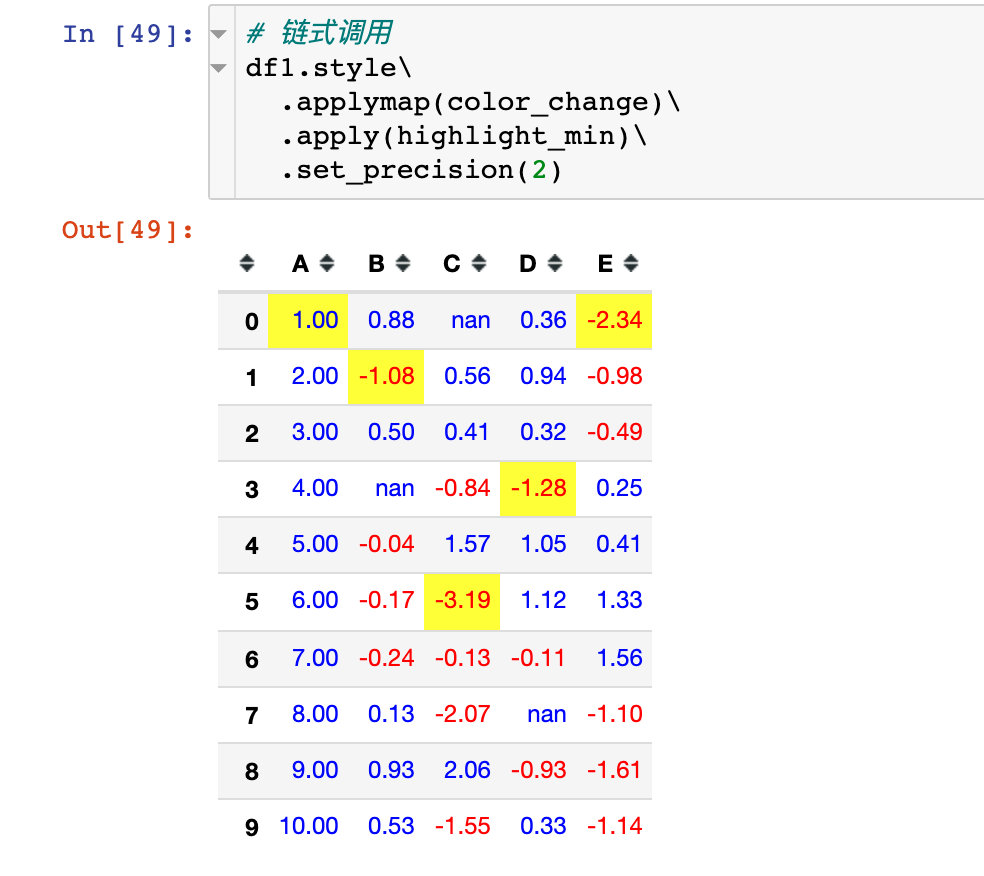
Case 4: chain call
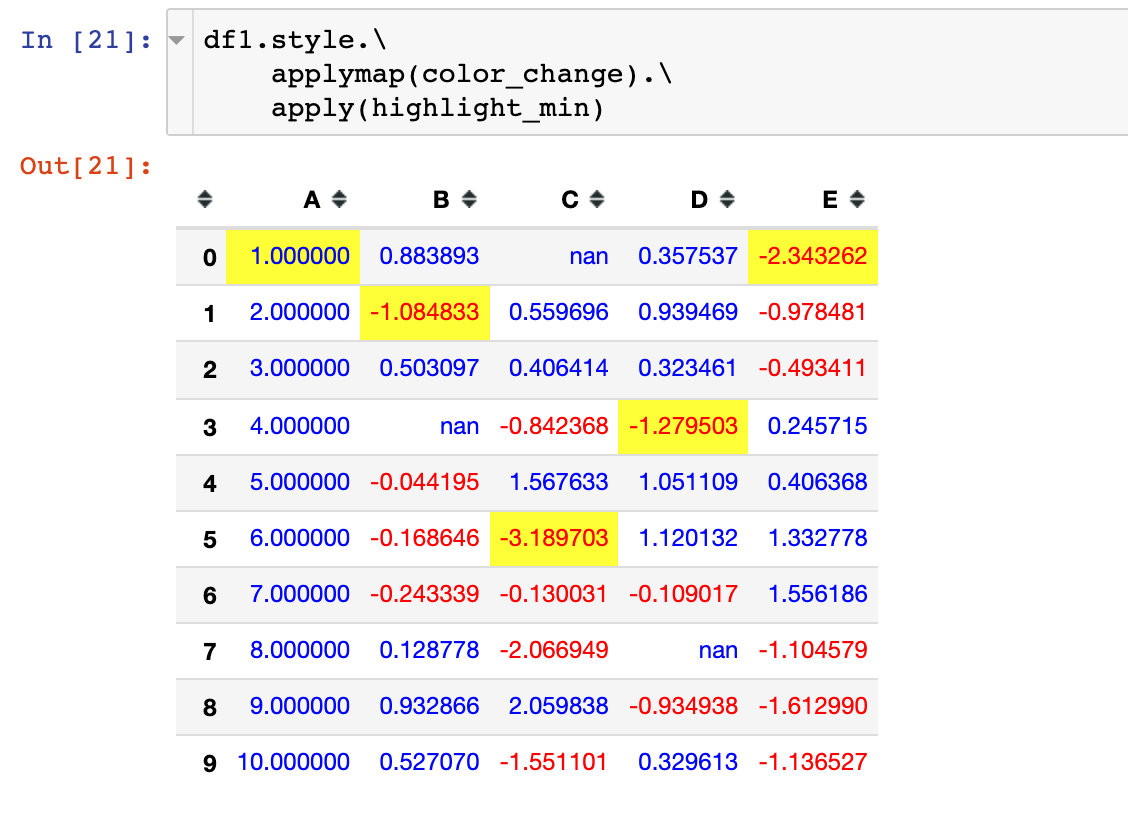
Chained call refers to the simultaneous use of multiple functions (Methods) in the same style operation:
# color_change + highlight_max
df1.style.applymap(color_change).apply(highlight_min)
If there are many methods, you can write them separately:
# color_change + highlight_max
df1.style.\
applymap(color_change).\
apply(highlight_min)

# Or: add a layer of parentheses outside to indicate that the whole code is a whole
(df1.style.
applymap(color_change).
apply(highlight_min))
Null value highlighting and changing color parameters are used at the same time to realize chain call:
Hide column properties and custom parameters at the same time:
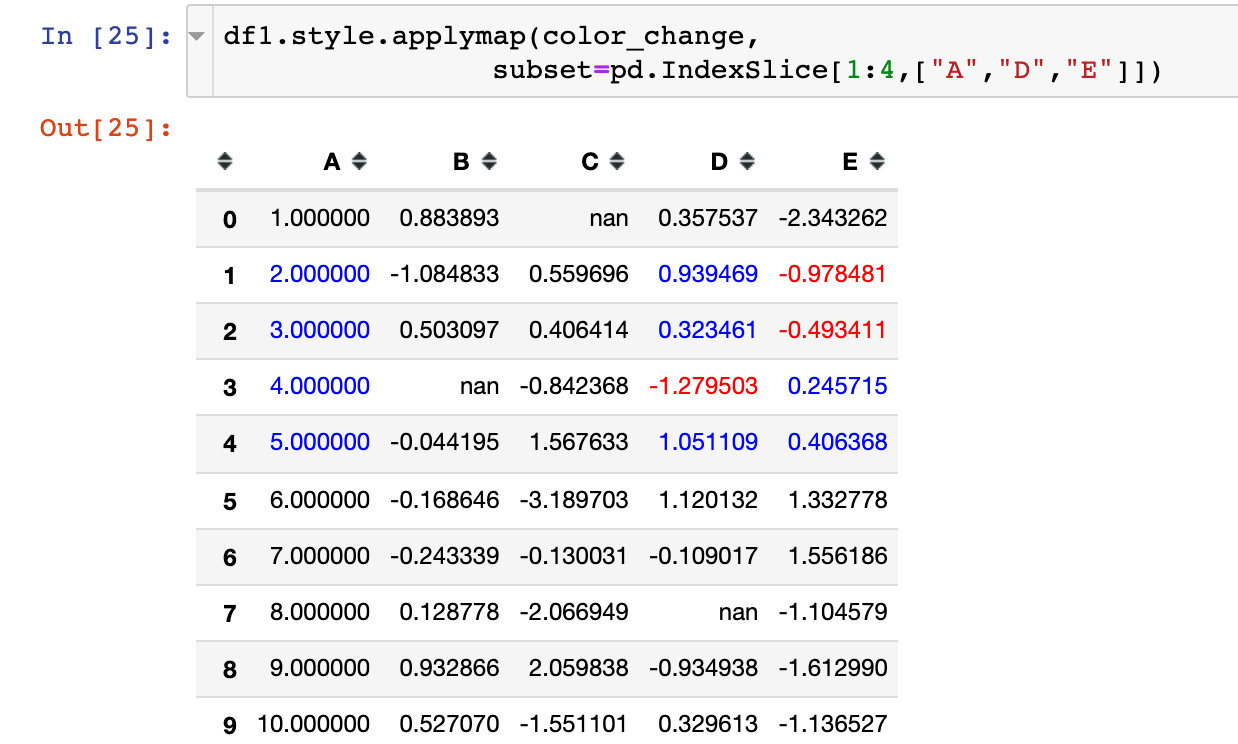
Example 5: partial data beautification
Use the parameter subset to control the rows and columns. The passed in parameters can be:
- Column label
- List (numpy array)
- Tuple (row_indexer, column_indexer)
Partial column properties
Specify the column properties we want to beautify through the parameter subset:
pd.IndexSlice construct list
Constructed by pd.IndexSlice
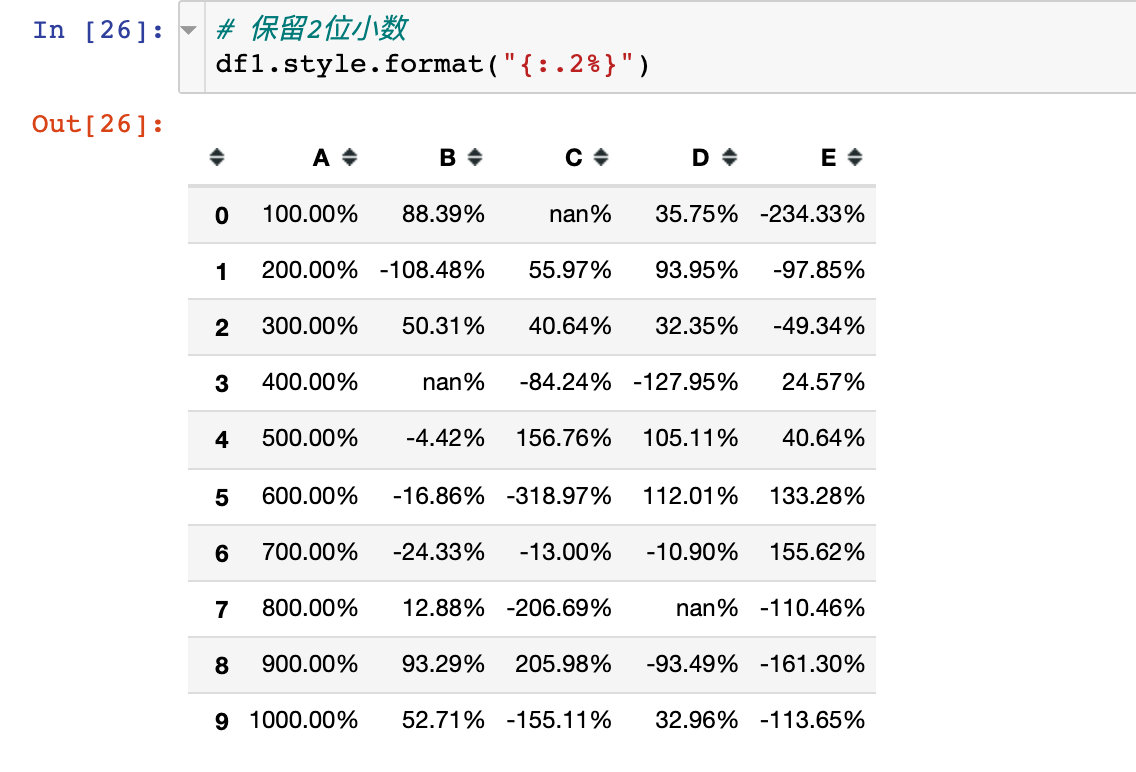
Example 6: formatted display of values (Styler.format)
Styler.format to control the formatted output of values, similar to string formatting in Python
Overall display
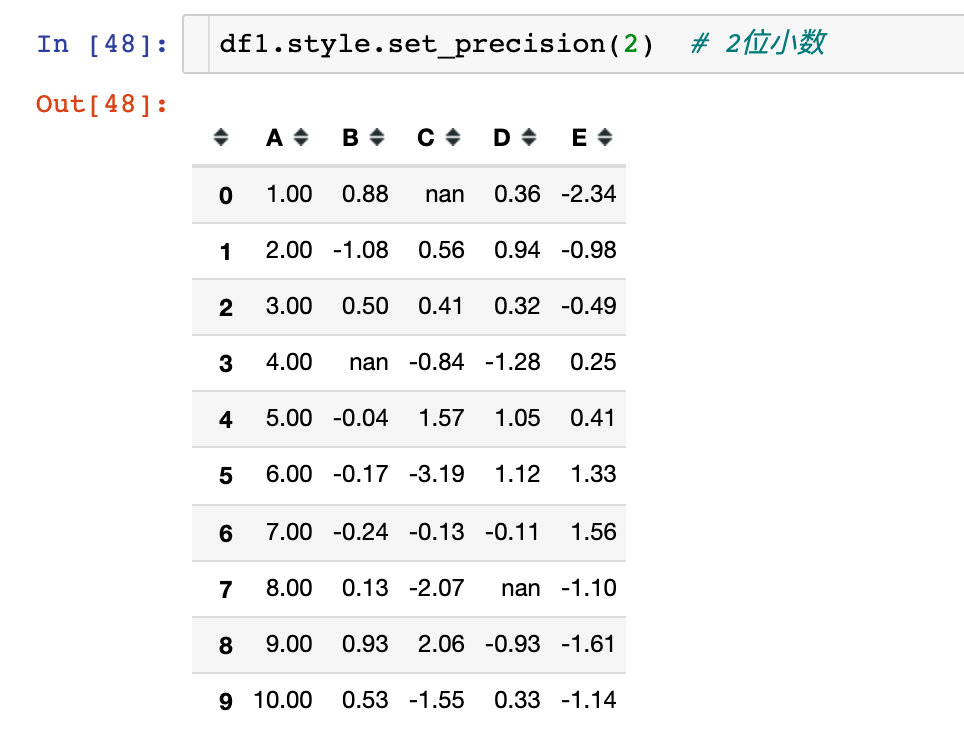
For example, we want all data to display only two decimal places:
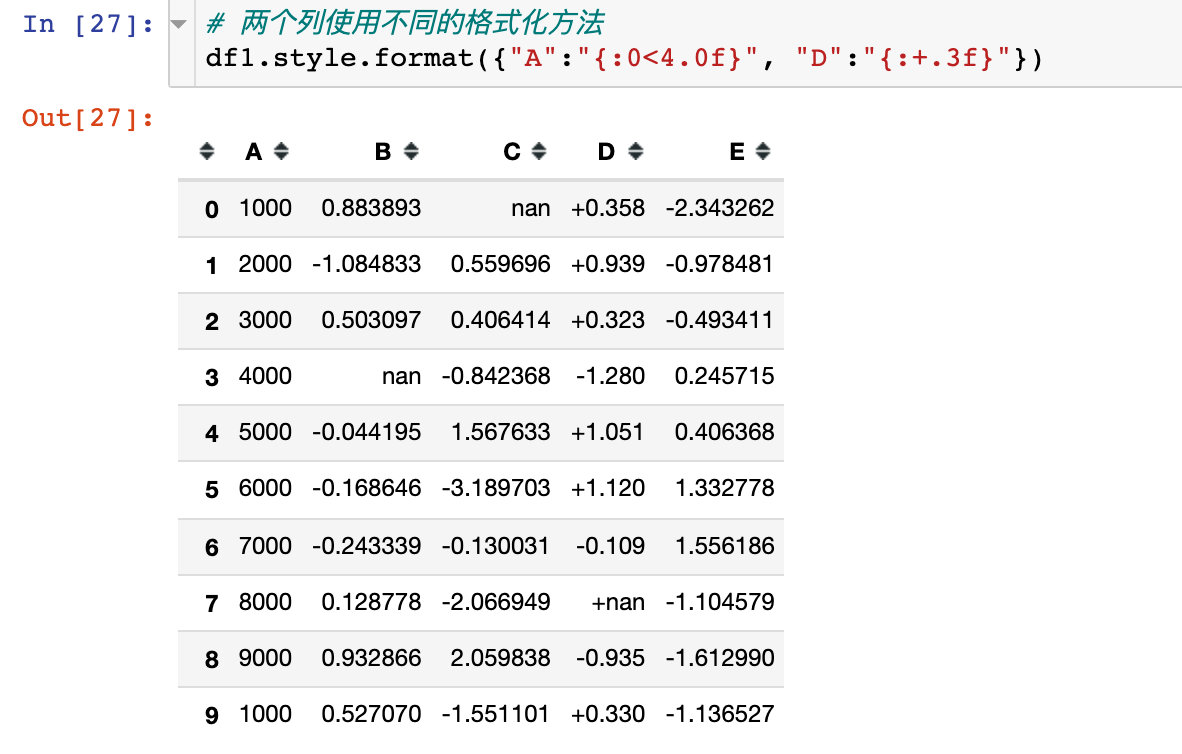
Use a dictionary to format specific columns
In the form of a dictionary, the column attribute name is used as a key and the format description is used as a value for formatting:
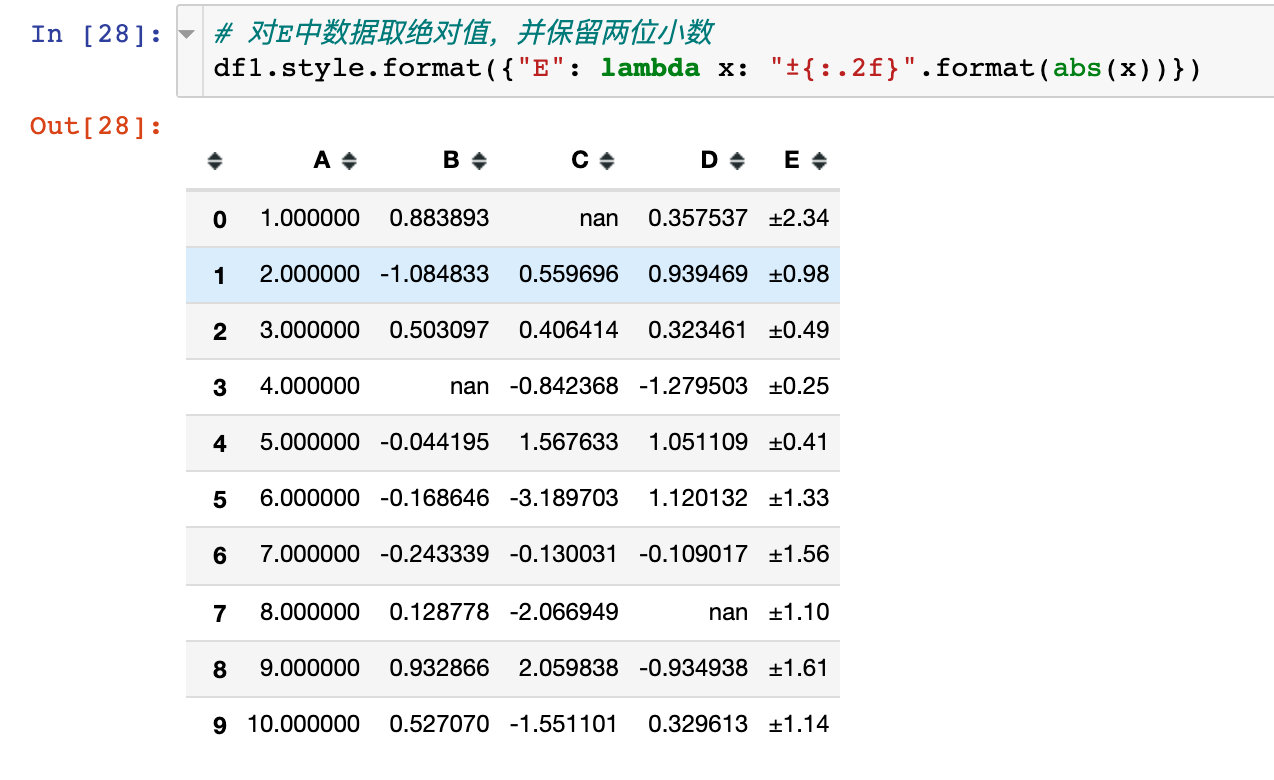
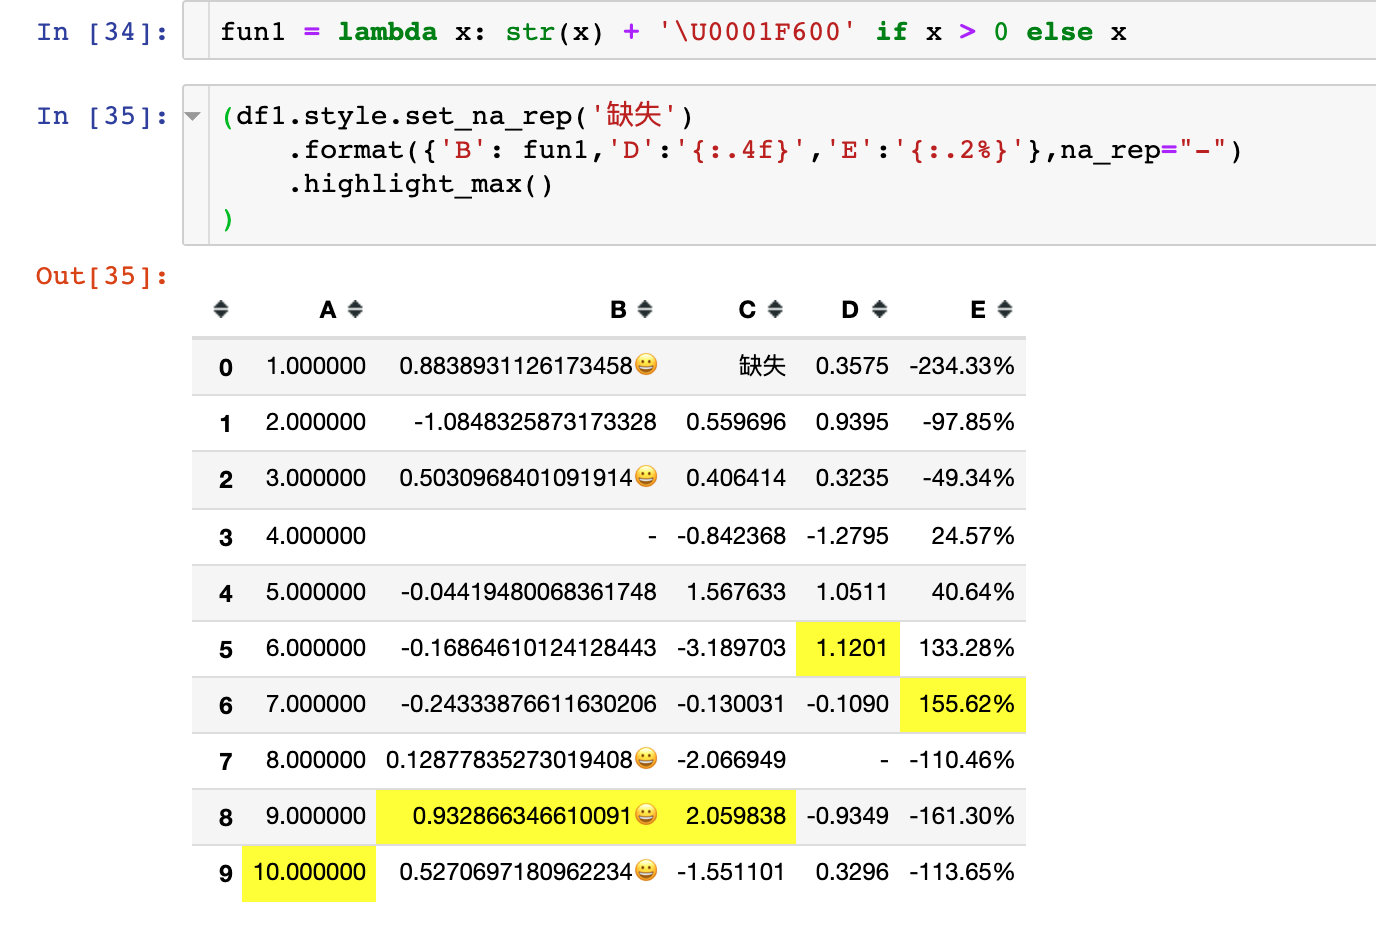
Using lambda anonymous functions
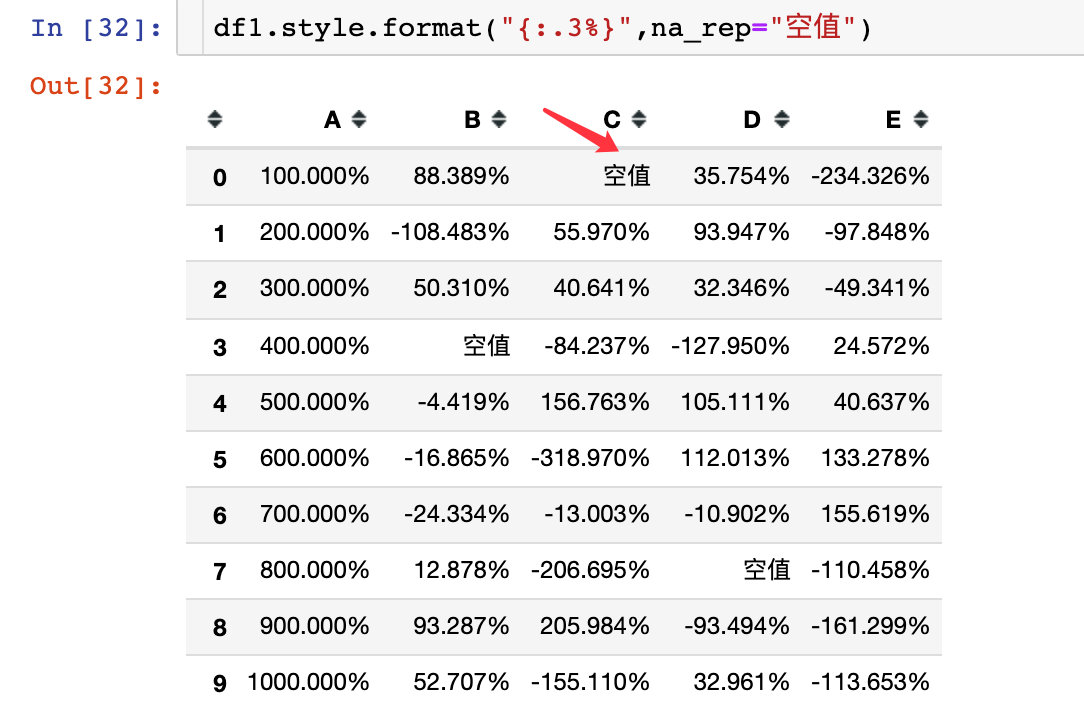
Null value display
By parameter na_rep, replace the null value:
Replace with "null value":
Chained calls also use "-" instead:
Emoticon
Use emoji Emoji emoticons:
Example 7: built in styles
Built in function
The built-in null highlighting function is used here:
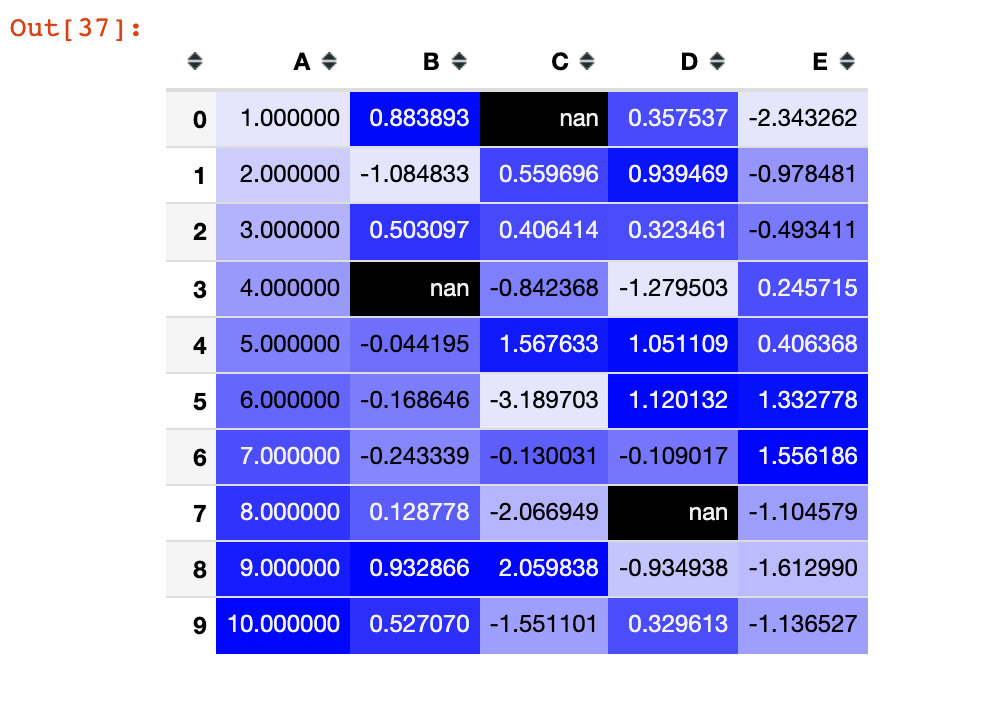
Thermal map making
We use seaborn library to realize:
import seaborn as sns

cm = sns.light_palette("blue", as_cmap=True)
s = df1.style.background_gradient(cmap=cm)
s
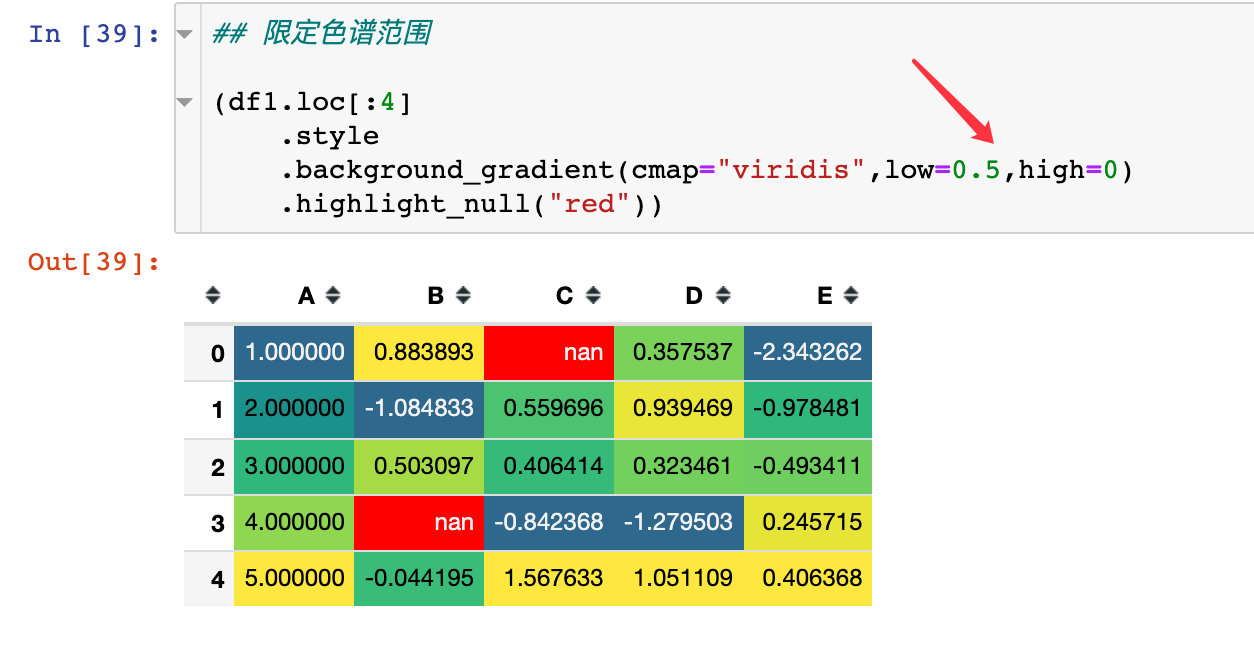
Continuous chromatography
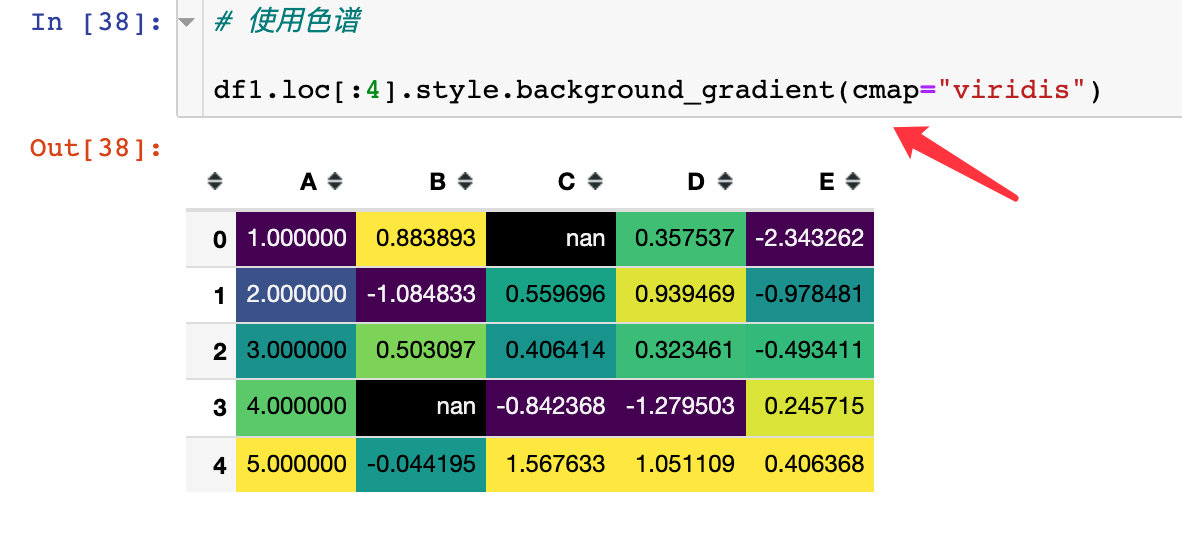
Specify the chromatographic range through the parameters low and high:
set_properties usage
### set_properties usage

df1.style.set_properties(**{"background":"yellow",  # Background color
                           "color":"red",  # typeface
                           "border-color":"black"})  # boundary
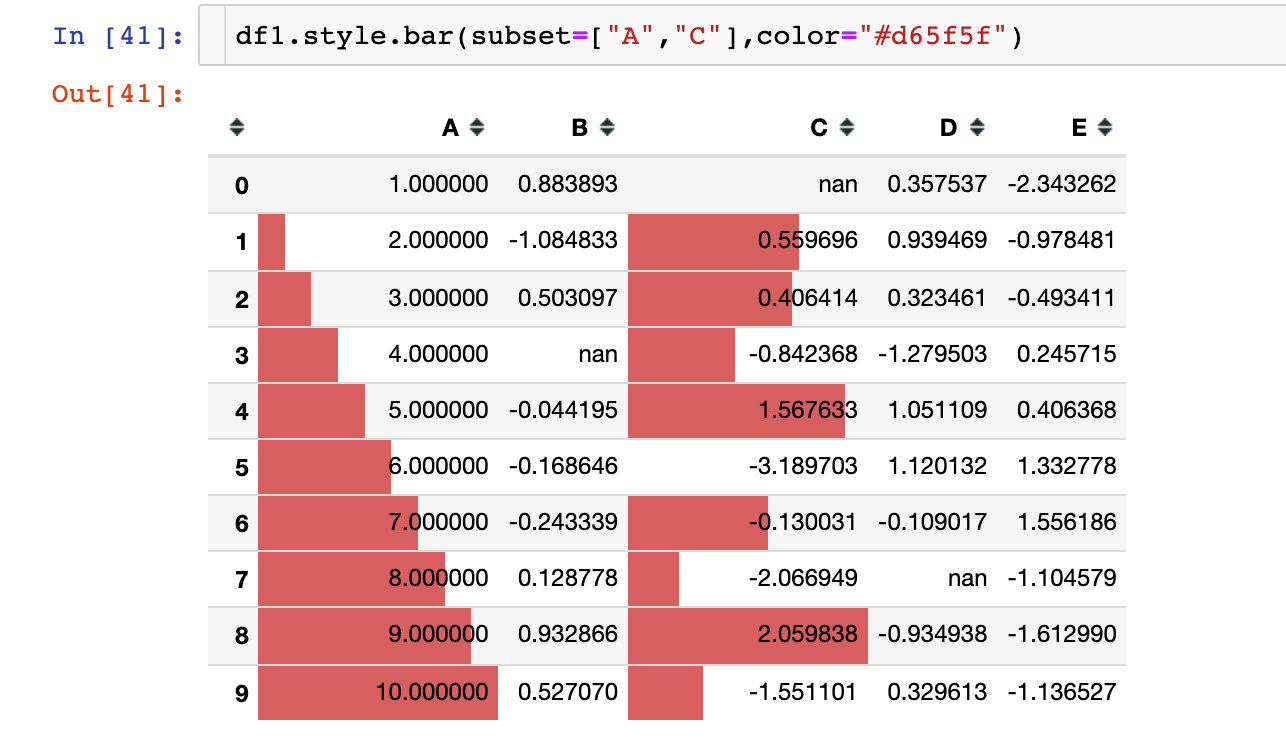
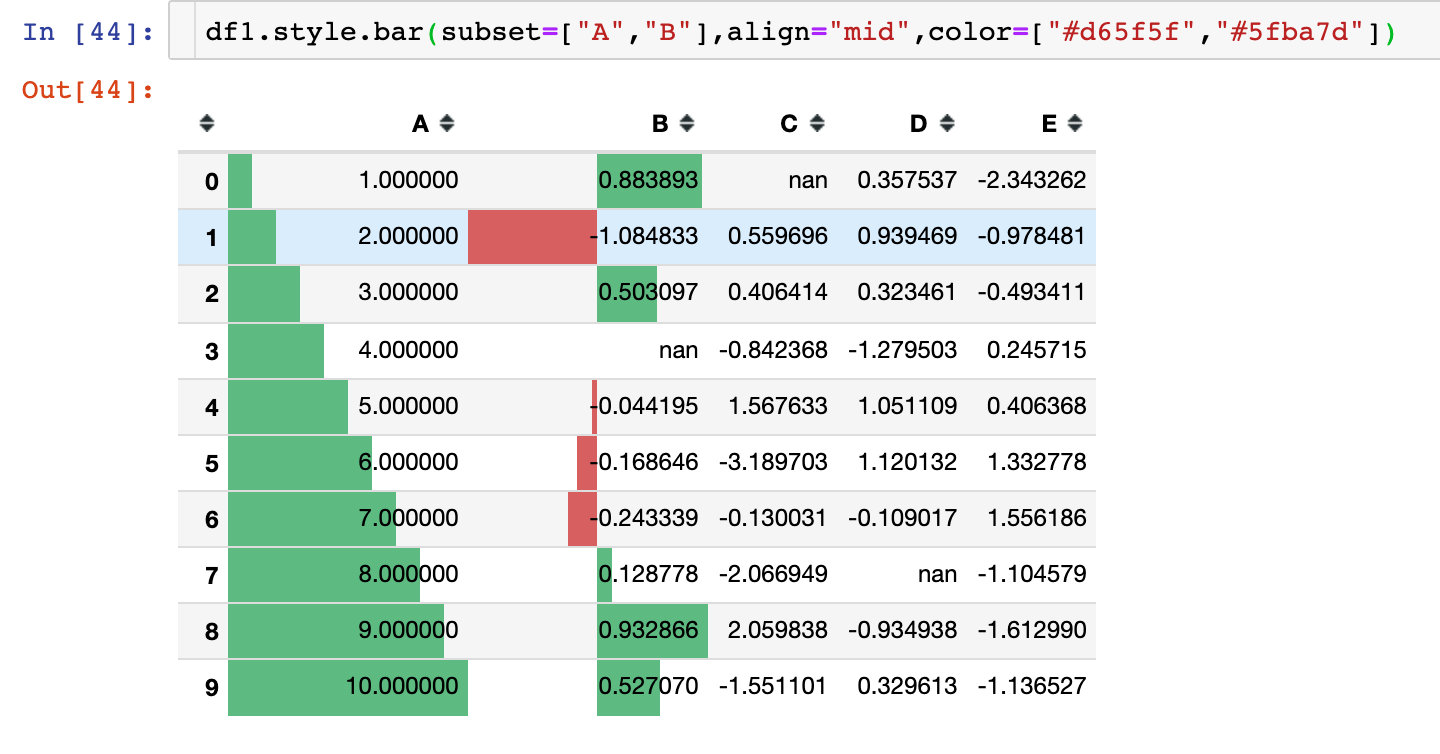
Example 8: personalized bar chart
Default mode
Operate by bar method:
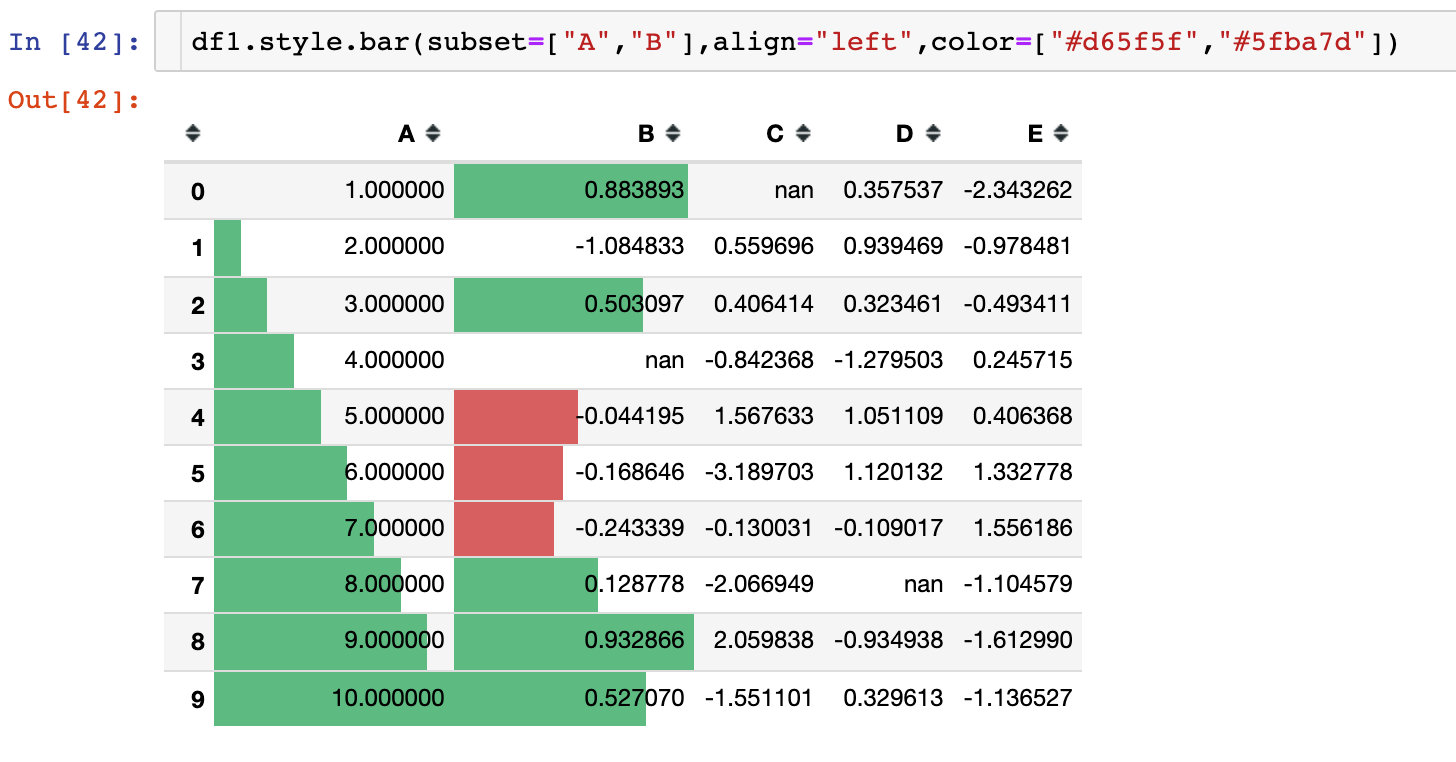
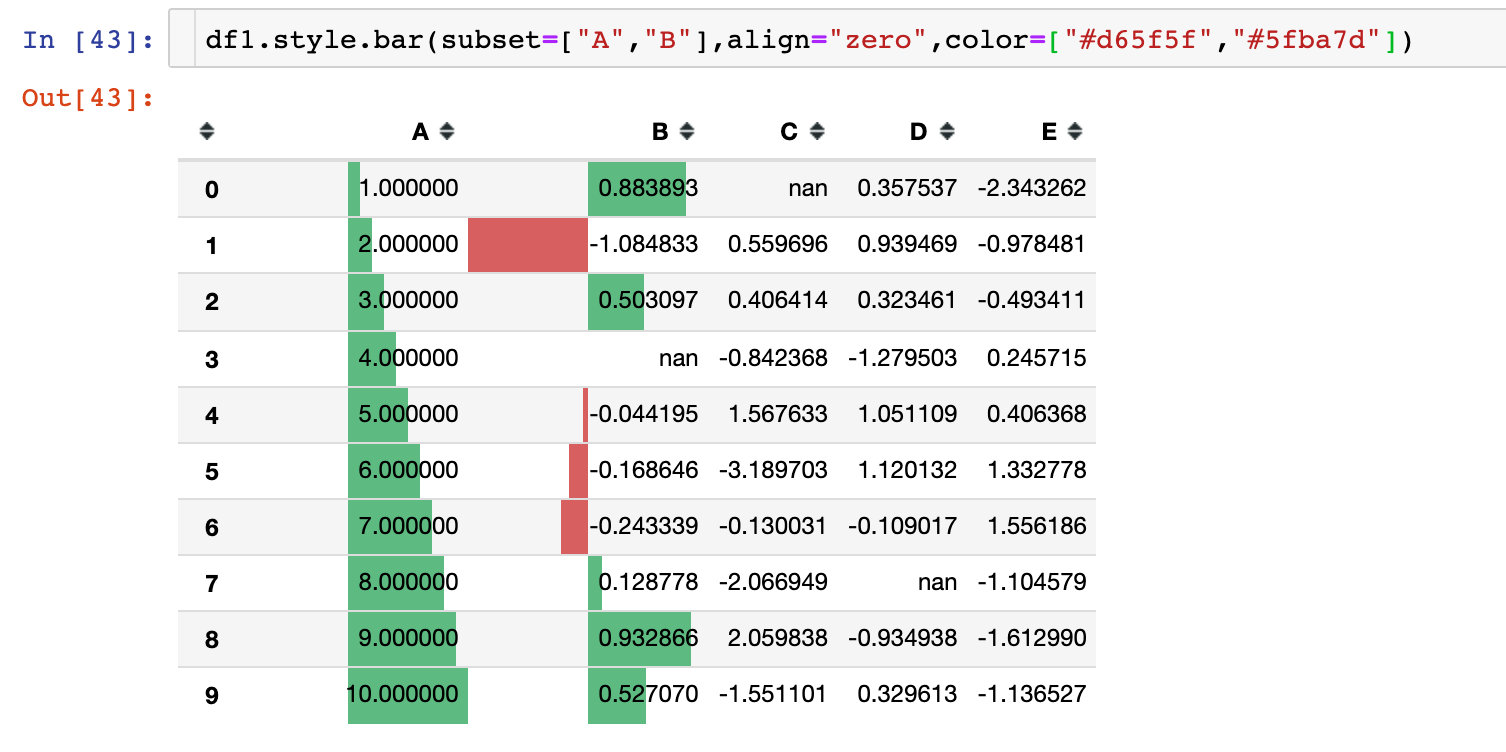
Parameter align
There are 3 alignments:
- Left: the minimum value starts from the left side of the cell
- Zero: the zero value is in the center of the cell
- mid: the center in the cell is at (max min) / 2
Example 9: style sharing
Suppose we create a style in a DataFrame and want to use it directly in another DataFrame, what should we do?
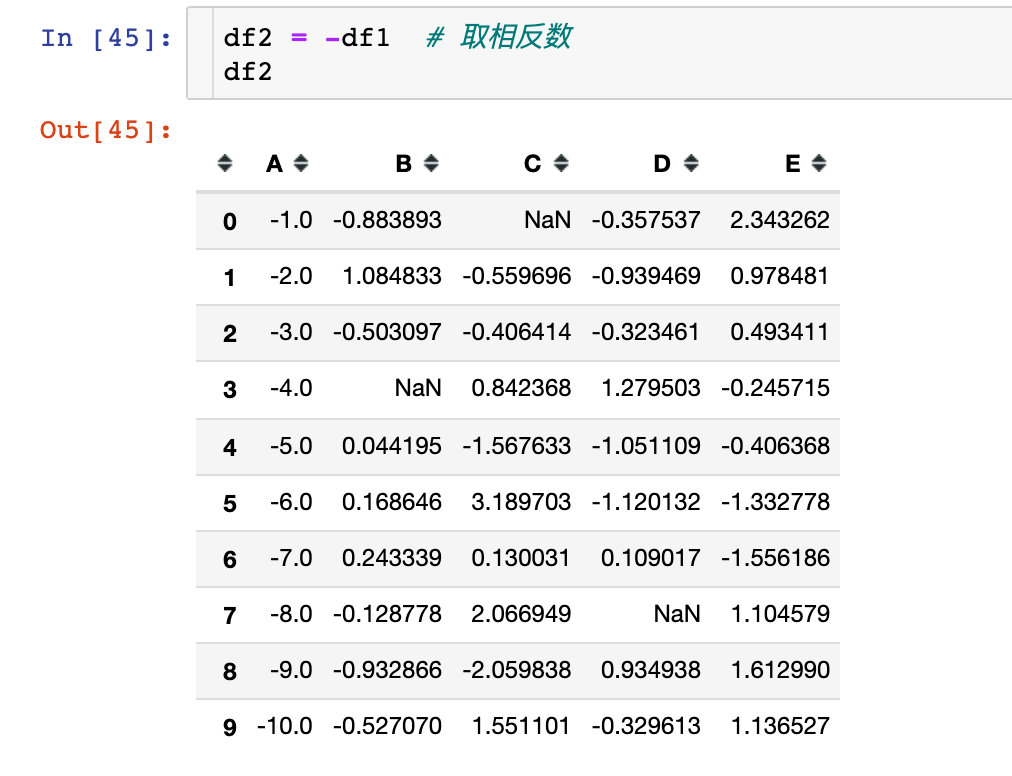
Let's create a style style1 first:
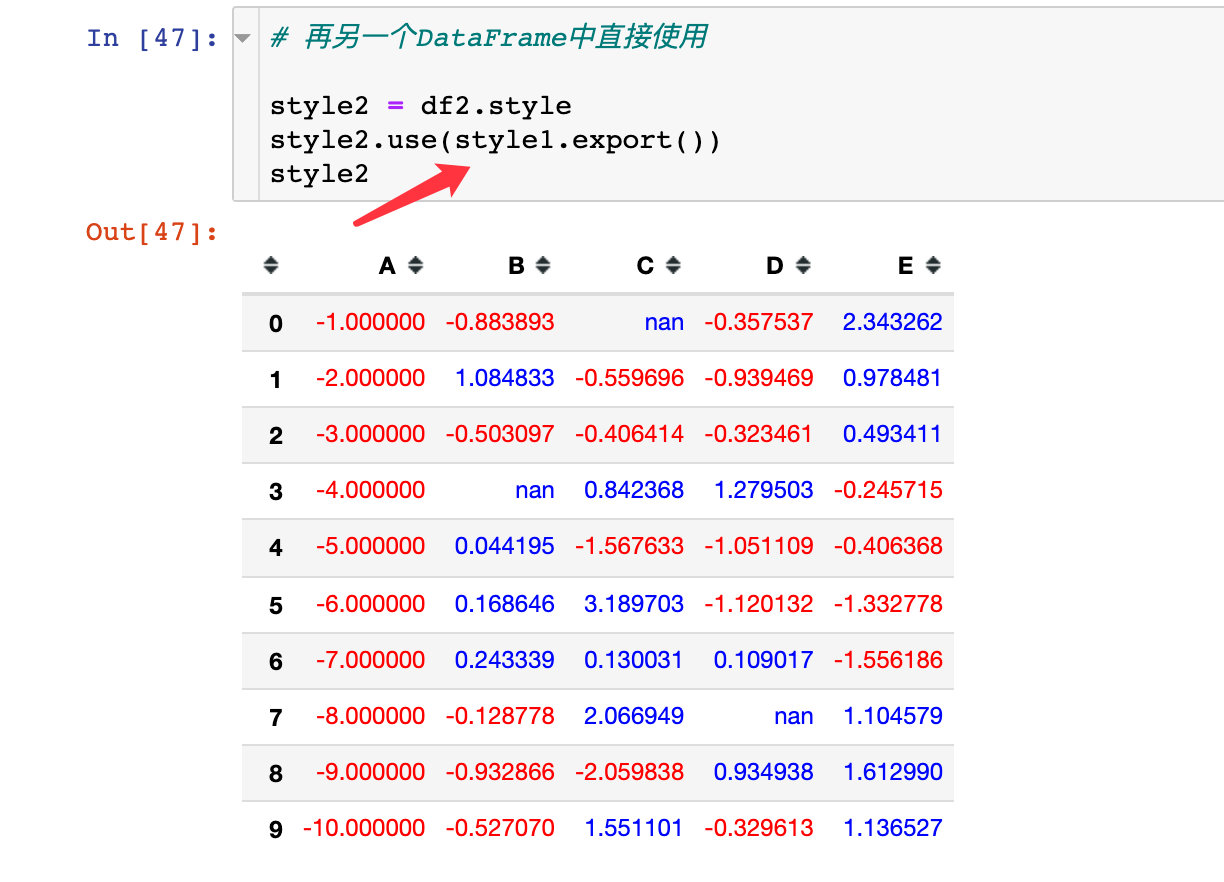
Apply style1 to style2:
Example 10: set_precision
Usually, the precision (decimal places) is specified for the data in the data frame:
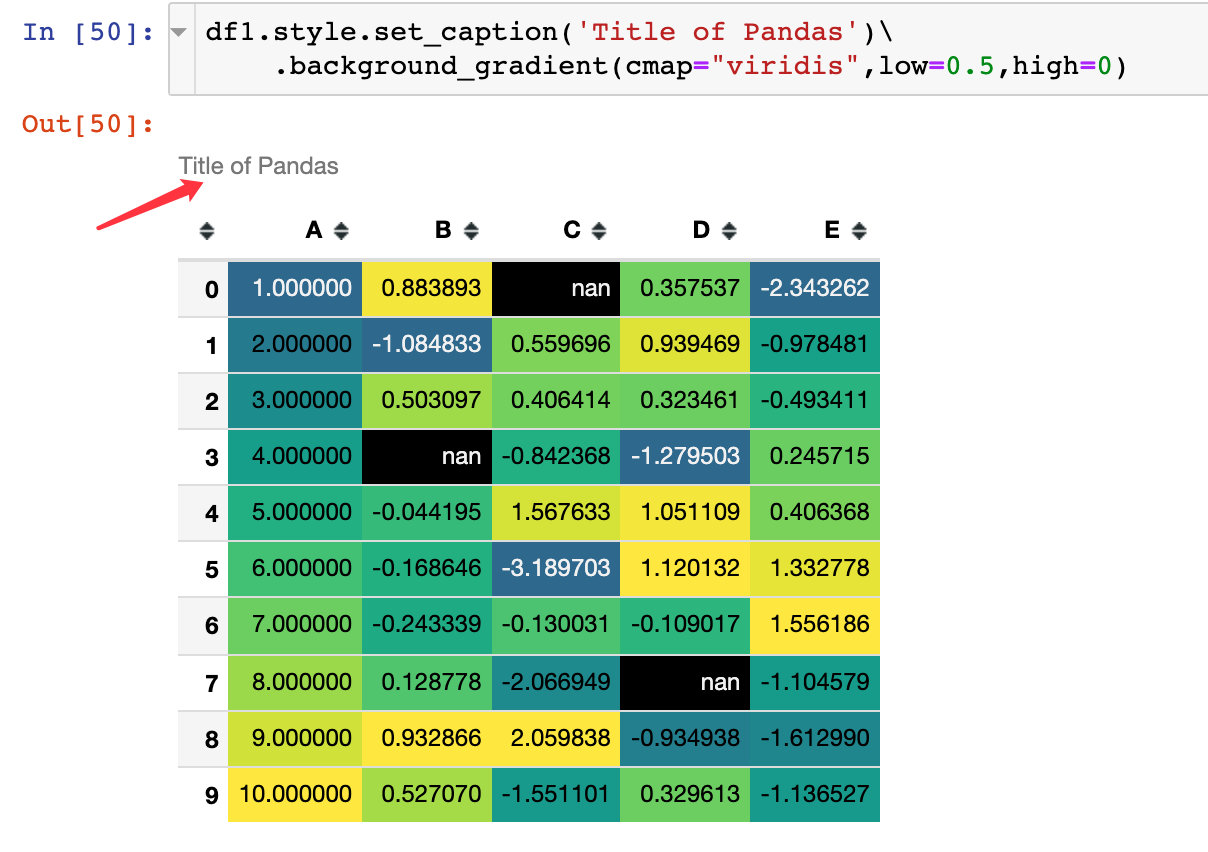
Example 11: set title
Using the set_caption method
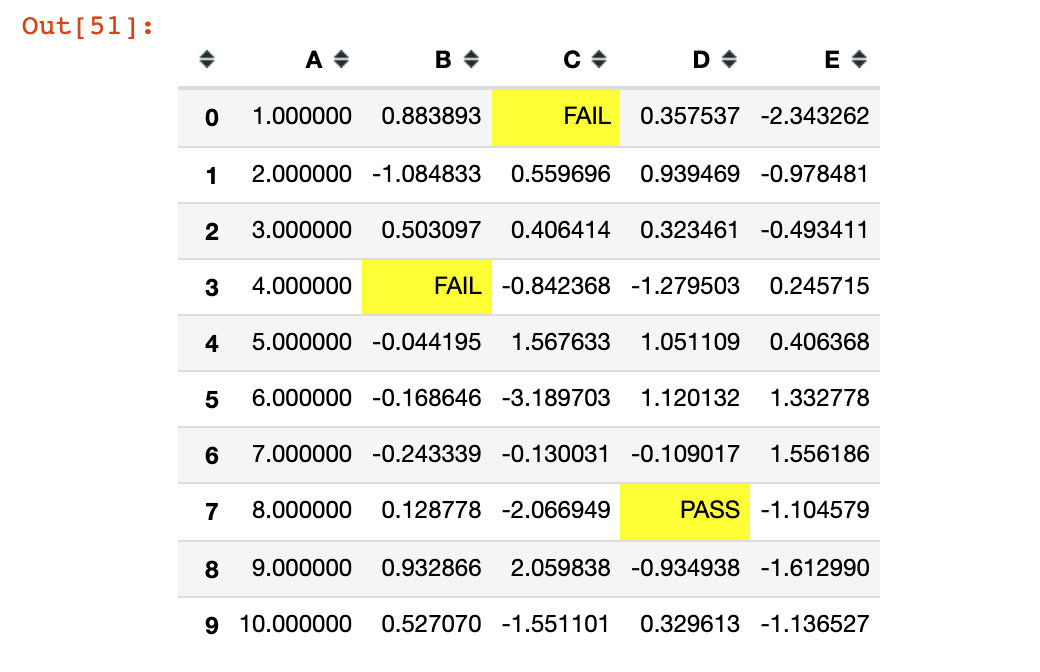
Missing value setting
The set_na_rep function is used:
(df1.style.set_na_rep("FAIL")
    .format(None, na_rep="PASS", subset=["D"])
    .highlight_null("yellow"))
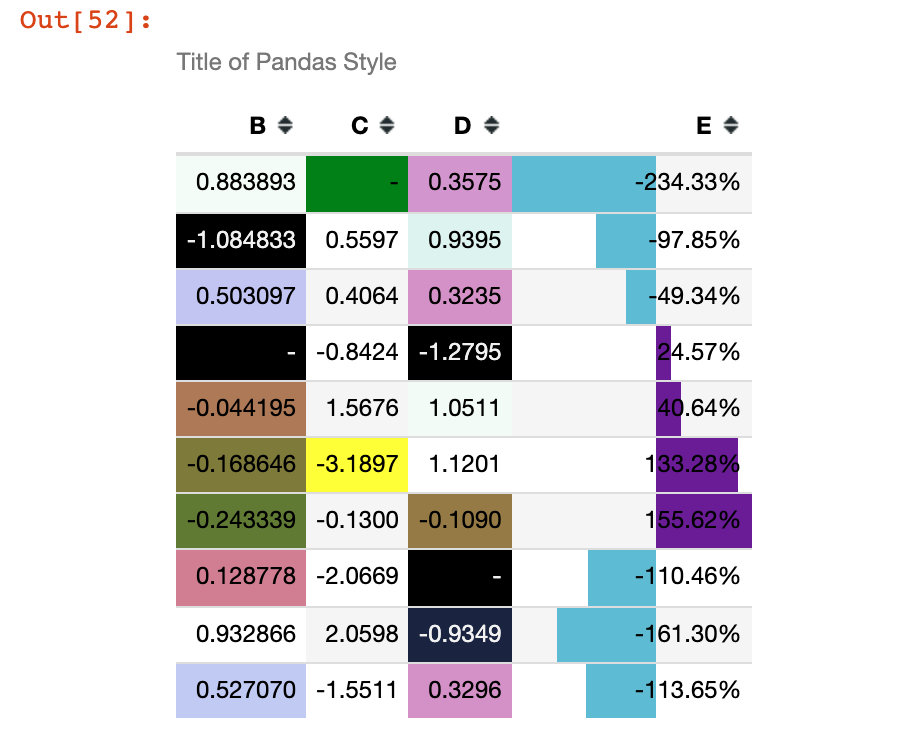
Example 13: comprehensive case
(df1.style
  .set_na_rep('-')  # Set null value
  .format({'C':'{:.4f}',  # Precision setting
           'D':'{:.4f}',
           'E':'{:.2%}'},na_rep="-")  # Precision and null values are set at the same time
  .highlight_null("green")  # Null highlight
  .applymap(color_change,subset=['D'])  # Column D uses the color_change function
  .apply(highlight_min,subset=['C'])  # Column C uses highlight_min
  .background_gradient(cmap='cubehelix',subset=['B','D'])  # Background color settings
  .bar(subset=['E'], align='mid', color=['#60BCD4','#6A1B9A'])  # Histogram setting
  .set_caption("Title of Pandas Style")  # Title Setting
  .hide_index()  # Hide index
  .hide_columns(subset=['A']))  # Hide column A
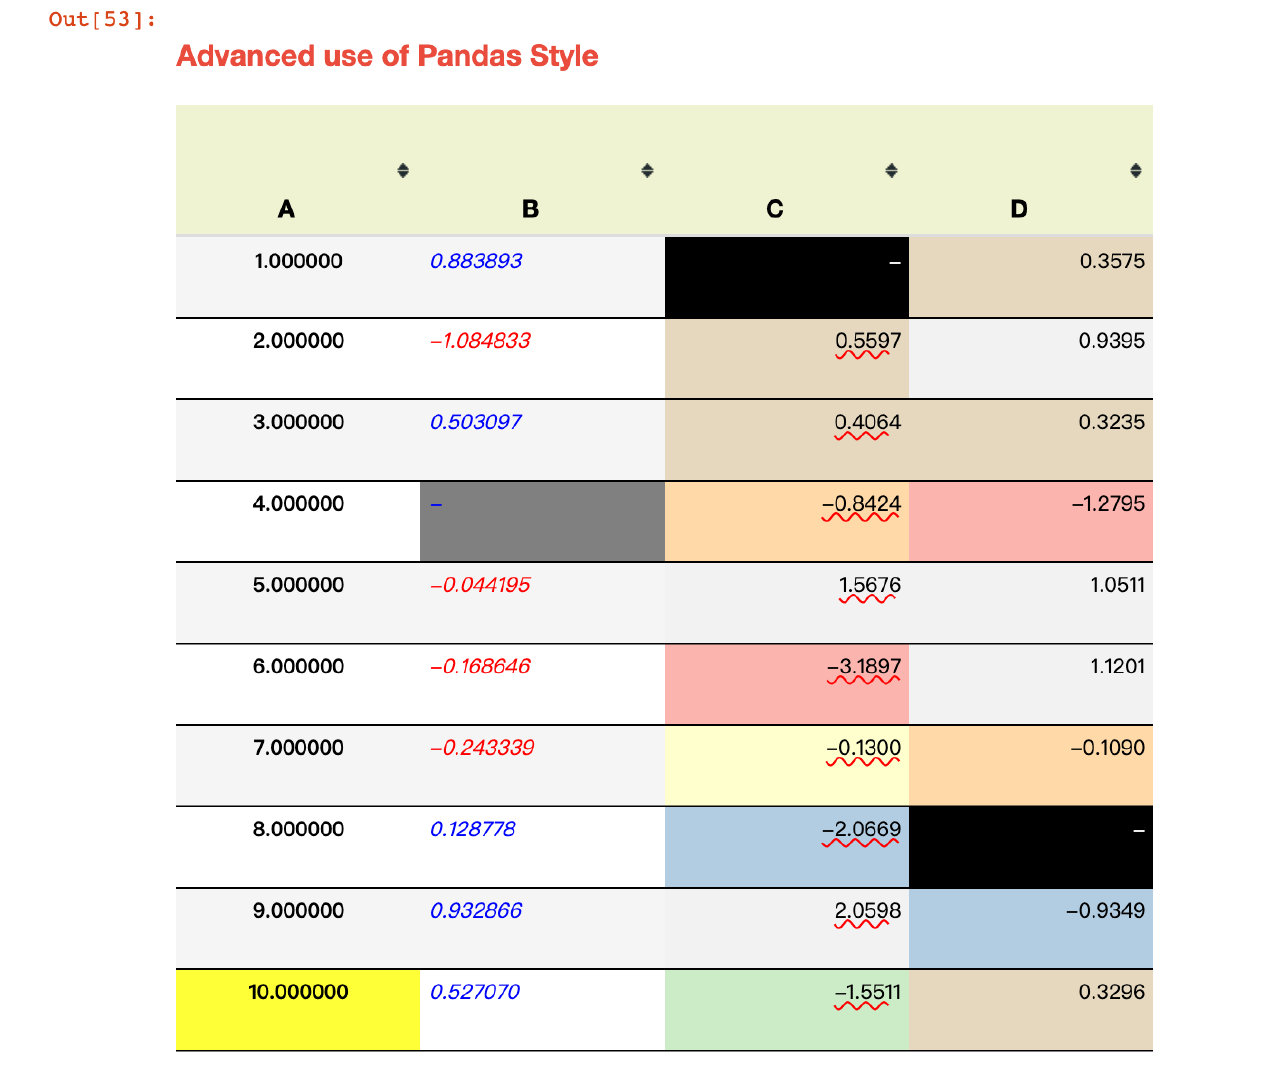
Example 14: Ultimate Weapon
# Version requires at least pandas 1.2.0
style1 = [
    dict(selector="th", props=[("font-size", "125%"),
                               ("text-align", "center"),
                               ("background-color", "#F0F3CF"),
                               ('width',"100px"),
                               ('height','80px')]),

    dict(selector="td", props=[("font-size", "105%"),
                               ("text-align", "right"),
                               ('width',"150px"),
                               ('height','50px')]),

    dict(selector="caption", props=[("caption-side", "top"),
                                    ("font-size","150%"),
                                    ("font-weight","bold"),
                                    ("text-align", "left"),
                                    ('height','50px'),
                                    ('color','#E74C3C')])]

style2 = {
    'A': [dict(selector='td', props=[('text-align','center'),
                                     ("font-weight","bold"),
                                     ("text-transform","capitalize")])],
    'B': [dict(selector='td', props=[('text-align','left'),
                                     ("font-style","italic")])],
    'C': [dict(selector='td', props=[('text-decoration','underline'),
                                     ('text-decoration-color','red'),
                                     ('text-decoration-style','wavy')])]}
# Chain call various setting methods
(df1.style
  .set_na_rep('-')  # Global null value
  .format({'C':'{:.4f}','D':'{:.4f}','E':'{:.2%}'},na_rep="-")  # accuracy
  .highlight_null("gray")  # Highlight null
  .applymap(color_change,subset=['B']).highlight_max(subset=['A'])  # color_change function and maximum highlight
  .background_gradient(cmap='Pastel1',subset=['C','D'])  #  background
  .bar(subset=['E'], align='mid', color=['#90BCD4','#6A1B9A'])  # Columnar
  .set_caption("Advanced use of Pandas Style")  # title
 	.hide_index()  # Hide index
  .hide_columns(subset=['E'])  # Hide column E
  .set_table_styles(style1).set_table_styles(style2,overwrite=False)  # Style transfer
  .set_properties(**{'font-family': 'Microsoft Yahei','border-collapse': 'collapse',  # Property settings
                     'border-top': '1px solid black','border-bottom': '1px solid black'}))
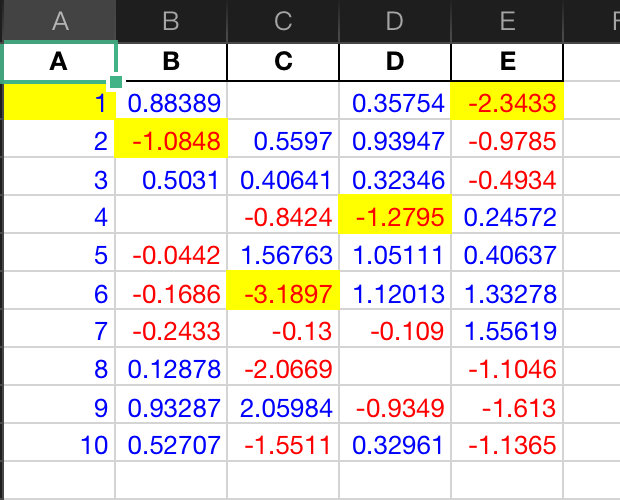
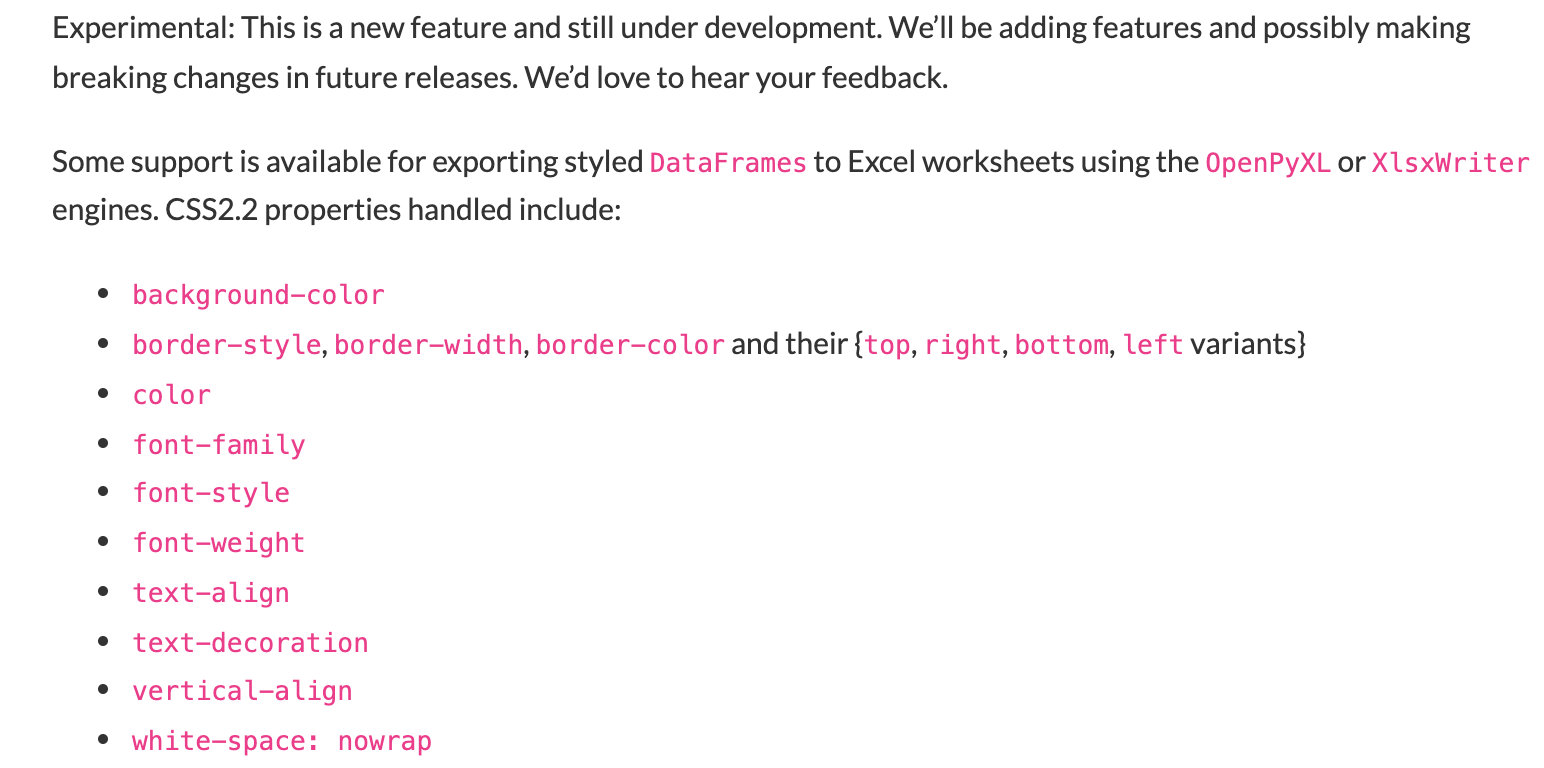
Export to Excel
This is a function that is still in the development stage. It uses openyxl or xlswriter as the engine to export the DataFrame to Excel. The official website says:
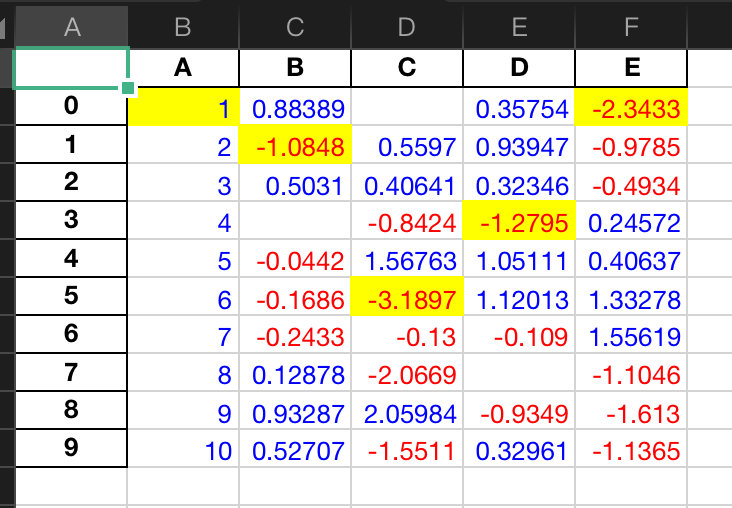
Here is a simple case:
(df1.style
   .applymap(color_change)  # Positive and negative change color
   .apply(highlight_min)  # Highlight minimum
   .to_excel('styled.xlsx', engine='openpyxl'))
If we don't want index numbers, add index=False:
(df1.style
   .applymap(color_change)  # Positive and negative change color
   .apply(highlight_min)  # Highlight minimum
   .to_excel('styled.xlsx', engine='openpyxl', index=False))