This example mainly aims at Oracle table space full problem processing method to do a step-by-step sharing.
I. Warning Information
After receiving zabbix alarm information, the usage rate of table space SYSAUX is more than 95%, and that of system table space sysaux is more than 95%.

Processing steps
1. Log on to the specific database and do the corresponding database space utilization query.
set line 200;
set pagesize 20000;
set feedback off;
col tablespace_name for a20;
col c_free_percent for a12;
col c_used_percent for a12;
col m_free_percent for a12;
col m_USED_PERCENT for a12;
select d.tablespace_name,round(d.MB_current_Bytes,2) Curr_Size_MB,round(f.free_mb_bytes,2) Free_Szie_MB,round(d.MB_maxbytes,2) MAX_Size_MB,round((f.free_mb_bytes/d.MB_current_Bytes)*100,2)  c_free_percent,round((d.MB_current_Bytes-f.free_mb_bytes)/d.MB_current_Bytes,4)*100 || '%' c_used_percent,round(((d.MB_maxbytes-d.MB_current_Bytes+f.free_mb_bytes)/d.MB_maxbytes)*100,2)   m_free_percent,round((d.MB_current_Bytes-f.free_mb_bytes)/d.MB_maxbytes,4)*100 || '%' m_used_percent
from  (select tablespace_name,sum(bytes/1024/1024) MB_current_Bytes,sum(maxbytes/1024/1024) MB_maxbytes from dba_data_files group by tablespace_name ) d,(select tablespace_name,sum(bytes/1024/1024) free_mb_bytes from dba_free_space group by tablespace_name) f
where d.tablespace_name=f.tablespace_name
order by c_free_percent ;

2. Occupancy of Objects Corresponding to Query Table Space
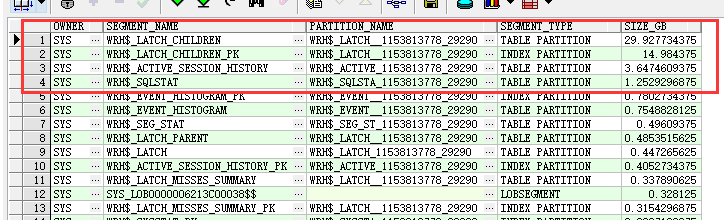
select OWNER,segment_name,segment_type,PARTITION_NAME,bytes/1024/1024/1024 Size_GB from dba_segments where tablespace_name='SYSAUX' order by Size_GB desc
3. Clean up the relevant data that can be cleaned up according to the specific big objects.
The large objects found according to the above SQL are mainly
1    SYS    WRH$_LATCH_CHILDREN        WRH$_LATCH__1153813778_29290    TABLE PARTITION    29.927734375
2    SYS    WRH$_LATCH_CHILDREN_PK      WRH$_LATCH__1153813778_29290    INDEX PARTITION    14.984375
3    SYS    WRH$_ACTIVE_SESSION_HISTORY   WRH$_ACTIVE_1153813778_29290    TABLE PARTITION    3.6474609375
4    SYS    WRH$_SQLSTAT            WRH$_SQLSTA_1153813778_29290    TABLE PARTITION    1.2529296875
WRH$_LATCH_CHILDREN denotes snapshot usage, where partition 1153813778 is DBID and 29290 is snapshot ID
Look at the snapshot ID of 29290 when
select snap_id, begin_interval_time from sys.dba_hist_snapshot order by snap_id;

select snap_id, begin_interval_time from sys.dba_hist_snapshot where snap_id=29290

4. Cleaning partition WRH$_LATCH__1153813778_29290
select * from   WRH$_LATCH_CHILDREN partition ( WRH$_LATCH__1153813778_29290);

alter table WRH$_LATCH_CHILDREN truncate partition WRH$_LATCH__1153813778_29290;
5. Check the table space after cleaning
select d.tablespace_name,round(d.MB_current_Bytes,2) Curr_Size_MB,round(f.free_mb_bytes,2) Free_Szie_MB,round(d.MB_maxbytes,2) MAX_Size_MB,round((f.free_mb_bytes/d.MB_current_Bytes)*100,2)  c_free_percent,round((d.MB_current_Bytes-f.free_mb_bytes)/d.MB_current_Bytes,4)*100 || '%' c_used_percent,round(((d.MB_maxbytes-d.MB_current_Bytes+f.free_mb_bytes)/d.MB_maxbytes)*100,2)   m_free_percent,round((d.MB_current_Bytes-f.free_mb_bytes)/d.MB_maxbytes,4)*100 || '%' m_used_percent
from  (select tablespace_name,sum(bytes/1024/1024) MB_current_Bytes,sum(maxbytes/1024/1024) MB_maxbytes from dba_data_files group by tablespace_name ) d,(select tablespace_name,sum(bytes/1024/1024) free_mb_bytes from dba_free_space group by tablespace_name) f
where d.tablespace_name=f.tablespace_name  and f.tablespace_name='SYSAUX'
order by c_free_percent ;

Appendix to the script
1. Table Space segment Size Query
select OWNER,segment_name,PARTITION_NAME,segment_type,bytes/1024/1024/1024 Size_GB from dba_segments where tablespace_name='SYSAUX' order by Size_GB desc
2. Table space usage query
set line 200;
set pagesize 20000;
set feedback off;
col tablespace_name for a20;
col c_free_percent for a12;
col c_used_percent for a12;
col m_free_percent for a12;
col m_USED_PERCENT for a12;
select d.tablespace_name,round(d.MB_current_Bytes,2) Curr_Size_MB,round(f.free_mb_bytes,2) Free_Szie_MB,round(d.MB_maxbytes,2) MAX_Size_MB,round((f.free_mb_bytes/d.MB_current_Bytes)*100,2)  c_free_percent,round((d.MB_current_Bytes-f.free_mb_bytes)/d.MB_current_Bytes,4)*100 || '%' c_used_percent,round(((d.MB_maxbytes-d.MB_current_Bytes+f.free_mb_bytes)/d.MB_maxbytes)*100,2)   m_free_percent,round((d.MB_current_Bytes-f.free_mb_bytes)/d.MB_maxbytes,4)*100 || '%' m_used_percent
from  (select tablespace_name,sum(bytes/1024/1024) MB_current_Bytes,sum(maxbytes/1024/1024) MB_maxbytes from dba_data_files group by tablespace_name ) d,(select tablespace_name,sum(bytes/1024/1024) free_mb_bytes from dba_free_space group by tablespace_name) f
where d.tablespace_name=f.tablespace_name
order by c_free_percent ;
3. View snapshot ID, snapshot settings, snapshot settings
select snap_id, begin_interval_time from sys.dba_hist_snapshot order by snap_id;
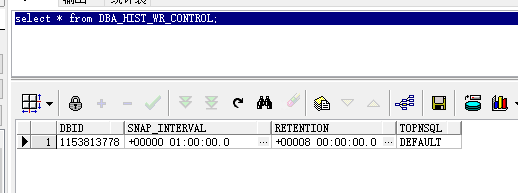
select * from DBA_HIST_WR_CONTROL;
begin
    DBMS_WORKLOAD_REPOSITORY.MODIFY_SNAPSHOT_SETTINGS(retention =>43200,interval =>30, topnsql =>'MAXIMUM');
end;
/
4. Cleaning up Statistical Information
exec dbms_stats.purge_stats(systimestamp -11);