My SQL tuning column: https://blog.csdn.net/u014427391/article/category/8679315
For local, such as a page list sql, we can use Oracle's execution plan for SQL tuning, but for the whole system, you can know which SQLs are time consuming?Of course, you can get it by checking Oracle's shared pool, but Oracle system itself provides several performance analysis reports, such as AWR, ASH, ADDM, etc. This blog introduces ASH performance analysis report
ASH is the active session history, Active Session History, ASH is based on V$SESSION and sampled once per second to record events waiting for an active session.Inactive sessions do not sample, which is done by the newly introduced background process MMNL.
The v$active_session_history view provides extracting session activity information at the instance level.Active sessions are sampled every minute and stored in a circular buffer in the sga.Any session that is connected to the database and is waiting for a session that is not part of the idle wait time is considered an active session.Each session sampling is a set of row data and returns row data for each sampled active session through the v$active_session_history view, returning the first row data for the most recent sampled session.
1. ASH Report Generation
Following the previous blog on AWR, https://smilenicky.blog.csdn.net/article/details/89414432 I'll write another blog about ASH:
1.1 Tool Selection
You can use sqlplus or plsql developer client software for Oracle databases
sqlplus uses
You can log in using the sqlplus tool
Enter database
sqlplus / as sysdba
View Users
show parameter db_name
Use login before you can use it
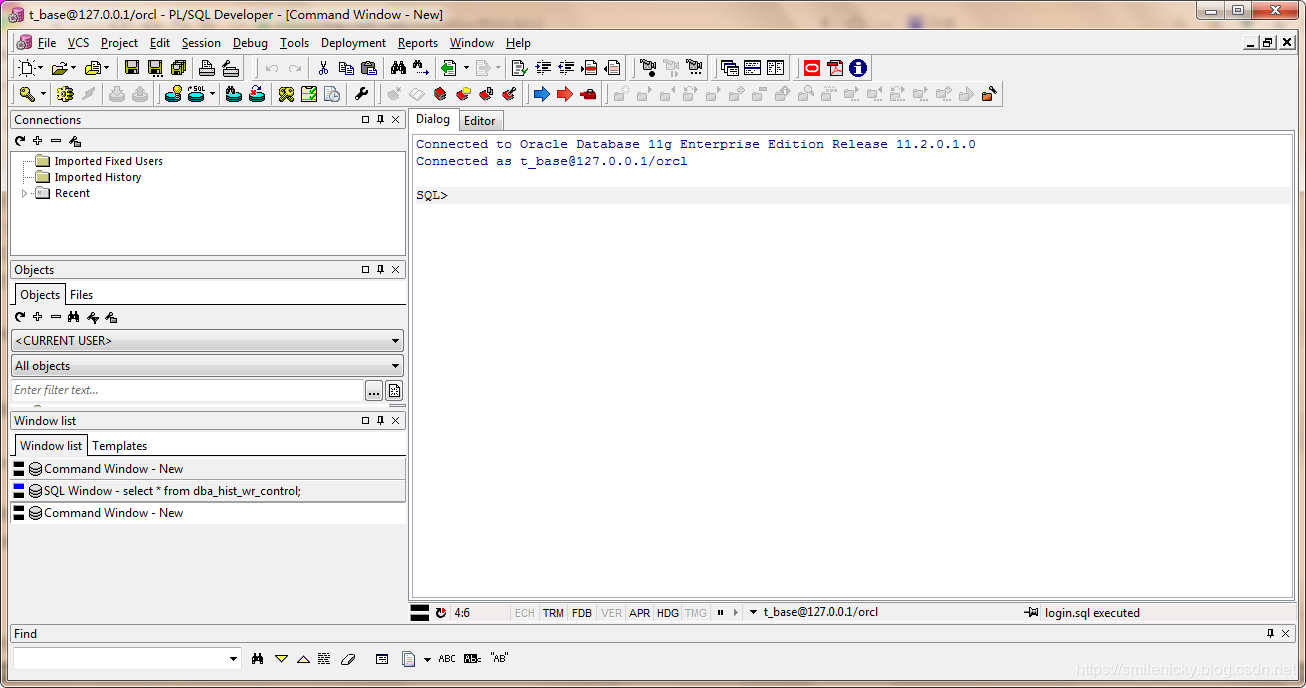
plsql developer uses
plsql developer can also be used, after login, select File->New->Command Window
1.2 Automatically create snapshots
Execute after starting manometry
exec DBMS_WORKLOAD_REPOSITORY.CREATE_SNAPSHOT ();
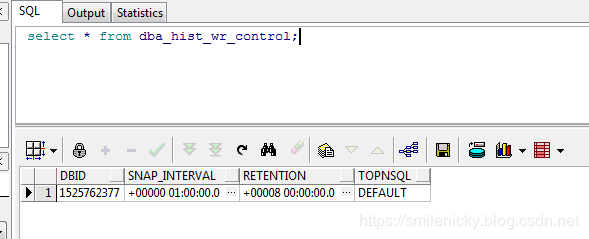
You can view the current configuration through dba_hist_wr_control, which takes a data snapshot every hour for 8 days.
select * from dba_hist_wr_control;
Modify the configuration to collect every 30 minutes for 1 day
execute dbms_workload_repository.modify_snapshot_settings(interval=>30,retention=>14000);
Turn off automatic collection
SQL>exec dbms_workload_repository.modify_snapshot_settings (interval=>0,retention=>24*60);
1.3 Manual snapshot creation
In addition to creating snapshots automatically, you can also create snapshots manually
select dbms_workload_repository.create_snapshot() from dual;
1.4 ASH Report Generation
Available for sqlplus clients
@?/rdbms/admin/ashrpt.sql
For plsql client, I use absolute path to execute, @? Command cannot find file
This will be modified according to your Oracle installation path, for example:
@D:/oracle/product/11.1.0/db_1/RDBMS/ADMIN/ashrpt.sql
(1) Log report type
Enter value for report_type: text
Choose the type of ASH report that is generated, whether it is text or html, typically HTML
(2) Start time of log report
Enter value for begin_time: 04/18/1920:00:00
Enter the ASH start time, as illustrated in the example above, for example, I am here starting at 20:00 p.m. on April 18, 2019.
(3) End time of log report
Enter value for duration:15
Input ASH end time, default is SYSDATE - begin_time, general input, default is seconds or grouping, take out 15 groups of ash analysis log.
(4) ASH report name
Enter value of report name:ash20190420
Enter ASH report name, you can fill it in freely, non-production, report name, report storage path can be found after printed log, for example:
D:\oracle\product\11.2.0\dbhome_1\RDBMS\ADMIN\ash.html
SQL> @D:/oracle/product/11.1.0/db_1/RDBMS/ADMIN/ashrpt.sql
Current Instance
~~~~~~~~~~~~~~~~
      DBID DB_NAME      INST_ INST_NAME
---------- ------------ ----- ------------
1525762377 ORCL             1 orcl
Specify the Report Type
~~~~~~~~~~~~~~~~~~~~~~~
Enter 'html' for an HTML report, or 'text' for plain text
Defaults to 'html'
Type Specified:  html
Instances in this Workload Repository schema
~~~~~~~~~~~~~~~~~~~~~~~~~~~~~~~~~~~~~~~~~~~~
DBBID        INSTT DBB_NAME     INSTT_NAME   HOST
------------ ----- ------------ ------------ ------------
* 1525762377     1 ORCL         orcl         PC-201508171
                                             906
Defaults to current database
Using database id: 1525762377
Enter instance numbers. Enter 'ALL' for all instances in a
RAC cluster or explicitly specify list of instances (e.g., 1,2,3).
Defaults to current instance.
Using instance number(s): 1
PL/SQL procedure successfully completed
...
0
PL/SQL procedure successfully completed
...
18-Apr-19 22:05:54
ASH Samples in this Workload Repository schema
~~~~~~~~~~~~~~~~~~~~~~~~~~~~~~~~~~~~~~~~~~~~~~
Oldest ASH sample available:  09-Apr-19 22:00:36   [    12968 mins in the past] Latest ASH sample available:  18-Apr-19 22:05:54   [        3 mins in the past]
...
18-Apr-19 22:05:54
Specify the timeframe to generate the ASH report
~~~~~~~~~~~~~~~~~~~~~~~~~~~~~~~~~~~~~~~~~~~~~~~~
Enter begin time for report:
--    Valid input formats:
--      To specify absolute begin time:
--        [MM/DD[/YY]] HH24:MI[:SS]
--        Examples: 02/23/03 14:30:15
--                  02/23 14:30:15
--                  14:30:15
--                  14:30
--      To specify relative begin time: (start with '-' sign)
--        -[HH24:]MI
--        Examples: -1:15  (SYSDATE - 1 Hr 15 Mins)
--                  -25    (SYSDATE - 25 Mins)
Defaults to -15 mins
Report begin time specified: 04/18/1920:00:00
PL/SQL procedure successfully completed

18-Apr-20 00:00:00
Enter duration in minutes starting from begin time:
Defaults to SYSDATE - begin_time
Press Enter to analyze till current time
Report duration specified:   7200
PL/SQL procedure successfully completed
...
23-Apr-20 00:00:00
Specify Slot Width (using ashrpti.sql) for 'Activity Over Time' section
~~~~~~~~~~~~~~~~~~~~~~~~~~~~~~~~~~~~~~~~~~~~~~~~~~~~~~~~~~~~~~~~~~~~~~~
-- Explanation:
--   In the 'Activity Over Time' section of the ASH report,
--   the analysis period is divided into smaller slots
--   and top wait events are reported in each of those slots.
-- Default:
--   The analysis period will be automatically split upto 10 slots
--   complying to a minimum slot width of
--     1 minute,  if the source is V$ACTIVE_SESSION_HISTORY or
--     5 minutes, if the source is DBA_HIST_ACTIVE_SESS_HISTORY.
Specify Slot Width in seconds to use in the 'Activity Over Time' section:
Defaults to a value as explained above:
Slot Width specified:
Specify Report Targets (using ashrpti.sql) to generate the ASH report
~~~~~~~~~~~~~~~~~~~~~~~~~~~~~~~~~~~~~~~~~~~~~~~~~~~~~~~~~~~~~~~~~~~~~
-- Explanation:
--   ASH Report can accept "Report Targets",
--   like a particular SQL statement, or a particular SESSION,
--   to generate the report on. If one or more report targets are
--   specified, then the data used to generate the report will only be
--   the ASH samples that pertain to ALL the specified report targets.
-- Default:
--   If none of the report targets are specified,
--   then the target defaults to all activity in the database instance.
Specify SESSION_ID (eg: from V$SESSION.SID) report target:
Defaults to NULL:
SESSION report target specified:
Specify SQL_ID (eg: from V$SQL.SQL_ID) report target:
Defaults to NULL: (% and _ wildcards allowed)
SQL report target specified:
Specify WAIT_CLASS name (eg: from V$EVENT_NAME.WAIT_CLASS) report target:
[Enter 'CPU' to investigate CPU usage]
Defaults to NULL: (% and _ wildcards allowed)
WAIT_CLASS report target specified:
Specify SERVICE_HASH (eg: from V$ACTIVE_SERVICES.NAME_HASH) report target:
Defaults to NULL:
SERVICE report target specified:
Specify MODULE name (eg: from V$SESSION.MODULE) report target:
Defaults to NULL: (% and _ wildcards allowed)
MODULE report target specified:
Specify ACTION name (eg: from V$SESSION.ACTION) report target:
Defaults to NULL: (% and _ wildcards allowed)
ACTION report target specified:
Specify CLIENT_ID (eg: from V$SESSION.CLIENT_IDENTIFIER) report target:
Defaults to NULL: (% and _ wildcards allowed)
CLIENT_ID report target specified:
Specify PLSQL_ENTRY name (eg: "SYS.DBMS_LOB.*") report target:
Defaults to NULL: (% and _ wildcards allowed)
PLSQL_ENTRY report target specified:
Specify the Report Name
~~~~~~~~~~~~~~~~~~~~~~~
The default report file name is ashrpt_1_0423_0000.html.  To use this name,
press <return> to continue, otherwise enter an alternative.
Using the report name ash.html
Summary of All User Input -------------------------                                                        Format         : HTML                                                            DB Id          : 1525762377                                                      Inst num       : 1                                                               Begin time     : 18-Apr-20 00:00:00                                              End time       : 23-Apr-20 00:00:00                                              Slot width     : Default                                                         Report targets : 0                                                               Report name    : ash.html
...
23-Apr-20 00:00:00
Started spooling to D:\oracle\product\11.2.0\dbhome_1\RDBMS\ADMIN\ash.html
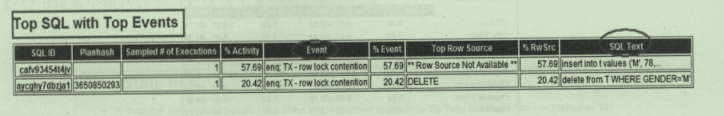
II. Analysis of ASH Reporting Indicators
ASH reports are straightforward, giving you the wait events and which SQL associations, and then we can tune the SQL
Graph from Harvest, More than SQL Optimizations