Preface
ELK is the abbreviation of three kinds of software, which are composed of Elasticsearch, Logstash and Kibana. In the process of development, there are new members, Beats, which form Elastic Stack. So, ELK is the old name, and Elastic Stack is the new name.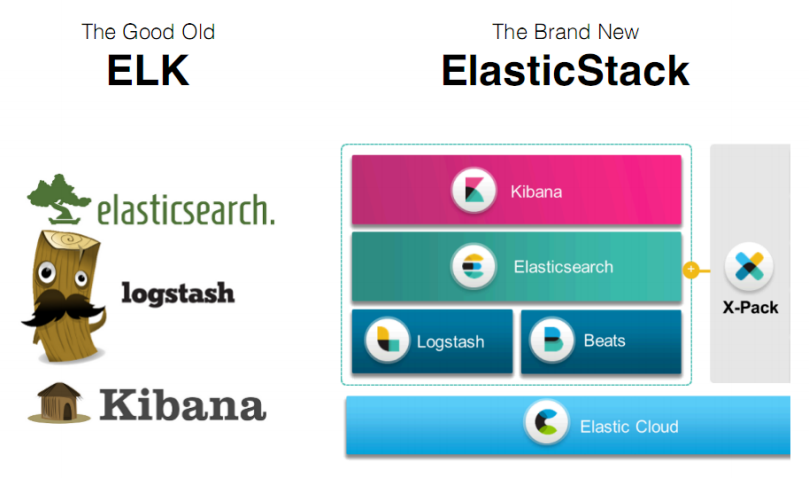
The entire Elastic Stack technology stack includes:
Elasticsearch
Based on java, Elasticsearch is an open source distributed search engine. Its features include: distributed, zero configuration, automatic discovery, automatic index fragmentation, and index
Replica mechanism, restful style interface, multiple data sources, automatic search load, etc.
Logstash
Logstash is based on java and is an open-source tool for collecting, analyzing and storing logs.
Kibana
Kibana, based on nodejs, is also an open-source and free tool. Kibana can provide Logstash and ElasticSearch with a log analysis friendly Web interface, which can summarize, analyze and search important data logs.
Beats
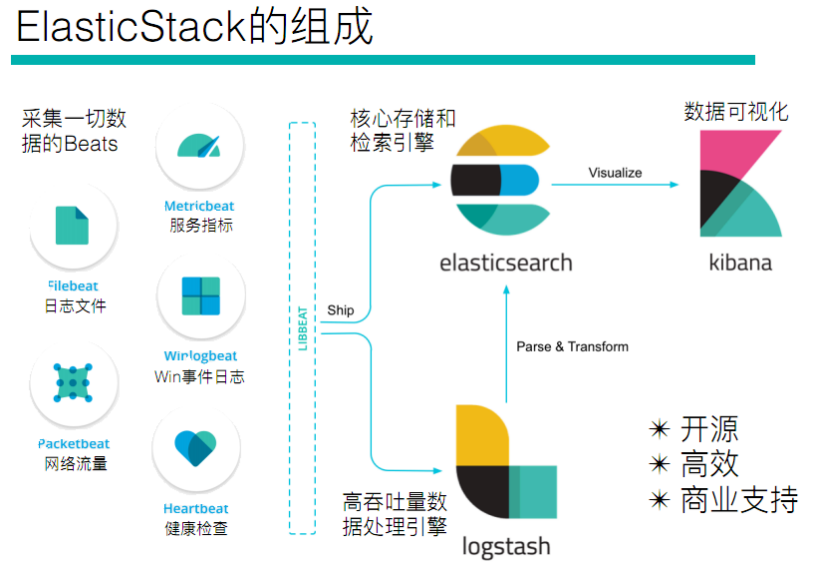
Beats is an open-source agent for collecting system monitoring data of elastic company. It is a general designation of data collectors running in the form of clients on the monitored server. It can send data directly to elastic search or through Logstash to elastic search, and then carry out subsequent data analysis activities.
Beats consists of:
- Packetbeat: it is a network packet analyzer, which is used to monitor and collect network traffic information. Packetbeat sniffs traffic between servers, resolves application layer protocols, and is associated with message processing. It supports ICMP (v4 and v6), DNS, HTTP, Mysql, PostgreSQL, Redis, MongoDB, Memcache and other protocols;
- Filebeat: used to monitor and collect server log files, which has replaced logstash forwarder;
- Metricbeat: it can regularly obtain monitoring index information of external System, which can monitor and collect Apache, HAProxy, MongoDB, MySQL, Nginx, PostgreSQL, Redis, System, Zookeeper and other services;
- Winlogbeat: used to monitor and collect the log information of Windows system;
1, Host planning
| HostName | IP | Mem |
|---|---|---|
| ELK1 | 192.168.182.13 | 3G |
All resource packs in this article , extraction code: 8sdp
2, Basic environment configuration
1. Time synchronization
[root@localhost ~]# yum -y install ntp
[root@localhost ~]# systemctl enable ntpd
[root@localhost ~]# systemctl start ntpd
[root@localhost ~]# ntpdate -u cn.pool.ntp.org
[root@localhost ~]# hwclock --systohc
[root@localhost ~]# timedatectl set-timezone Asia/Shanghai
2. Turn off firewall & & SELinux
[root@localhost ~]# systemctl stop firewalld
[root@localhost ~]# setenforce 0
3. Installing the Jdk environment
Operation and maintenance | JDK (rpm, source code) installation and configuration in Linux Environment
3, Elasticsearch installation
1. Upload the downloaded elastic search package to the server for installation.
[root@linux-elk1 ~]# yum -y localinstall elasticsearch-6.8.1.rpm
2. Configure elastic search. Linux elk2 configures a same node to communicate through multicast. If you cannot query through multicast, modify it to unicast
[root@linux-elk1 ~]# vim /etc/elasticsearch/elasticsearch.yml

cluster.name: ELK-Cluster    #ELKThe same cluster name means the same cluster
node.name: elk-node1    #The name of the local node in the cluster
path.data: /elk/data    #Data storage directory
path.logs: /elk/logs    #Log save directory
bootstrap.memory_lock: true    #Lock enough memory when the service starts to prevent data from being written to swap
network.host: 192.168.182.13    #MonitoringIPaddress
http.port: 9200    #Service listening port
discovery.zen.ping.unicast.hosts: ["192.168.182.13"]
3. Modify the memory limit. Memory locking requires more than 2g of memory. Otherwise, elasticsearch cannot be started
[root@linux-elk1 ~]# vim /usr/lib/systemd/system/elasticsearch.service
# stay[Service]Add the following line below
LimitMEMLOCK=infinity

[root@linux-elk1 ~]# systemctl daemon-reload
[root@linux-elk1 ~]# vim /etc/elasticsearch/jvm.options
-Xms2g
-Xmx2g     #Minimum and maximum memory limits
4. Create data directory and log directory and modify permissions
[root@linux-elk1 ~]# mkdir -p /elk/{data,logs}
[root@linux-elk1 ~]# chown elasticsearch.elasticsearch /elk/ -R
5. Start elastic search and check whether the port is listening
[root@linux-elk1 ~]# systemctl start elasticsearch
[root@linux-elk1 ~]# netstat -nltup |grep java
tcp6       0      0 192.168.182.13:9200     :::*                    LISTEN      20774/java
tcp6       0      0 192.168.182.13:9300     :::*                    LISTEN      20774/java
6. Accessing the elastic search port through a browser
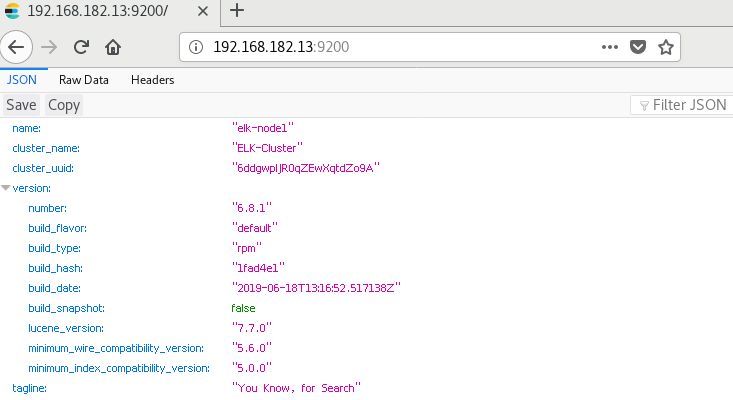
7. Monitoring elasticsearch status
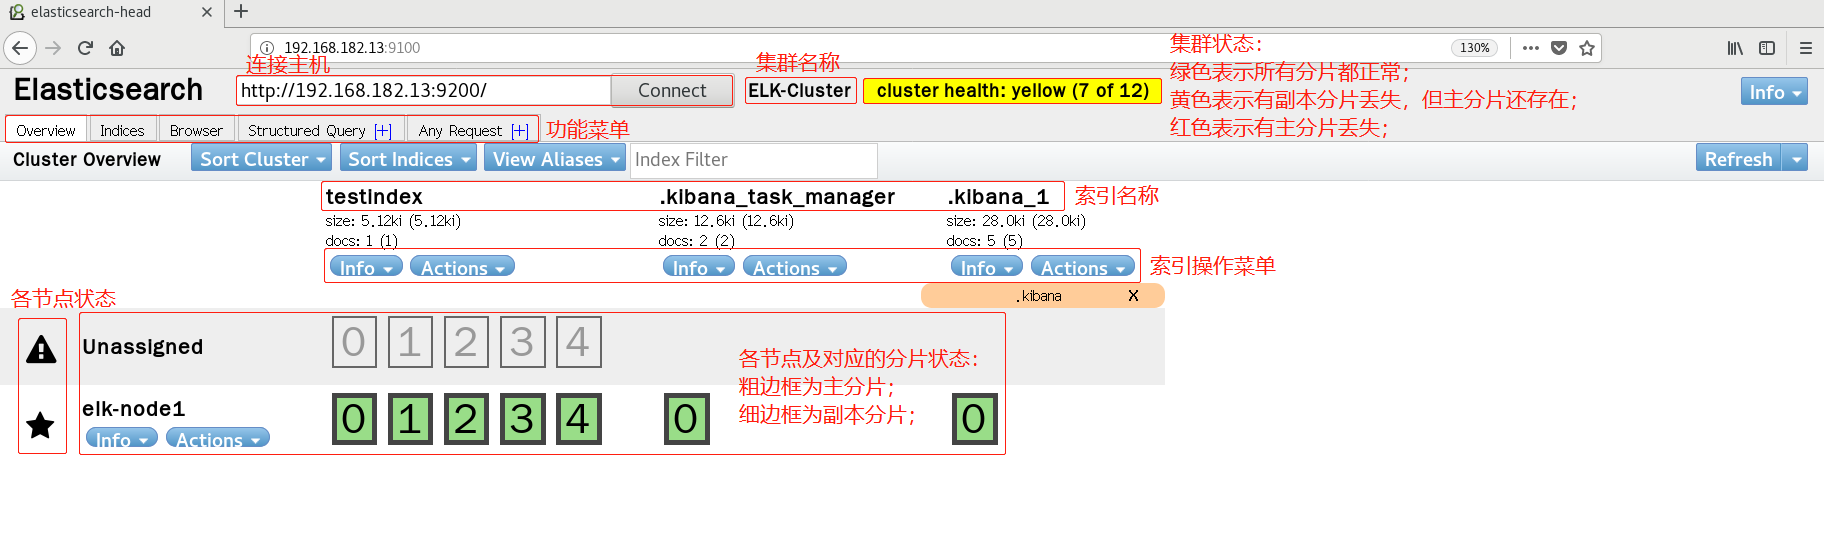
Obtain the cluster status through the shell command. Here you get a return value in json format. For example, analyze the status. If it is equal to green, it is running normally. If it is equal to yellow, it means the copy partition is lost. If it is red, it means the main partition is lost.
[root@elk1 elk]# curl http://192.168.182.13:9200/_cluster/health?pretty=true
{
  "cluster_name" : "ELK-Cluster",
  "status" : "green",
  "timed_out" : false,
  "number_of_nodes" : 1,
  "number_of_data_nodes" : 1,
  "active_primary_shards" : 0,
  "active_shards" : 0,
  "relocating_shards" : 0,
  "initializing_shards" : 0,
  "unassigned_shards" : 0,
  "delayed_unassigned_shards" : 0,
  "number_of_pending_tasks" : 0,
  "number_of_in_flight_fetch" : 0,
  "task_max_waiting_in_queue_millis" : 0,
  "active_shards_percent_as_number" : 100.0
}
8. Install the elasticsearch plug-in head
View cluster information through the head plug-in
-
Install npm tools
Operation and maintenance | Centos7 source code installation node and npm - Install the head plug-in
[root@linux-elk1 src]# tar xvzf elasticsearch-head.tar.gz
[root@linux-elk1 src]# cd elasticsearch-head/
[root@linux-elk1 elasticsearch-head]# npm run start &
- Modify the elasticsearch service configuration file, enable cross domain access support, and restart the elasticsearch service
[root@linux-elk1 ~]# vim /etc/elasticsearch/elasticsearch.yml

http.cors.enabled: true     #Add at bottom
http.cors.allow-origin: "*"
test
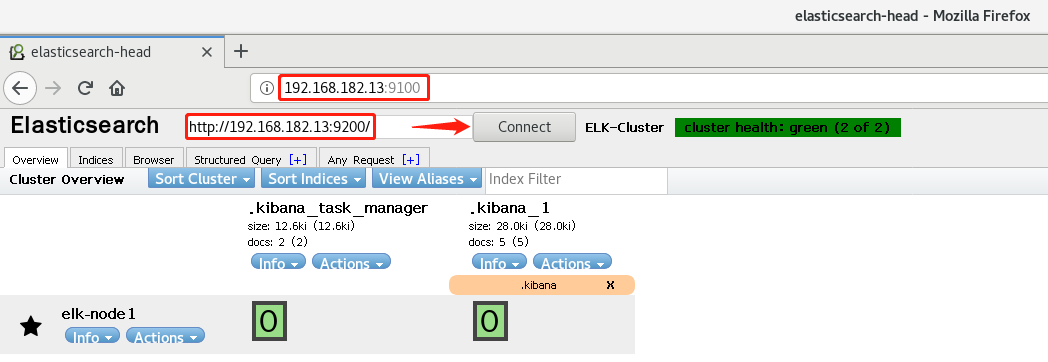
9. The browser accesses port 9100 and changes the connection address to elastic search address
-
A. Test submission data
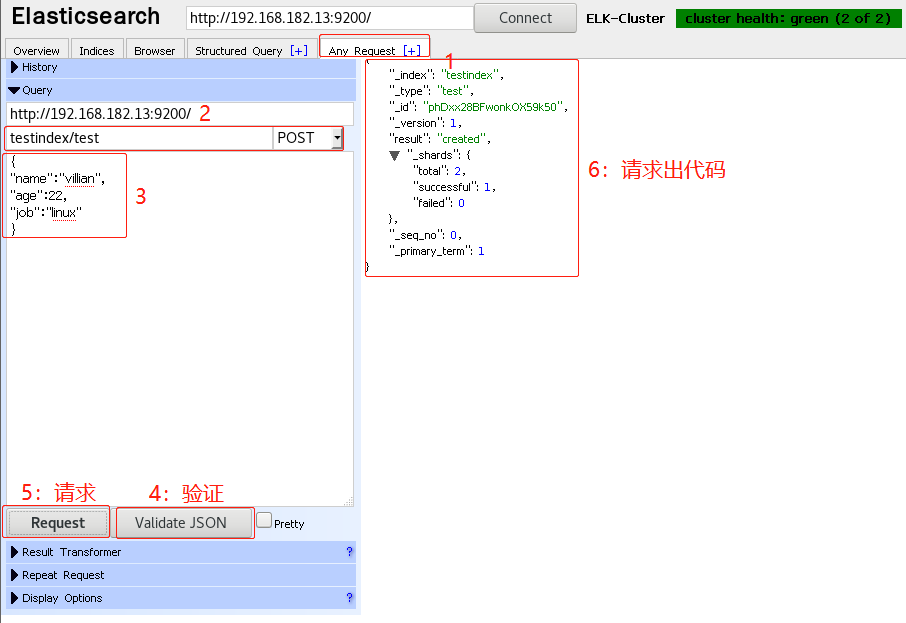
-
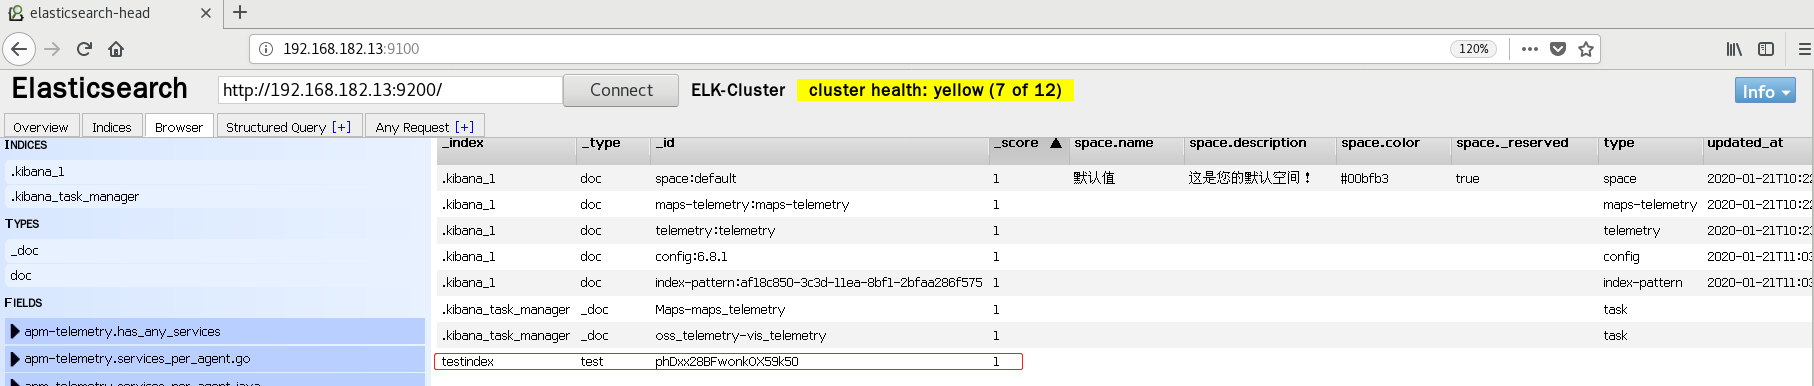
B. Verify index exists
-
C. View data
- To facilitate the management of elastic search head plug-in, write a startup script
[root@linux-elk1 ~]# vim /usr/bin/elasticsearch-head

#!/bin/bash
#desc: elasticsearch-head service manager
#date: 2019

data="cd /usr/local/src/elasticsearch-head/; nohup npm run start > /dev/null 2>&1 & "

function START (){
    eval $data && echo -e "elasticsearch-head start\033[32m     ok\033[0m"
}

function STOP (){
    ps -ef |grep grunt |grep -v "grep" |awk '{print $2}' |xargs kill -s 9 > /dev/null && echo -e "elasticsearch-head stop\033[32m      ok\033[0m"
}

case "$1" in
    start)
        START
        ;;
    stop)
        STOP
        ;;
    restart)
        STOP
        sleep 3
        START
        ;;
    *)
        echo "Usage: elasticsearch-head (start|stop|restart)"
        ;;
esac

[root@linux-elk1 ~]# chmod +x /usr/bin/elasticsearch-head
4, Logstash installation
logstash is an open source data collection engine, which can scale horizontally. logstash is a component with the most plug-ins in the ELK. It can receive data from different sources and agree to output to specified and multiple destinations
[root@linux-elk1 ~]# wget https://artifacts.elastic.co/downloads/logstash/logstash-6.8.1.rpm
[root@linux-elk1 ~]# yum -y localinstall logstash-6.8.1.rpm
Test whether logstash is normal
1. Test standard I / O
[root@linux-elk1 ~]# /usr/share/logstash/bin/logstash -e 'input { stdin {} } output { stdout { codec => rubydebug} }'
[INFO ] 2020-01-21 18:07:29.447 [Api Webserver] agent - Successfully started Logstash API endpoint {:port=>9600}
{
    "@timestamp" => 2020-01-21T10:07:28.818Z,
          "host" => "elk1",
       "message" => "hello world",
      "@version" => "1"
}
2. Test output to file
[root@linux-elk1 ~]# /usr/share/logstash/bin/logstash   -e 'input { stdin{} } output { file { path => "/tmp/log-%{+YYYY.MM.dd}messages.gz"}}'
hello world   #input
[INFO ] 2019-07-04 17:33:06.065 [[main]>worker0] file - Opening file {:path=>"/tmp/log-2019.07.04messages.gz"}

[root@elk1 zwl]# tail /tmp/log-2020.01.21messages.gz
{"@version":"1","host":"elk1","message":"hello world","@timestamp":"2020-01-21T10:09:34.569Z"}
{"@version":"1","host":"elk1","message":"helo\bl\b","@timestamp":"2020-01-21T10:09:34.550Z"}
3. Test output to elastic search
[root@linux-elk1 ~]# /usr/share/logstash/bin/logstash -e 'input { stdin{} } output { elasticsearch {hosts => ["192.168.1.31:9200"] index => "mytest-%{+YYYY.MM.dd}" }}'
4. elasticsearch server verifies received data
[root@linux-elk1 ~]# ll /elk/data/nodes/0/_state/
//Total consumption 28
-rw-r--r--. 1 elasticsearch elasticsearch 24522 1month  21 18:12 global-13.st
-rw-r--r--. 1 elasticsearch elasticsearch    71 1month  21 17:43 node-0.st
4, Kibana installation
1. Install kibana
[root@linux-elk1 ~]# wget https://artifacts.elastic.co/downloads/kibana/kibana-6.8.1-x86_64.rpm
[root@linux-elk1 ~]# yum -y localinstall kibana-6.8.1-x86_64.rpm
[root@linux-elk1 ~]# vim /etc/kibana/kibana.yml
[root@linux-elk1 ~]# grep ^[a-Z] /etc/kibana/kibana.yml
server.port: 5601    #Monitor port
server.host: "192.168.182.13"    #Monitor address
elasticsearch.hosts: ["http://192.168.182.13:9200"]    #elasticsearch server address
i18n.locale: "zh-CN"    #Change to Chinese
2. Launch kibana and verify
[root@linux-elk1 ~]# systemctl start kibana
[root@linux-elk1 ~]# systemctl enable kibana
[root@linux-elk1 ~]# ss -nlt  |grep 5601
LISTEN     0      128    192.168.1.31:5601                     *:*
3. View Kibana startup status
5, Collect system message logs through logstash
PS: collect other log files through logstash, provided that the logstash user has read permission to the collected log file and write permission to the written file
1. Configure logstash profile
[root@linux-elk1 ~]# vim /etc/logstash/conf.d/system-log.conf
input {
    file {
        path => "/var/log/messages"          #Log path
        type => "systemlog"                  #Type, user-defined, which can be used to judge the output when multiple logs are collected and stored
        start_position => "beginning"        #Where does logstash start to read file data? The default is the end location. That is to say, the logstash process will be similar to tail -F The form of operation. If you want to import the original data, change this setting to "beginning",logstash The process reads from scratch, similar to less +F The form of operation.
        stat_interval => "2"                 #How often does logstash check the status of the monitored file (whether there is an update) by default 1 second
    }
}

output {
    elasticsearch {
        hosts => ["192.168.182.13:9200"]        #elasticsearch server address
        index => "logstash-%{type}-%{+YYYY.MM.dd}"    #Index name
    }
}
2. Check the configuration file syntax for errors
[root@localhost lib]# /usr/share/logstash/bin/logstash -f /etc/logstash/conf.d/system-log.conf -t
WARNING: Could not find logstash.yml which is typically located in $LS_HOME/config or /etc/logstash. You can specify the path using --path.settings. Continuing using the defaults
Could not find log4j2 configuration at path /usr/share/logstash/config/log4j2.properties. Using default config which logs errors to the console
[WARN ] 2020-01-21 20:24:22.950 [LogStash::Runner] multilocal - Ignoring the 'pipelines.yml' file because modules or command line options are specified
Configuration OK
[INFO ] 2020-01-21 20:24:39.384 [LogStash::Runner] runner - Using config.test_and_exit mode. Config Validation Result: OK. Exiting Logstash
3. Modify log file permissions and restart logstash
[root@linux-elk1 ~]# ll /var/log/messages
-rw-------. 1 root root 786219 7month   5 10:10 /var/log/messages
#Here you can see that the log file is600Permission, and elasticsearch Is running in elasticsearch User, this way elasticsearch Cannot collect logs. So you need to change the permission of the log, otherwise you will report the permission denial error. View in log/var/log/logstash/logstash-plain.log Is there an error.

[root@linux-elk1 ~]# chmod 644 /var/log/messages
[root@linux-elk1 ~]# systemctl  restart logstash
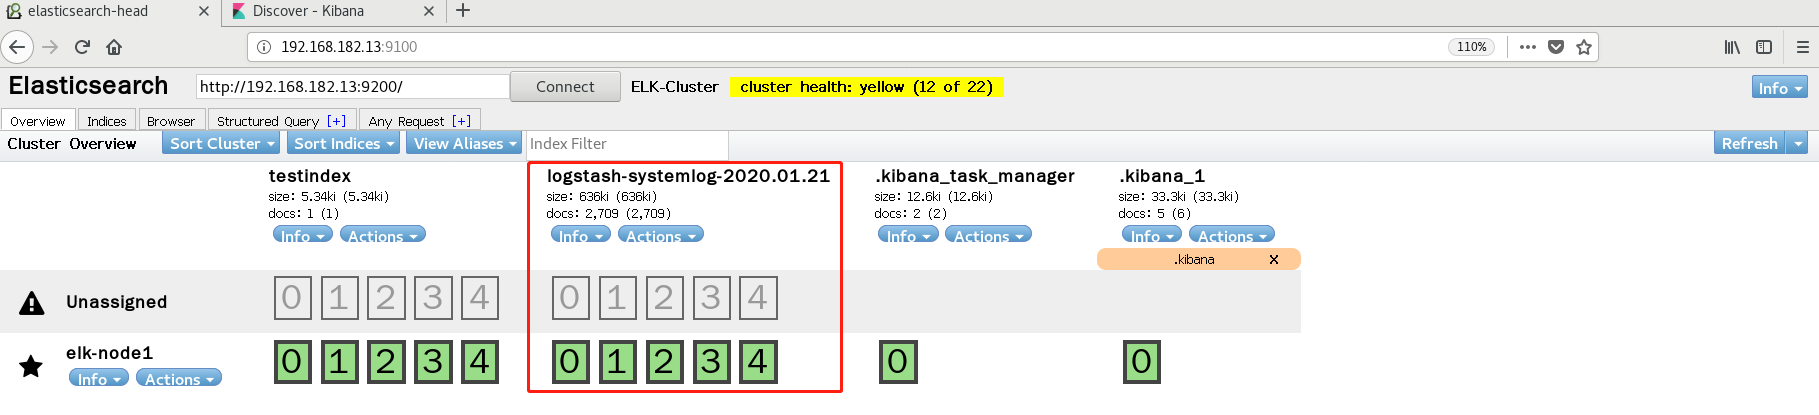
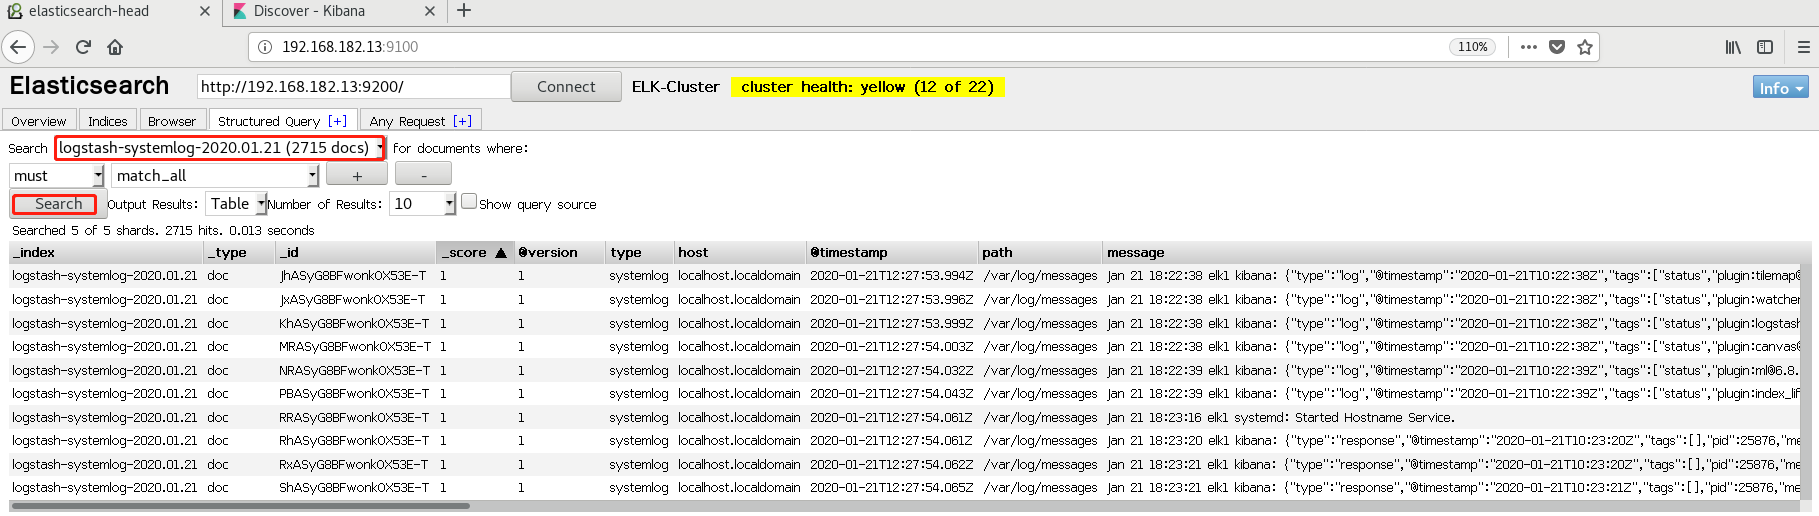
4. View and query the elastic search interface
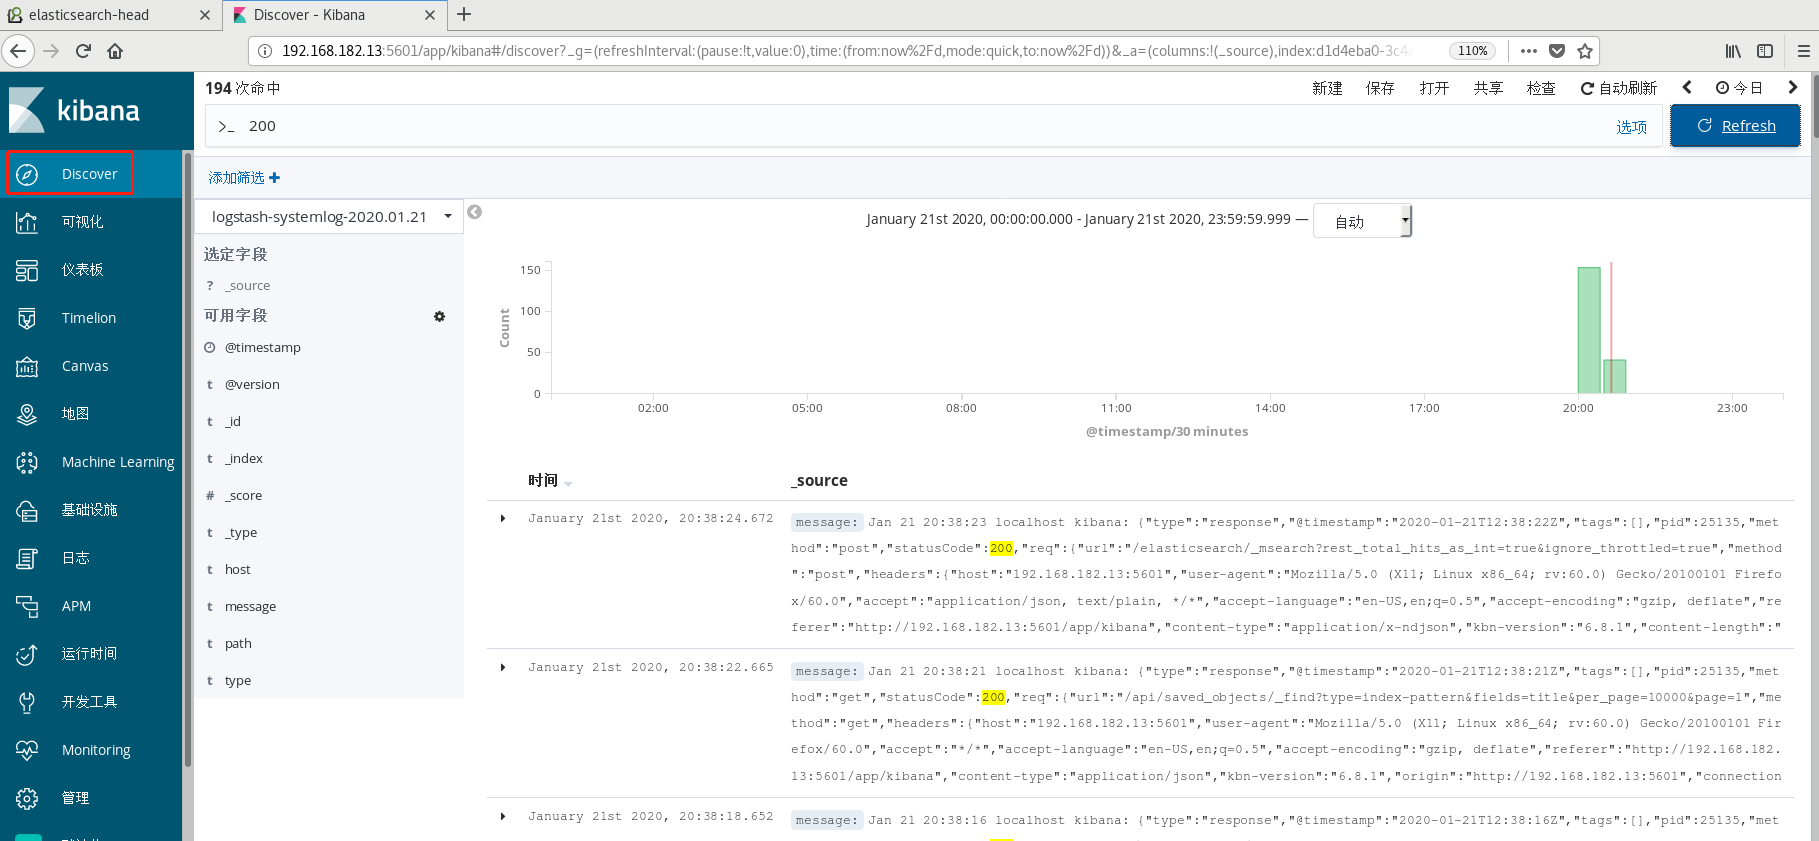
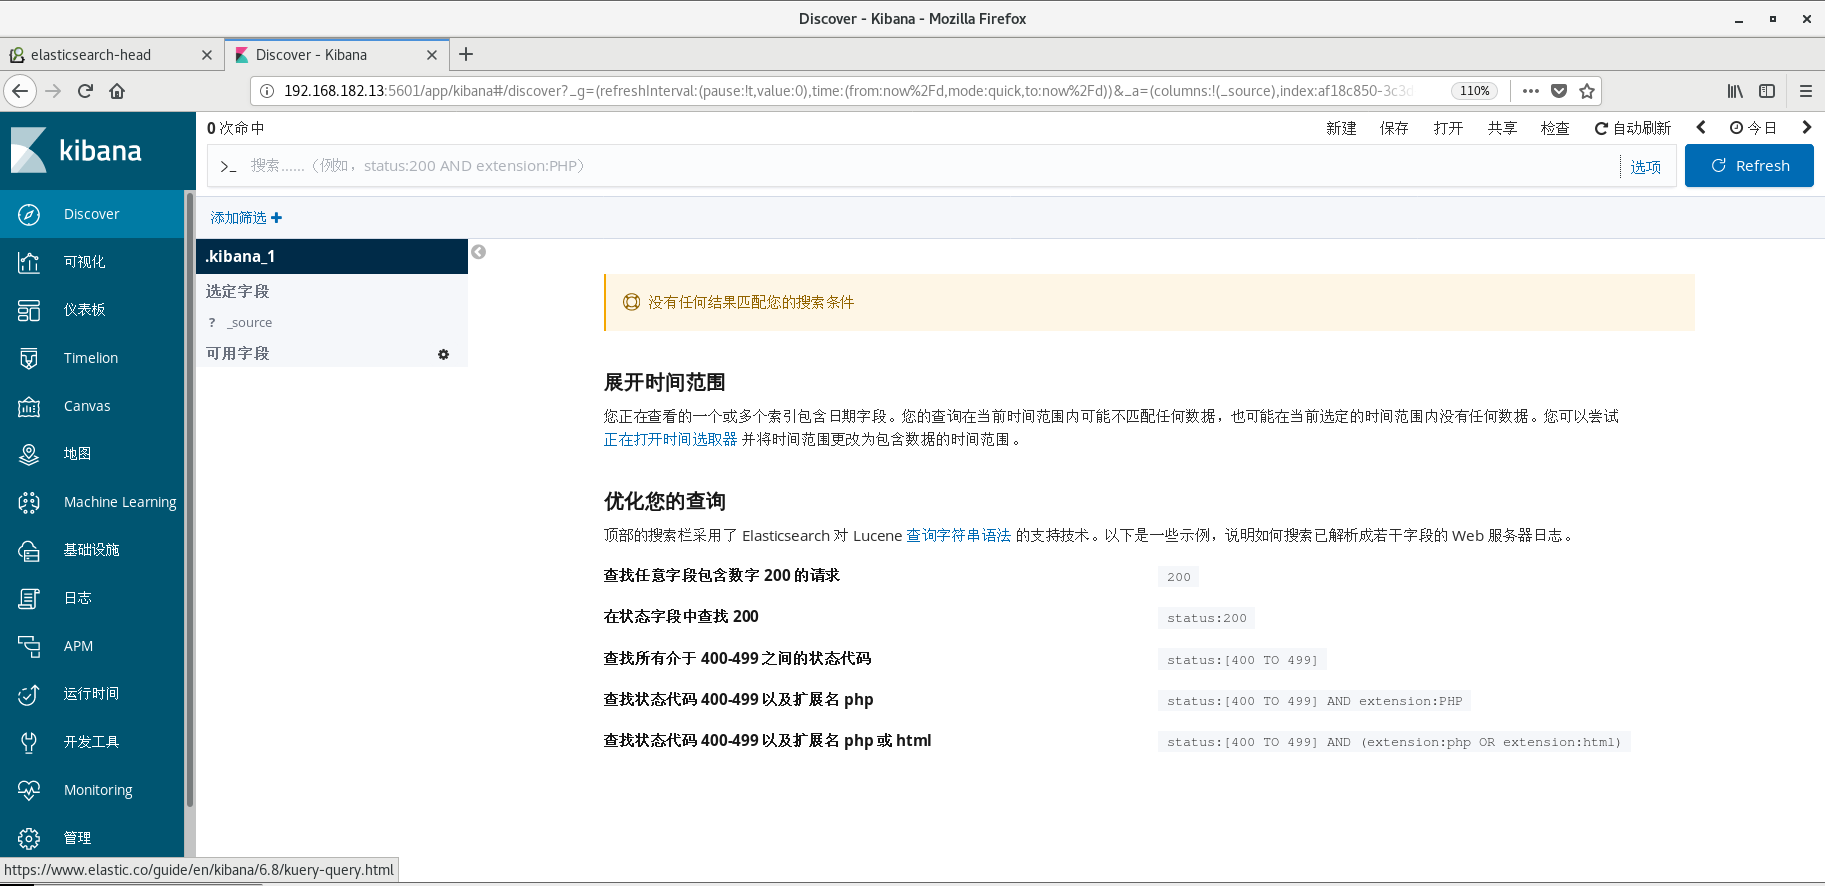
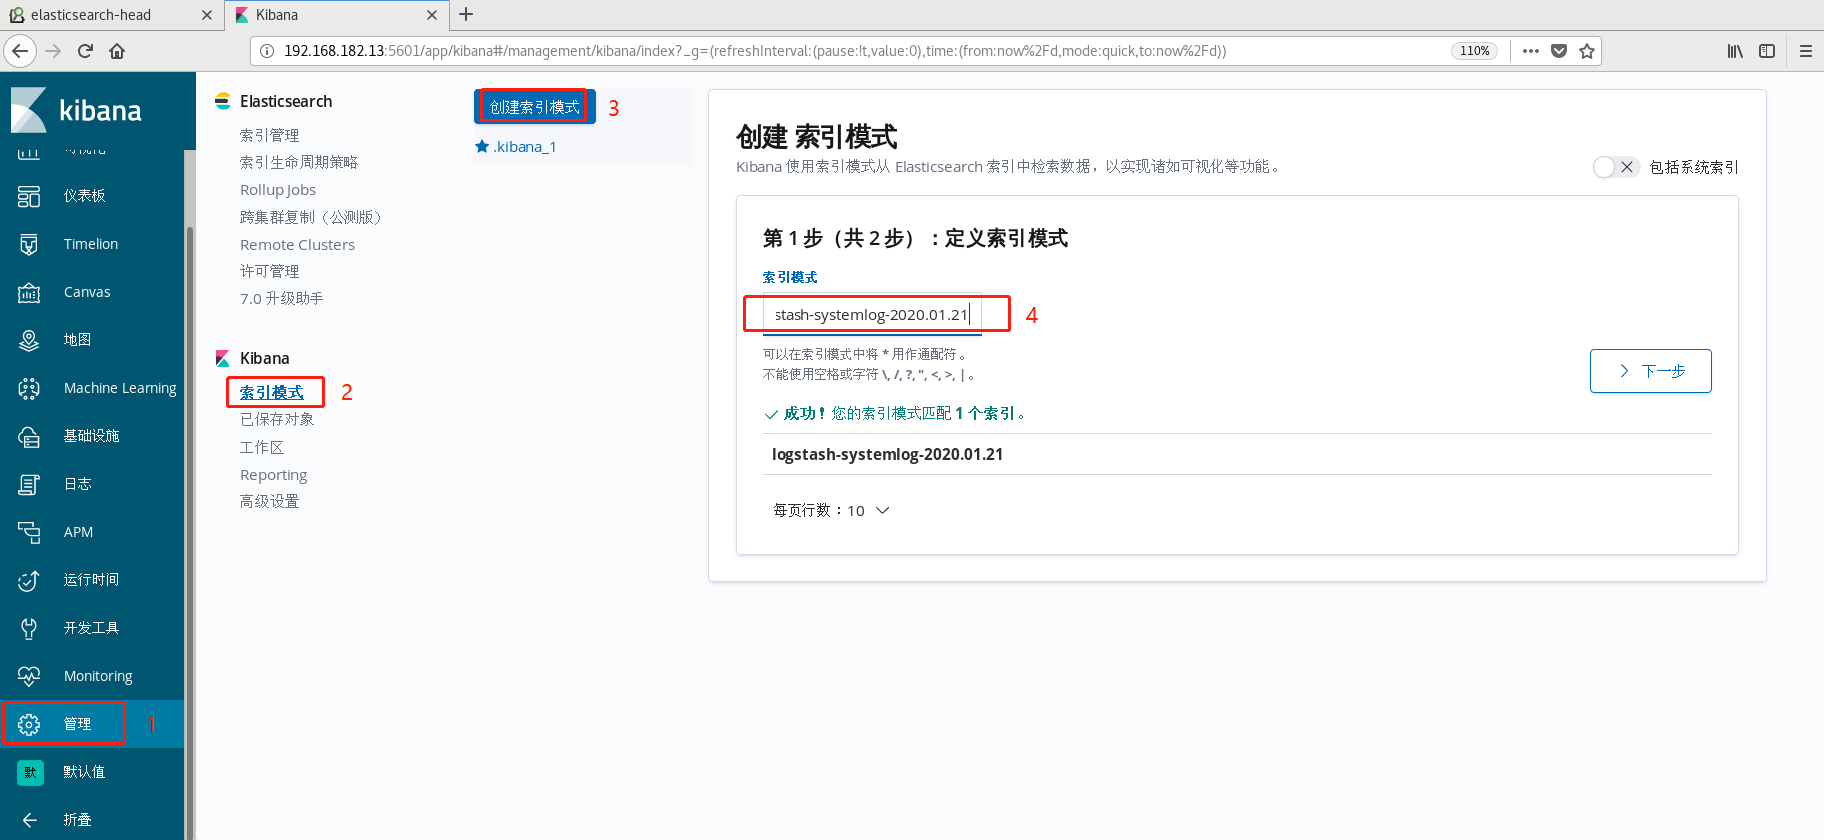
5. kibana interface create index and view
-
Add index mode
-
Start using and query 200 status