Preface
I have written a fan-shaped map drawing article in openlayers 4 before, but because it is written by encapsulating a layer of js code, many beginners seem to be a bit laborious, so this article rewrites a fan-shaped map drawing article, which is written directly based on the latest version of openlayers 6, in the form of pure html + js + css, without any encapsulation.
Content overview
1. Map drawing sector based on openlayers6
2. Download the source code demo
The renderings are as follows: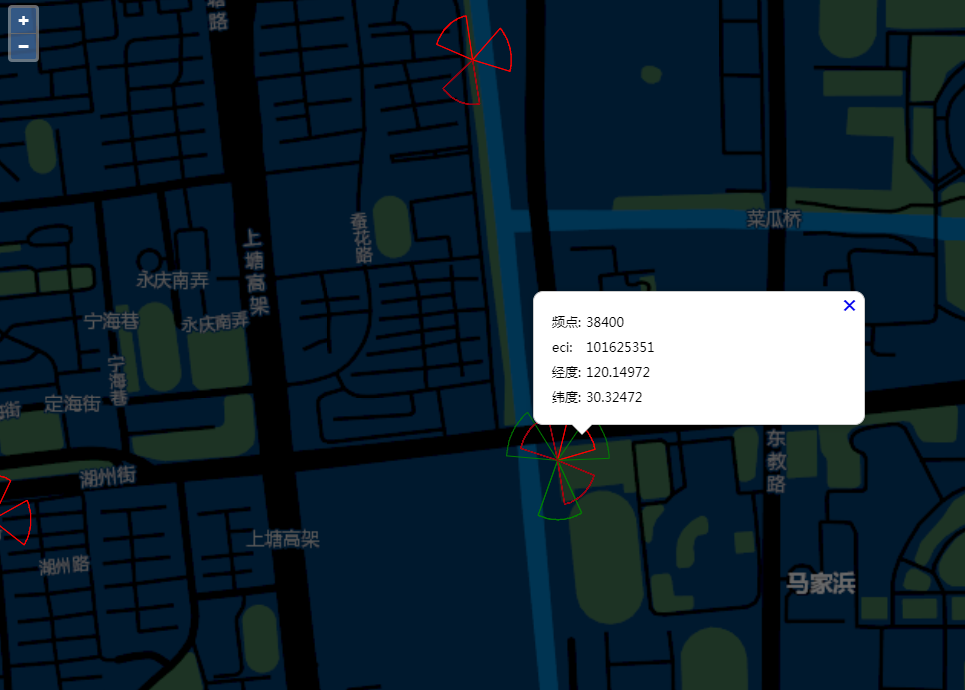
Specific implementation process
- html style
<html>
<head>
<meta charset="utf-8">
<title>Using OpenLayers with Webpack</title>
<link rel="stylesheet" href="https://openlayers.org/en/latest/css/ol.css" type="text/css">
<style>
html, body {
margin: 0;
height: 100%;
}
#map {
position: absolute;
top: 0;
bottom: 0;
width: 100%;
}
.ol-popup {
position: absolute;
background-color: white;
-webkit-filter: drop-shadow(0 1px 4px rgba(0,0,0,0.2));
filter: drop-shadow(0 1px 4px rgba(0,0,0,0.2));
padding: 15px;
border-radius: 10px;
border: 1px solid #cccccc;
bottom: 12px;
left: -50px;
min-width: 280px;
}
.ol-popup:after, .ol-popup:before {
top: 100%;
border: solid transparent;
content: " ";
height: 0;
width: 0;
position: absolute;
pointer-events: none;
}
.ol-popup:after {
border-top-color: white;
border-width: 10px;
left: 48px;
margin-left: -10px;
}
.ol-popup:before {
border-top-color: #cccccc;
border-width: 11px;
left: 48px;
margin-left: -11px;
}
.ol-popup-closer {
text-decoration: none;
position: absolute;
top: 2px;
right: 8px;
}
.ol-popup-closer:after {
content: "✖";
}
</style>
</head>
<body>
<div id="map"></div>
<div id="popup" class="ol-popup">
<a href="#" id="popup-closer" class="ol-popup-closer"></a>
<div id="popup-content"></div>
</div>
<script src="http://libs.baidu.com/jquery/2.1.4/jquery.min.js"></script>
<script src="./bundle.js"></script>
</body>
</html>
- Part of the core code, see the source demo download for the complete code
//Sector analog data
var baseStations = {
"rows": [{
"baseStationId": 3324020,
"baseStationName": "460-00-396906",
"longitude": 120.161,
"latitude": 30.29683,
"azimuth": null,
"frequencyPoint": 38950,
"bandIndication": 40,
"eci": 101607940
}, {
"baseStationId": 3324021,
"baseStationName": "460-00-396906",
"longitude": 120.16039,
"latitude": 30.29659,
"azimuth": null,
"frequencyPoint": 38950,
"bandIndication": 40,
"eci": 101607941
}, {
"baseStationId": 3324022,
"baseStationName": "460-00-396906",
"longitude": 120.161,
"latitude": 30.29683,
"azimuth": null,
"frequencyPoint": 38950,
"bandIndication": 40,
"eci": 101607947
},
......
]}

var container = document.getElementById('popup');
var content = document.getElementById('popup-content');
var closer = document.getElementById('popup-closer');


var overlay = new Overlay({
element: container,
autoPan: true,
autoPanAnimation: {
duration: 250
}
});

closer.onclick = function() {
overlay.setPosition(undefined);
closer.blur();
return false;
};


var vecsource = new VectorSource();
var veclayer = new VectorLayer({
source: vecsource,
style: function(feature) {
var info = feature.get("__info");
var bandIndication = info.bandIndication;
var text = info.baseStationName;
var color = "red";
switch (bandIndication) {
case 3: {
color = '#9891b3';
break;
}
case 8: {
color = '#90ad36';
break;
}
case 34: {
color = '#b97a57';
break;
}
case 38: {
color = 'red';
break;
}
case 39: {
color = 'green';
break;
}
case 40: {
color = 'blue';
break;
}
case 41: {
color = '#880015';
break;
}

}
return new Style({
stroke: new Stroke({
color: color,
width: 1
})
});
}
});

var view = new View({
//projection: 'EPSG:4326',
//center: [0, 0],
//zoom: 2
//center: [113.90271877, 22.95186415],
zoom: 13
})

var map = new Map({
target: 'map',
layers: [
new TileLayer({
source: new XYZ({
//url: 'https://{a-c}.tile.openstreetmap.org/{z}/{x}/{y}.png'
url: 'http://cache1.arcgisonline.cn/arcgis/rest/services/ChinaOnlineStreetPurplishBlue/MapServer/tile/{z}/{y}/{x}'
})
})
],
overlays: [overlay],
view: view
});

map.addLayer(veclayer);

loadbaseStations(baseStations);

map.getView().setCenter([13375119.498201383, 3545903.958818198]);
map.getView().setZoom(15);


//Listening to map mouse events
map.on('click',function(e) {

if (e.dragging) {
return;
}
var feature =map.forEachFeatureAtPixel(e.pixel,
function(feature) {
return feature;
});
if(feature){
var attribute = feature.get('__info');
var winObject=getWinContent(attribute);
var centerCoordinates=getCenterCoordinates(feature);
showGraphicWin(centerCoordinates,winObject.html,winObject.title);
}
})

/**Get the html template of the pop-up box
*@attribute
**/
function getWinContent(attribute){
var e = attribute;
var winHtml="";
var title = attribute.baseStationName;
winHtml = "<div style='width:300px;' id='inforwin_Container'>"+
"<table>"+
"<tr>"+
"<td style='width:20%'><label style='font-weight:normal;font-size:13px;'>Frequency point:</label></td>"+
"<td><label style='font-weight:normal;font-size:13px;'>"+attribute.frequencyPoint+ "</label></td>"+
"</tr>"+
"<tr>"+
"<td style='width:20%'><label style='font-weight:normal;font-size:13px;'>eci:</label></td>"+
"<td><label style='font-weight:normal;font-size:13px;'>"+attribute.eci+ "</label></td>"+
"</tr>"+
"<tr>"+
"<td style='width:20%'><label style='font-weight:normal;font-size:13px;'>longitude:</label></td>"+
"<td><label style='font-weight:normal;font-size:13px;'>"+attribute.longitude+ "</label></td>"+
"</tr>"+
"<tr>"+
"<td style='width:20%'><label style='font-weight:normal;font-size:13px;'>latitude:</label></td>"+
"<td><label style='font-weight:normal;font-size:13px;'>"+attribute.latitude+ "</label></td>"+
"</tr>"+
"</table>"+
"</div>";
return {'html':winHtml,'title':title};
}

/**
* Pop up bubble window
* @centerPoint centerPoint @ Map jump Center
* @html html @ Bubble window content template
* @title title @ Bubble window title
* **/
function showGraphicWin(centerPoint,html,title){
//DCI.BaseStationsLayer.popover.show(centerPoint, html, title);
content.innerHTML = html;
overlay.setPosition(centerPoint);
}

/**Get center point coordinates
* @feature Element {ol.feature}
* return {ol.coordinates}
* */
function getCenterCoordinates(feature){
var coord=new getCenter(feature.getGeometry().getExtent());
return coord;
}

function clearMap(){
//Hide bubble window
overlay.setPosition(undefined);
closer.blur();
}


function loadbaseStations(baseStations){
if(baseStations && baseStations.rows.length>0){
var len = baseStations.rows.length;
for(var i = 0;i<len;i++){
var record = baseStations.rows[i];
var feature = null;
var x = record.longitude;
var y = record.latitude;
if (isNaN(x) || isNaN(y)) return feature;
var geom = toSectorGeometry(record);
if (!geom) return feature;
record.id = record.id || record.eci;
feature = new Feature();
feature.setId(record.id);
feature.set("__info", record, true);
feature.setGeometry(geom);
veclayer.getSource().addFeature(feature);
}
}
}

function toSectorGeometry(record){
//Frequency band
var bandIndication = record.bandIndication;
var angle, r;
var azimuth = record.azimuth;
switch (bandIndication) {
case 3:
{
angle = 25;
r = 120;
break;
}
case 8:
{
angle = 20;
r = 150;
break;
}
case 34:
{
angle = 40;
r = 100;
break;
}
case 38:
{
angle = 60;
r = 60;
break;
}
case 39:
{
angle = 50;
r = 80;
break;
}
case 40:
{
//Azimuth is empty
if (isNaN(azimuth)) {
angle = 360;
r = 25;
azimuth = 0;
} else {
angle = 90;
r = 25;
}
break;
}
case 41:
{
angle = 60;
r = 60;
break;
}
}

var r = r / 111319.49079327358;
record["__geomR"] = r; //Radius used to draw geometry
var params = {
angle: angle,//included angle
direction: azimuth,
x: record.longitude,
y: record.latitude,
r: r
};
//Judgment is not a number
if (isNaN(params.angle) || isNaN(params.direction) || isNaN(params.x) || isNaN(params.y) || isNaN(params.r)) {
return null;
}
var angles = getAngles(params.angle, params.direction);

var rings = getRings([params.x, params.y], params.r, angles[0], angles[1], 30);
//Conversion between coordinate systems
if(rings.length>0){
for(var i=0;i<rings.length;i++){
var newCoord= transform(rings[i],'EPSG:4326','EPSG:3857');//From front coordinate system to back coordinate system
rings[i] = newCoord;
}
}
var polygon = new Polygon([rings]);
return polygon;
}
......