This technique is often used to track targets and needs to be converted into HSV color space
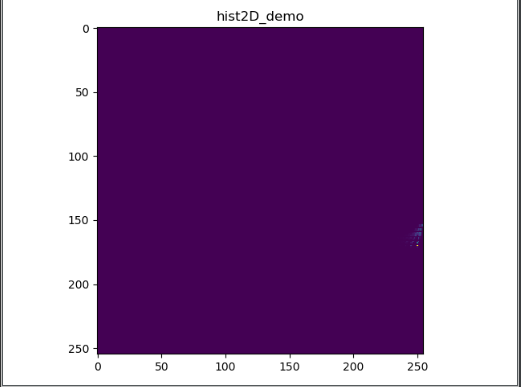
Create 2D histogram
import cv2 as cv
import numpy as np
from matplotlib import pyplot as plt


# Create 2D histogram
def hist2D_demo(img):
    hsv = cv.cvtColor(img, cv.COLOR_BGR2HSV)
    hist = cv.calcHist([hsv], [0, 1], None, [255, 255], [0, 180, 0, 255])
    plt.imshow(hist, interpolation='nearest')
    plt.title("hist2D_demo")
    plt.show()


src = cv.imread("./../img/1.jpg") # Read image

hist2D_demo(src)
cv.waitKey(0)
cv.destroyAllWindows()
calcHist description
- The first parameter must be enclosed in square brackets.
- The second parameter is the channel used to calculate the histogram.
- The third parameter is Mask, which is not used here, so use None.
- The fourth parameter is histSize, which indicates how many parts the histogram is divided into (i.e. how many square columns)
- The fifth parameter is the value of each pixel in the histogram, and [0.0, 256.0] means that the histogram can represent the pixel value from 0.0 to 256.
- Finally, there are two optional parameters. Since histogram is returned as function result, the sixth hist is meaningless (to be determined).
- The last accumulator is a Boolean value that indicates whether the histogram is superimposed.
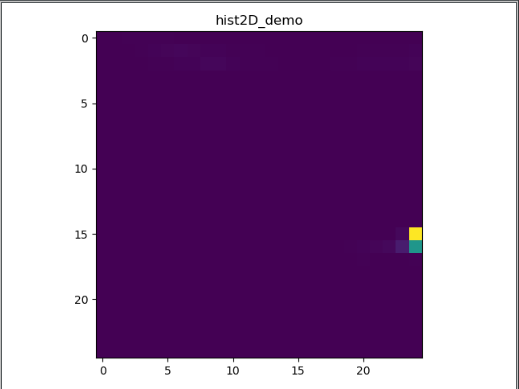
If change
hist = cv.calcHist([hsv], [0, 1], None, [25, 25], [0, 180, 0, 255])
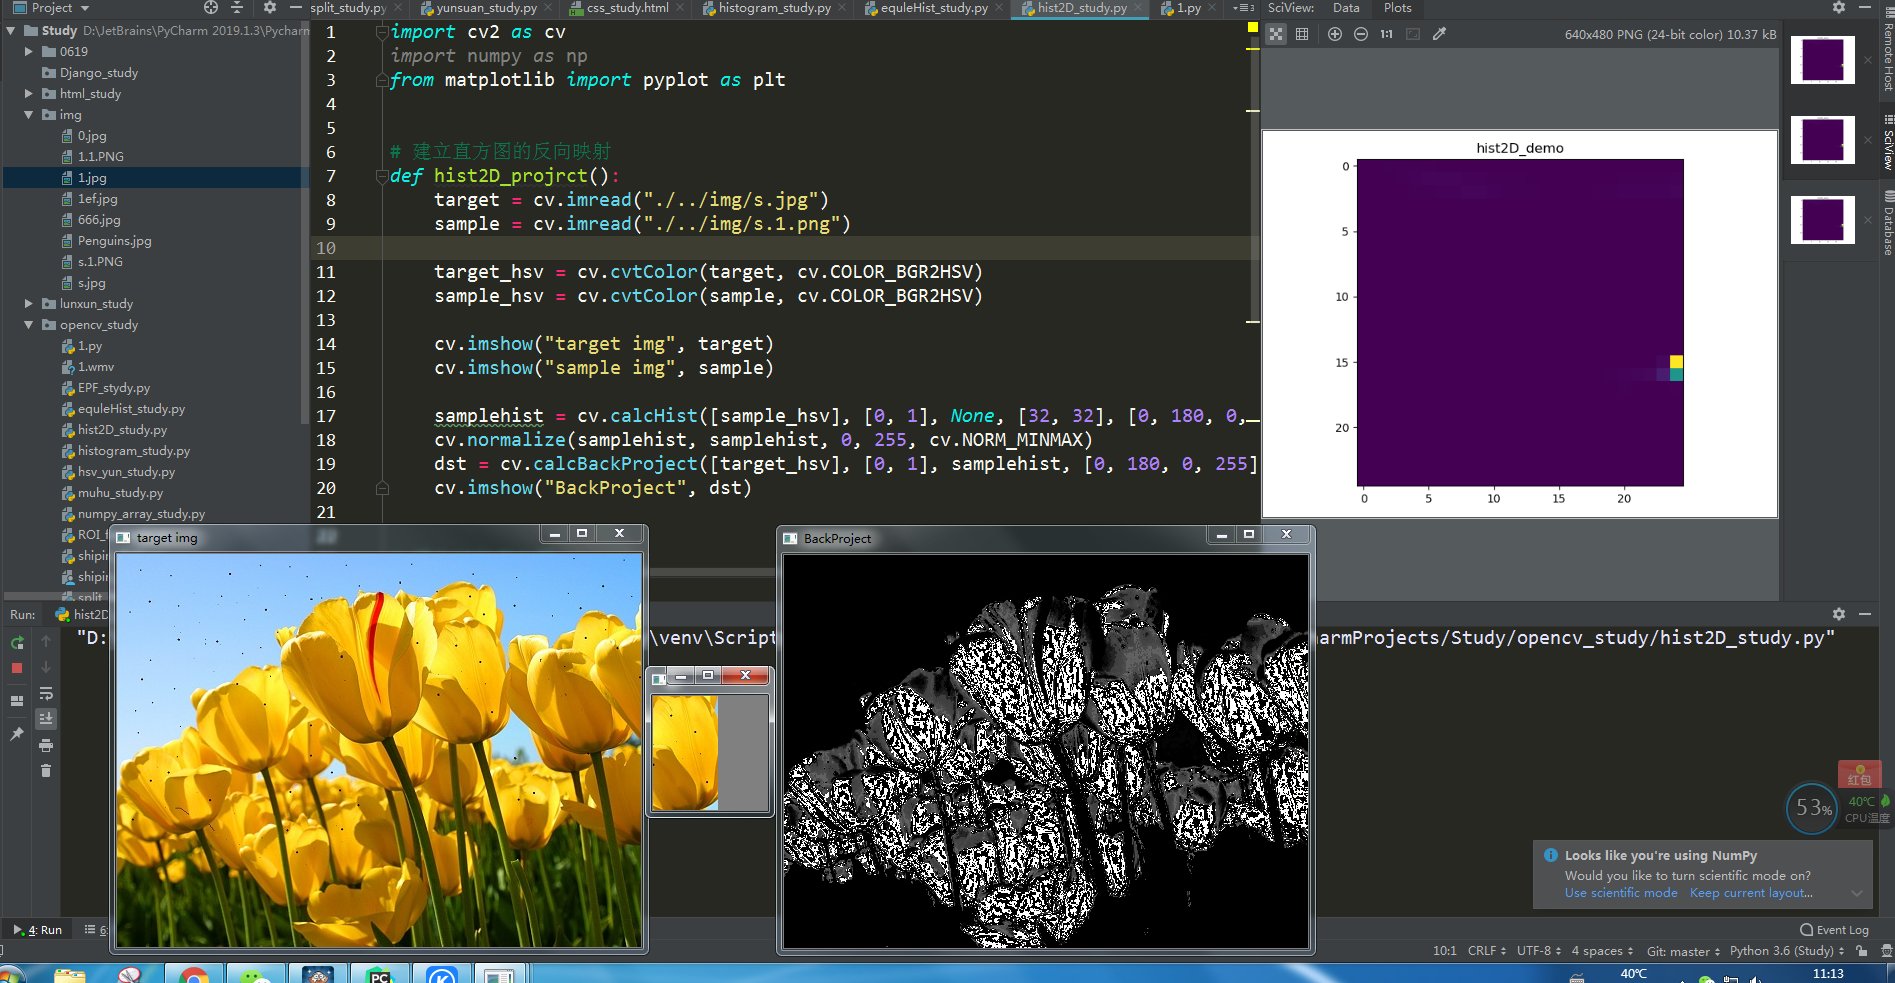
Back projection of histogram
import cv2 as cv
import numpy as np
from matplotlib import pyplot as plt


# Establish the inverse mapping of histogram
def hist2D_projrct():
    target = cv.imread("./../img/s.jpg")
    sample = cv.imread("./../img/s.1.png")

    target_hsv = cv.cvtColor(target, cv.COLOR_BGR2HSV)
    sample_hsv = cv.cvtColor(sample, cv.COLOR_BGR2HSV)

    cv.imshow("target img", target)
    cv.imshow("sample img", sample)

    samplehist = cv.calcHist([sample_hsv], [0, 1], None, [32, 32], [0, 180, 0, 255])
    cv.normalize(samplehist, samplehist, 0, 255, cv.NORM_MINMAX)
    dst = cv.calcBackProject([target_hsv], [0, 1], samplehist, [0, 180, 0, 255], 1)
    cv.imshow("BackProject", dst)


# Create 2D histogram
def hist2D_demo(img):
    hsv = cv.cvtColor(img, cv.COLOR_BGR2HSV)
    hist = cv.calcHist([hsv], [0, 1], None, [25, 25], [0, 180, 0, 255])
    plt.imshow(hist, interpolation='nearest')
    plt.title("hist2D_demo")
    plt.show()


src = cv.imread("./../img/1.jpg") # Read image

hist2D_demo(src)
hist2D_projrct()
cv.waitKey(0)
cv.destroyAllWindows()