This slag is writing BUG this morning. A problem has been thrown by TL. It is said that there is something wrong with the platform that makes me healthy. After an operation finds the error log, I'm foolishly out of memory error. I can also write this thing, but I haven't located it.
org.springframework.transaction.CannotCreateTransactionException: Could not open JPA EntityManager for transaction; nested exception is java.lang.OutOfMemoryError: Java heap space
	at org.springframework.orm.jpa.JpaTransactionManager.doBegin(JpaTransactionManager.java:446)
	at org.springframework.transaction.support.AbstractPlatformTransactionManager.getTransaction(AbstractPlatformTransactionManager.java:378)
	at org.springframework.transaction.interceptor.TransactionAspectSupport.createTransactionIfNecessary(TransactionAspectSupport.java:475)
Caused by: java.lang.OutOfMemoryError: Java heap space
So habitually opened Baidu. After reading some experience, I'm ready to start. The steps are as follows:
- First find the OO error snapshot under the server
- Use tools to analyze the causes of errors
- Locate the place where the exception occurs in combination with the code
Find error snapshot
Don't understand what heap dump looks like: https://www.jianshu.com/p/91ee6476848c
Mine is here
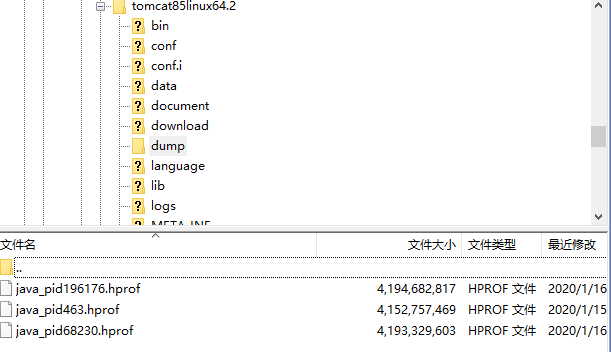
Of course, you can find it through the find command, usually in the tomcat directory
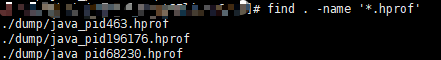
At the end of hprof is the target file
Use tool analysis
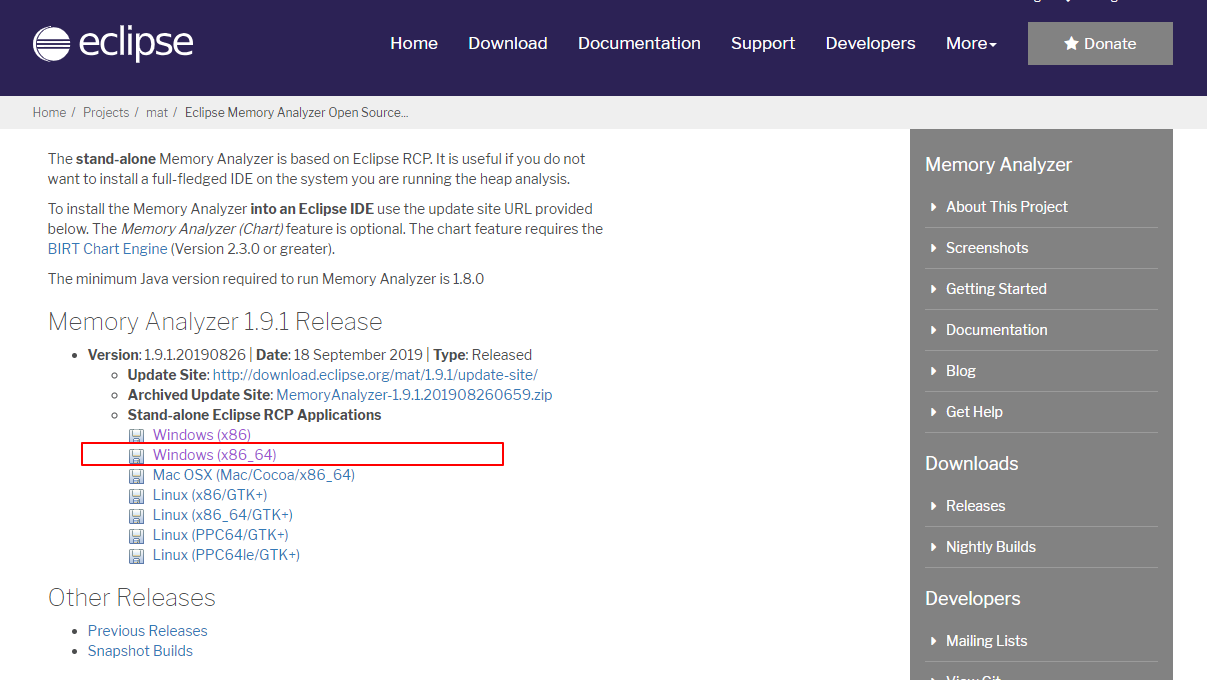
MemoryAnalyzer.exe
Download link: https://www.eclipse.org/mat/downloads.php (it is suggested to go online scientifically, about 70M)
After opening, import the snapshot file found in the previous step. Note that there may be a pit (generally, the snapshot file of online environment is always on G, so it is recommended to increase the maximum memory of the tool, as follows)
MemoryAnalyzer.ini file. My file is 4.1G, so it's larger.
-startup
plugins/org.eclipse.equinox.launcher_1.5.0.v20180512-1130.jar
--launcher.library
plugins/org.eclipse.equinox.launcher.win32.win32.x86_64_1.1.700.v20180518-1200
-vmargs
-Xmx5096m
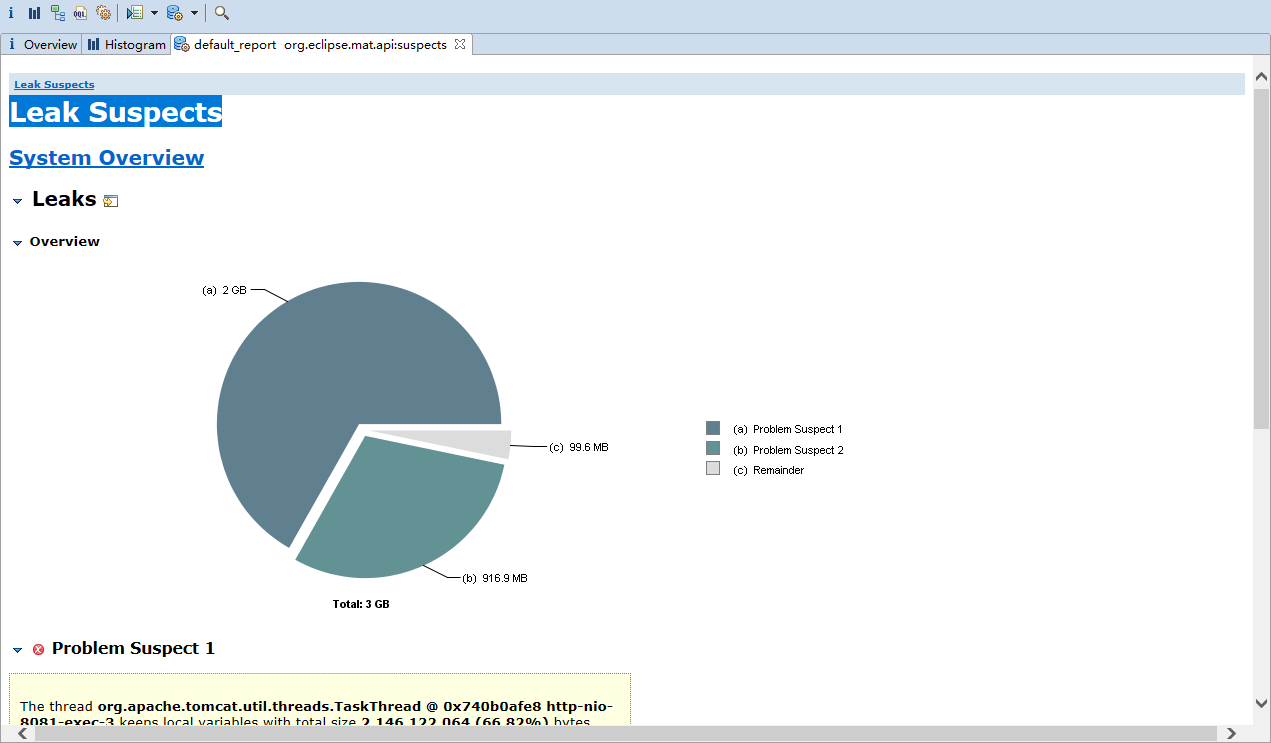
After importing successfully, you will go to the welcome interface. Just ignore it. Click the leaksuspects generated by analysis, as shown in the figure:
Histogram is commonly used:
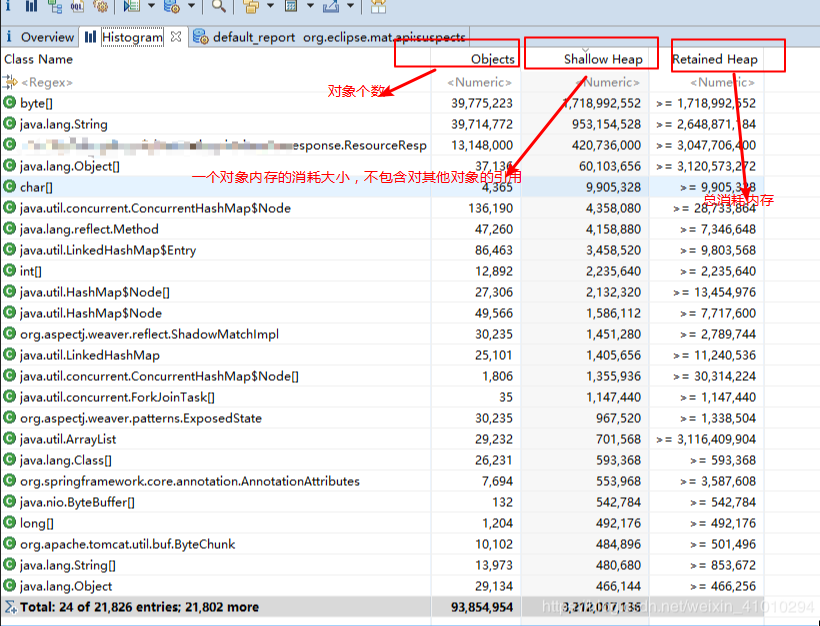
Memory consumption ranking is also helpful for positioning. There is an error message at the bottom of the pie chart, which is generated automatically. It mainly shows the high memory consumption, which means that your problem is here.
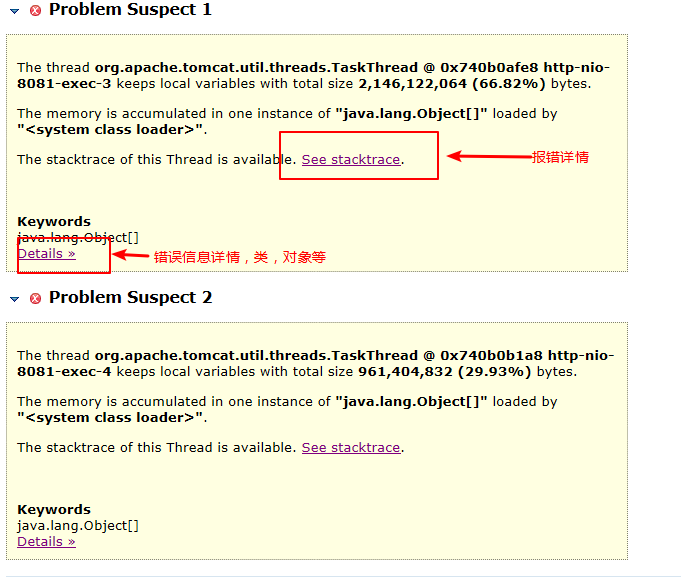
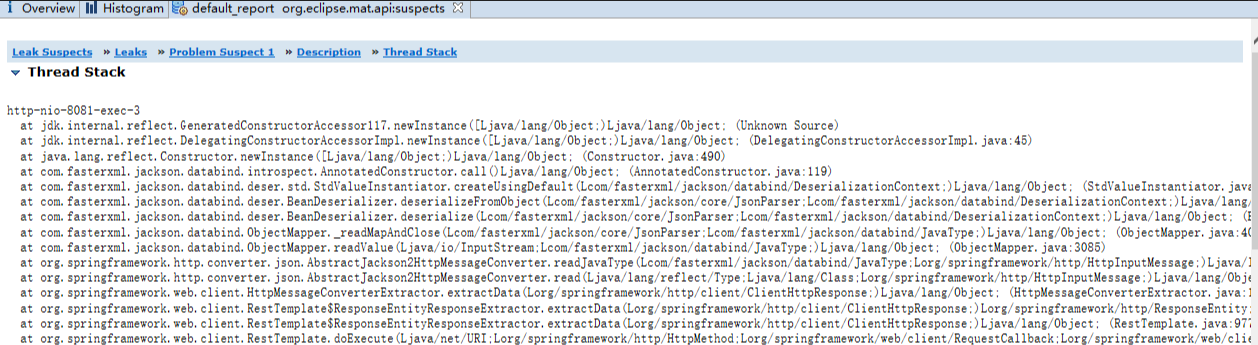
First, look at the stack information to find the error reporting place. Here is the specific error reporting method information (I didn't cut all):
Let's see what is caused by the object. Click details
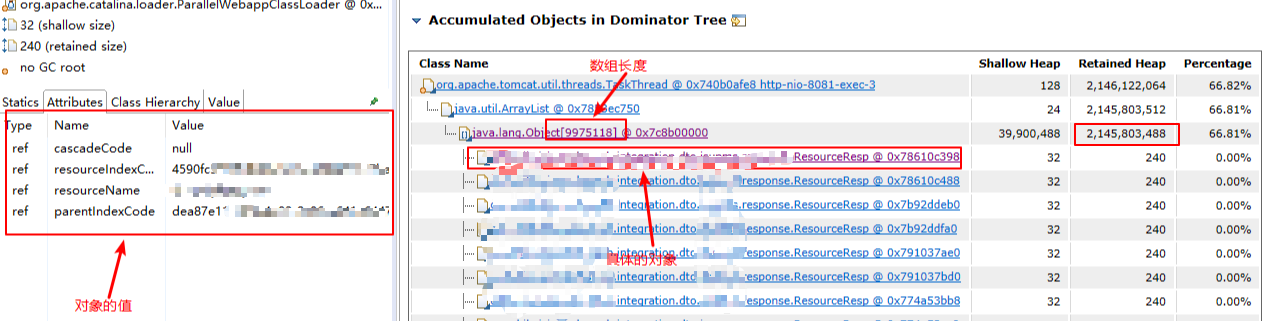
You can see that there are nearly 10 million objects in total, and the later memory is also used. Then you can find them in the code at this step.
Lookup code
 @Override
    public List<ResourceResp> queryResources(ResourcesVerifyReq resourcesVerifyReq) {
        try {
            ResponseData responseData;
            long total = 1001;
            HashMap<String, Object> queryParam = new HashMap<>(8);
            int pageNo = resourcesVerifyReq.getPageNo();
            queryParam.put("pageNo", pageNo);
            int pageSize = resourcesVerifyReq.getPageSize();
            queryParam.put("pageSize", pageSize);

            if (pageSize > 0) {
                responseData = RpcExchange.call(rpcParamDto,  queryParam,  Constants.HTTP_WEB_PORT);
            } else {
                pageSize = 1000;
                queryParam.put("pageSize", pageSize);
                while ((long) pageNo * (long) pageSize < total) {
                    responseData = RpcExchange.call(rpcParamDto, queryParam,  Constants.HTTP_WEB_PORT);
                    List<ResourceResp> list = data.getList();
                    total = data.getTotal();
                    returnData.addAll(list);
                }
            }
            return returnData;
        } catch (Exception e) {
            logger.error("Resource query error",e);
        }
    }
//I'm sure that when you see this while loop, you are also shocked. It turns out that when the total is greater than 1000 after query, there will be a dead loop here. The reason is that pageNo does not perform incremental operation when paging to query.
Amend to read:
while ((long) pageNo * (long) pageSize < total) {
                    responseData = RpcExchange.call(rpcParamDto, queryParam,  Constants.HTTP_WEB_PORT);
                    List<ResourceResp> list = data.getList();
                    total = data.getTotal();
                    returnData.addAll(list);
                    // When it is greater than 1000, it needs to be incremented
                    queryParam.put("pageNo", ++pageNo);
                }
The summary is as follows:
//1. When writing a loop, try to consider whether the number of times is clear, whether the termination conditions are fixed, be careful of the dead loop, be careful of the dead loop, and be careful of the dead loop
 //2. When positioning OOM, don't panic. Tools do a lot of work for us, but you need to be able to use them. I just used my fur
 //3. During the review, pay more attention to the places that may lead to the dead cycle
 //4. The orientation of OOM and other powerful tools need to be contacted more

