On prometheus client golang
Including type elaboration + interface example + source code excerpt
Original link
Prometheus:
What is prometheus? There are many articles on the Internet. For the deployment and startup of prometheus, please refer to This link . prometheus provides an http interface for users. Users can use PromQl to query from prometheus through get or post. prometheus http api delivery
Example: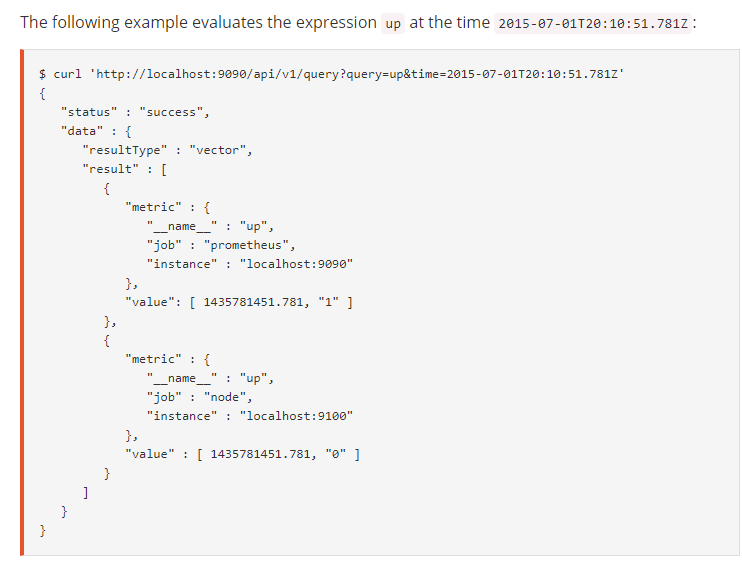
There are four types of Client golang:
counter
Counter, and can only grow and reset. For example: the total number of visits to a website, the running time of the machine
gauge
The measured value, or the instantaneous recorded value, can be increased or decreased. For example: the number of simultaneous viewers of a video, the number of currently running processes
histogram
- Histogram, a histogram will generate three indicators, namely, count, sum and bucket. For the time being, in order to understand it better, we first understand "sum" as "Gauge", and then "count" as the total number of times to modify the Gauge value. The "bucket" index is divided into several buckets, and the modified value is put into the bucket, but the value will be divided into several levels, into different buckets. The number of buckets in each bucket is the vertical coordinate of the histogram (the actual situation is all buckets before this bucket The number of faces is the vertical coordinate of the barrel), and the division condition of the barrel is the horizontal coordinate.
- As an example, we have 1000 iron balls of different sizes, with masses ranging from 1kg to 100kg. Suppose I divide them into five buckets, each of which stores different masses of iron balls. The first bucket is 0-20kg, the second one is 20-40kg, and so on. Then 1000 iron balls are the count of histogram, and the total mass of 1000 iron balls is the sum of histogram. Then the bucket is the five buckets. Of course, the rules of buckets can be designed. Each of the five buckets is 0-20, 20-40 It's the abscissa, and the number in each bucket is the ordinate. According to these data, a histogram can be formed.
- Because histogram can distinguish the quality of data, examples of histogram application are: response time of page, delay of a piece of business code
- A good example: Portal
- The new contact may be muddled, but it's not too complicated. It's suggested to practice more.
summary
- In summary, summary and histogram are similar to each other in generating three indicators: count, sum, and {quantity}. Count and sum have the same concept as histogram. Quantity means quantile. We all know the median. Then the median is actually a quintile, and summary can specify many quantiles, such as five score, nine score, and nine nine score. The concept of nine score is that the number smaller than this number accounts for 90%.
- summary and histogram can be used to describe page response time, but the difference is that histogram can easily see the long tail value. For example, in voting, the highest score is removed and the lowest score is removed. The long tail value affects the average value very much. All histograms can easily analyze the problem data. summary can find out the percentage of page response time and analyze the overall situation of page response time.
compare
- Both summary and histogram are easy to see the average (i.e., "sum /" count "), but histogram is easy to find the extreme value that affects the average, and histogram can get the quantile directly, and the two structures can be chosen by the developer according to the data demand.
- The quantile of histogram is directly calculated by clinet go, while the quantile of summary can be calculated by developers, or by calling the api of prometheus to obtain the quantile of histogram and the processing function of prometheus Portal.
Four types of interfaces (go):
The following pictures can be transferred:
Counter
counter.Inc(), counter.Add(123)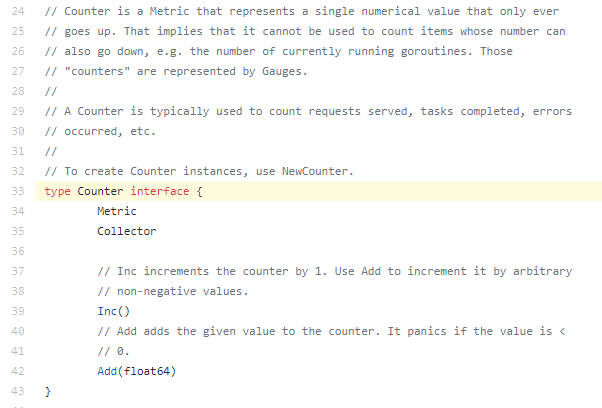
Gauge
gauge.Set(), gauge.Inc(), gauge.Dec(), gauge.Add(123) , gauge.Sub(321)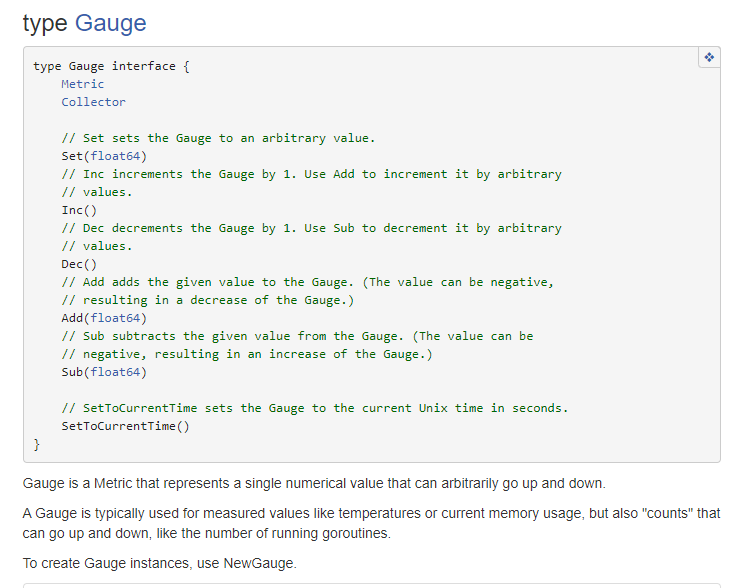
Histogram
histogram.Observer(123) / / add this data to this histogram instance (make it observe)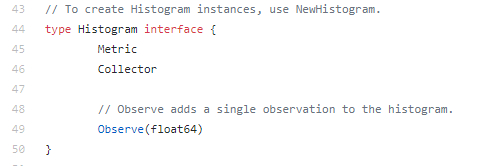
Summary
summary.Observer(123)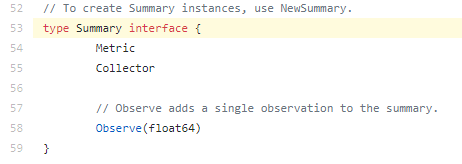
Common interface
    type Metric interface {
        //Get the description of this metric
        Desc() *Desc
        //Convert to Metric in proto format, return
        Write(*dto.Metric) error //dto "github.com/prometheus/client_model/go"
    }
Four types of use:
The code of client golang is safe, using the read-write lock and CAS atomic operation under the sync Library
    package main
    //It's not pseudocode. You can go run directly

    import (
        "net/http"
		"time"
		"log"
		"math"
        "github.com/prometheus/client_golang/prometheus"
        "github.com/prometheus/client_golang/prometheus/promhttp"
    )

    var (
        MyTestCounter = prometheus.NewCounter(prometheus.CounterOpts{
                                        //Because the Name cannot be duplicate, the recommended rule is: "department Name business Name module Name scalar Name type"
            Name: "my_test_counter",	//Unique id, can't repeat Register(), can Unregister()
            Help: "my test counter",	//Description of this Counter
		})
		MyTestGauge = prometheus.NewGauge(prometheus.GaugeOpts{
			Name: "my_test_gauge",
			Help: "my test gauge",
		})
		MyTestHistogram = prometheus.NewHistogram(prometheus.HistogramOpts{
			Name: "my_test_histogram",
			Help: "my test histogram",
			Buckets: prometheus.LinearBuckets(20, 5, 5), //There are 20 first barrels, 5 intervals for each barrel, 5 barrels in total. So 20, 25, 30, 35, 40
		})
		MyTestSummary = prometheus.NewSummary(prometheus.SummaryOpts{
			Name: "my_test_summary",
			Help: "my test summary",
			Objectives: map[float64]float64{0.5: 0.05, 0.9: 0.01, 0.99: 0.001}, //Return five, nine, nine
		})
    )

    func main() {

        //Cannot register Metrics with the same Name more than once
        //MustRegister registration failure will directly panic(), if you want to capture error, it is recommended to use Register()
		prometheus.MustRegister(MyTestCounter)
		prometheus.MustRegister(MyTestGauge)
		prometheus.MustRegister(MyTestHistogram)
		prometheus.MustRegister(MyTestSummary)

        go func(){
			var i float64
            for {
				i++
				MyTestCounter.Add(10000)   //Constant added each time
				MyTestGauge.Add(i)		   //Increment each time
				MyTestHistogram.Observe(30 + math.Floor(120*math.Sin(float64(i)*0.1))/10)  //Observe a quantity of 18 - 42 at a time
				MyTestSummary.Observe(30 + math.Floor(120*math.Sin(float64(i)*0.1))/10)

                time.Sleep(time.Second)
            }
        }()
        http.Handle("/metrics", promhttp.Handler())
	    log.Fatal(http.ListenAndServe("0.0.0.0:8080", nil))//Multiple processes cannot listen to the same port
    }
Let's take a look at the instantaneous value (after running, enter curl 127.0.0.1:8080/metrics in the console to get metrics):
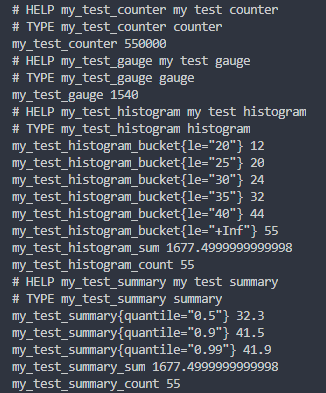
- Let's focus on histogram ﹐ bucket, le = "20", representing 12 values of 0-20, le = "25", representing 20 values of 0-25, le="+Inf", representing a total of 55 values, which is the same as histogram. If you want to calculate the number of 30-35 values, you need to use le = "35" - le="30" to obtain.
- Summary {quantity = "0.5"}, representing instantaneous, median 32.3, summary {quantity = "0.9"}, and nine scores 41.5.
- The average number of histogram is sum/count = 1677.5/55 = 30.5
- The average of summary is sum/count = 1677.5/55 = 30.5, because the two of them have the same value each time, so the average must be the same. Through the above data, it is estimated that the readers should have an understanding of their differences.
Put on some diagrams of prometheus, which is easy to understand:
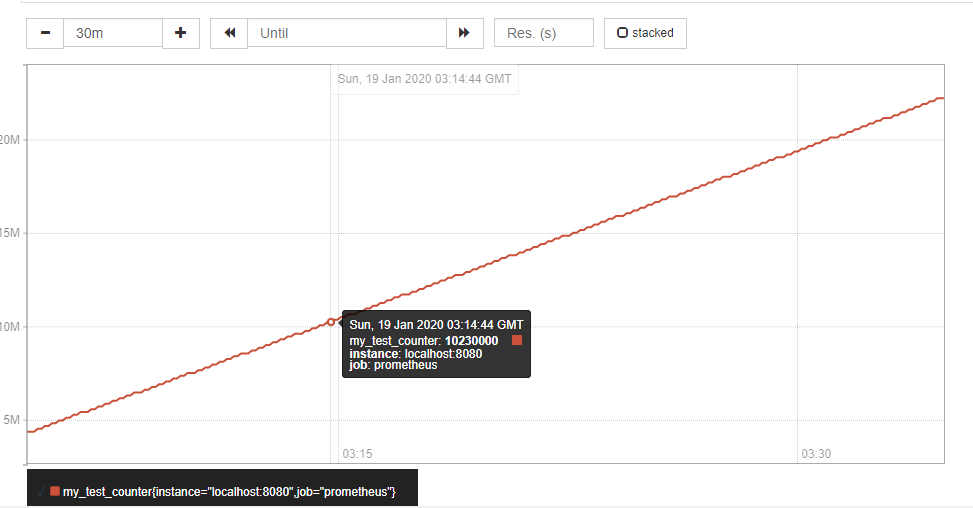
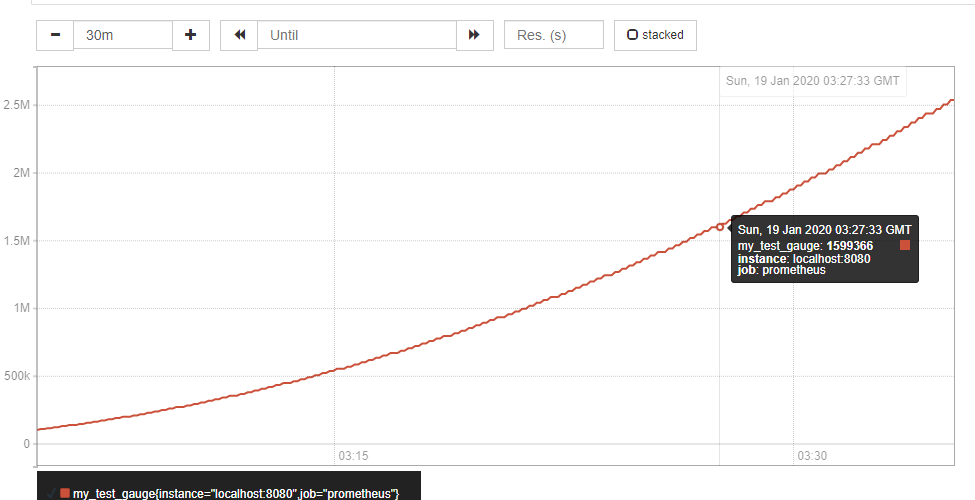
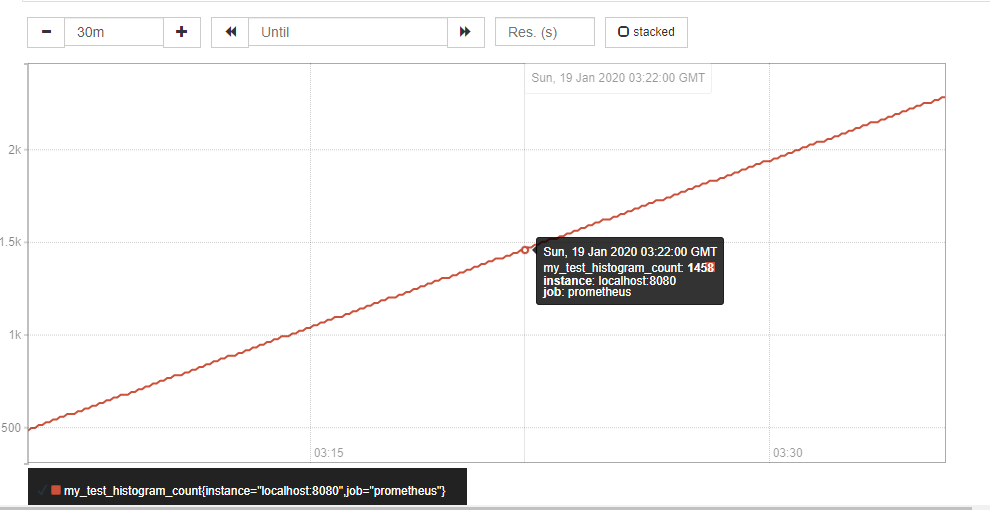
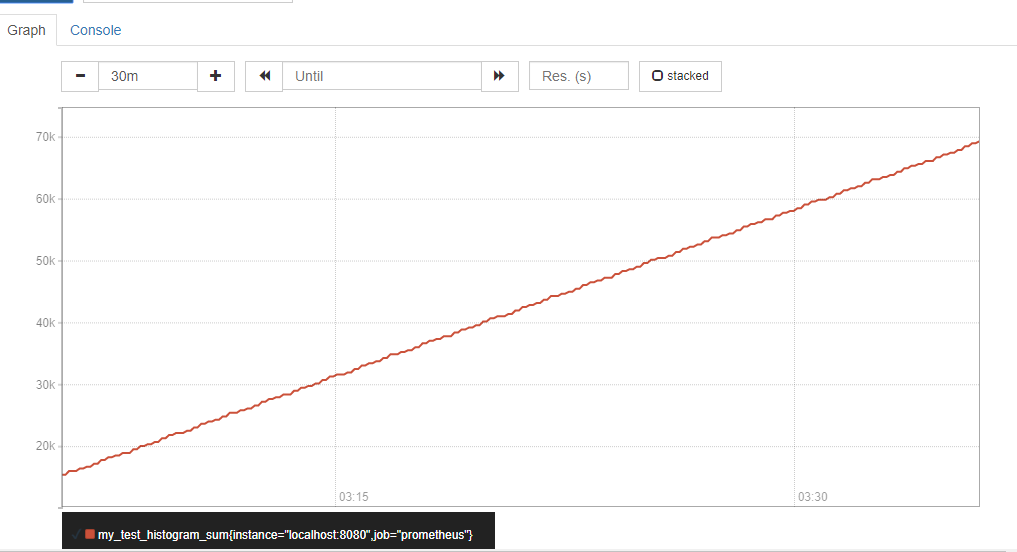
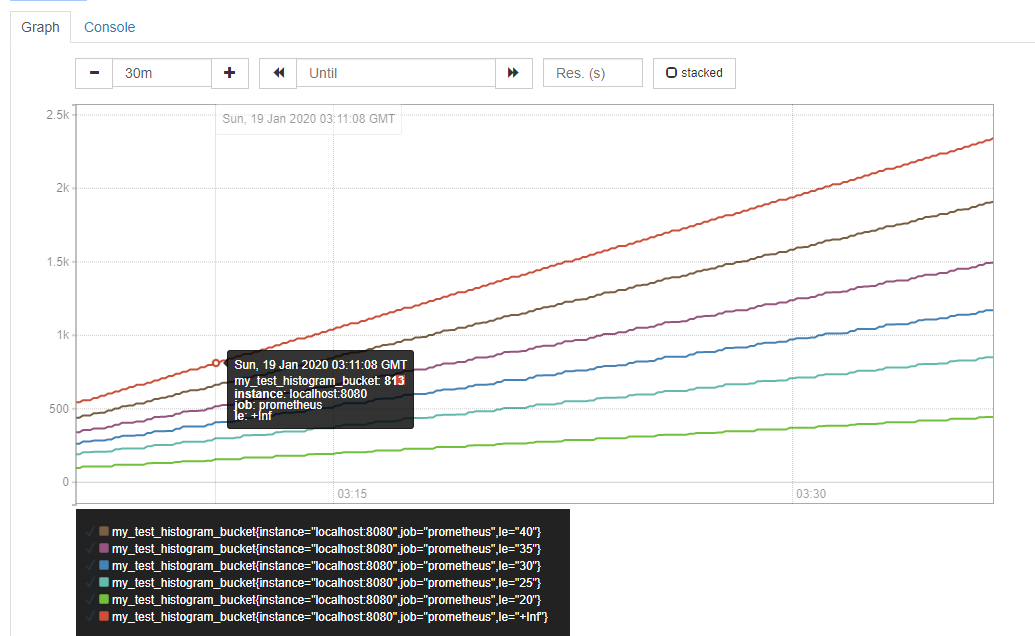
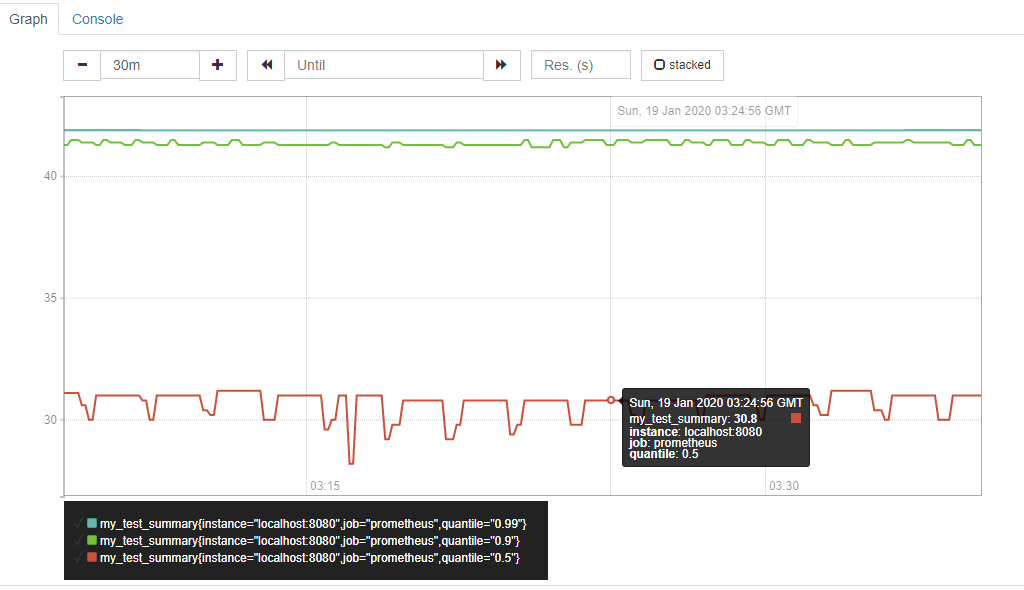
The image is jagged because prometheus synchronizes data every 15s by default
Vector type and its provided interface:
Whether it's counter, gauge, histogram or summary, it has its own array form, which we can use directly.
The following is the interface provided by client go for all operations on the array.
    //metricVec implements the specific structure and interface, which is provided for four types of array calls. Some interfaces are not provided to users
    //Located at github.com/prometheus/client/golang/prometheus/vec.go
    type metricVec struct {
        *metricMap
        curry []curriedLabelValue

        hashAdd     func(h uint64, s string) uint64
        hashAddByte func(h uint64, b byte) uint64
    }

    //Delete the matched labels. If the deletion is successful, true will be returned. If it is not found, false will be returned. This is not an error
    //The difference between the two:
    //  Delete usage: vec.Delete(Labels{"l1": "v1", "l2": "v2"})
    //  DeleteLabelValues usage: vec.DeleteLabelValues("v1", "v2")
    //If there is a problem with the order of the latter parameters, false is returned, while the former does not
    //But the cost of the former is greater than that of the latter, because the former needs to build Labels mapping
    func (m *metricVec) DeleteLabelValues(lvs ...string) bool{}
    func (m *metricVec) Delete(labels Labels) bool {}


    type Observer interface {
        Observe(float64)
    }

    //XXX needs to use counter, gauge, histogram and summary instead
    //The following interfaces are implemented in counter.go, gauge.go, histogram.go, summary.go
    type XXXVec struct {
        *metricVec
    }

    //An array instance, such as NewCounterVec, will be returned, and a * CounterVec will be returned,
    //Note that during the call, the bucket of Histogtam cannot have "Le", and the quantity of summary cannot have "quantity", otherwise, painc()
    func NewXXXVec(opts XXXOpts, labelNames []string) *XXXVec{}

    //If CounterVec, TTT is Counter, gagevec, TTT is Gauge, Histogram and Summary, TTT is Observer

    //Get Counter,Gauge,Histogram or Summary. If it exists, return it. If it does not exist, create it. If the name is the same and the description is different, return error.
    //Usage:
    //  vec.GetMetricWith(Labels{"l1": "v1", "l2": "v2"})
    //  vec.GetMetricWithLabelValues("v1", "v2")
    //It is easy to cause errors or inaccessibility due to sequence problems, so it is recommended to use the former, but the former will cause additional consumption
    //If we just want to get, if we can't get it and don't create a new one, then we can't do it, but we'd better not save the returned instance. If consumption is considered, Delete can also be used to remove it
    func (v *XXXVec) GetMetricWith(labels Labels) (TTT, error){}
    func (v *XXXVec) GetMetricWithLabelValues(lvs ...string)(TTT, error){}

    //must form of GetMetricWith and GetMetricWithLabelValues respectively
    //That is, if there is an error, panic() will not return error
    //It is not recommended to use the "must" form, because we feel that our own ability to deal with errors is still necessary, even if we catch an error and do the same thing with it
    func (v *XXXVec) WithLabelValues(lvs ...string) TTT{}
    func (v *XXXVec) With(labels Labels) TTT{}

    //CurryWith will match according to the incoming labels and return the form of xxxVec, which is not an array type!
    //To return the child xxxVec
    //Note that do not perform for range on the return value, because it is not an array, and the values and methods in it are not public.
    //Possible usage:
    //  TestHistogramVec := NewHistogramVec(HistogramVecOpts{
    //      Name : "test_name",
    //      Help : "test_help",
    //      Buckets: prometheus.LinearBuckets(20, 5, 5),
    //  },[]string{"color","size","weight"})
    //  TestHistogramVecSon := CurryWith("color":"black")
    func (v *XXXVec) CurryWith(labels Labels) (TTTVec, error){}
    //Cust form of CurryWith, with exception direct panic()
    func (v *XXXVec) MustCurryWith(labels Labels) TTTVec{}
Use of arrays:
 package main

    import (
        "net/http"
		"time"
		"log"
		"math"
		"github.com/prometheus/client_golang/prometheus"
        "github.com/prometheus/client_golang/prometheus/promhttp"
    )

    var (
		MyTestHistogramVec = prometheus.NewHistogramVec(prometheus.HistogramOpts{
			Name: "human_weight_histogram",
			Help: "human weight histogram",
			Buckets: prometheus.LinearBuckets(1, 10, 15), //The first bucket starts from 1, each bucket is separated by 10, a total of 15 buckets. So 1,11,21,31,..., 141
		},[]string{"sex","age","race"},)
    )

    func main() {
		prometheus.MustRegister(MyTestHistogramVec)
        go func(){
			var i float64
            for i < 20 {
                //Don't pay too much attention to the value of Fu. Write it casually, mainly to understand the usage
				MyTestHistogramVec.With(prometheus.Labels{"sex":"man","age":"20","race":"black"}).Observe(90 + math.Floor(400*math.Sin(float64(i*127)*0.1))/10)
				MyTestHistogramVec.With(prometheus.Labels{"sex":"woman","age":"20","race":"black"}).Observe(70 + math.Floor(400*math.Sin(float64(i*127)*0.1))/10)
				MyTestHistogramVec.With(prometheus.Labels{"sex":"man","age":"25","race":"black"}).Observe(95 + math.Floor(400*math.Sin(float64(i*127)*0.1))/10)
				MyTestHistogramVec.With(prometheus.Labels{"sex":"woman","age":"25","race":"black"}).Observe(95 + math.Floor(400*math.Sin(float64(i*127)*0.1))/10)
				MyTestHistogramVec.With(prometheus.Labels{"sex":"man","age":"20","race":"yellow"}).Observe(90 + math.Floor(400*math.Sin(float64(i*127)*0.1))/10)
				time.Sleep(time.Second)
				i++
			}
		}()

        http.Handle("/metrics", promhttp.Handler())
	    log.Fatal(http.ListenAndServe("0.0.0.0:8080", nil)
    }
Take a look at the results
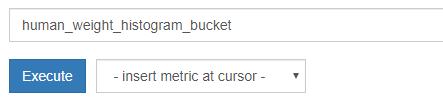
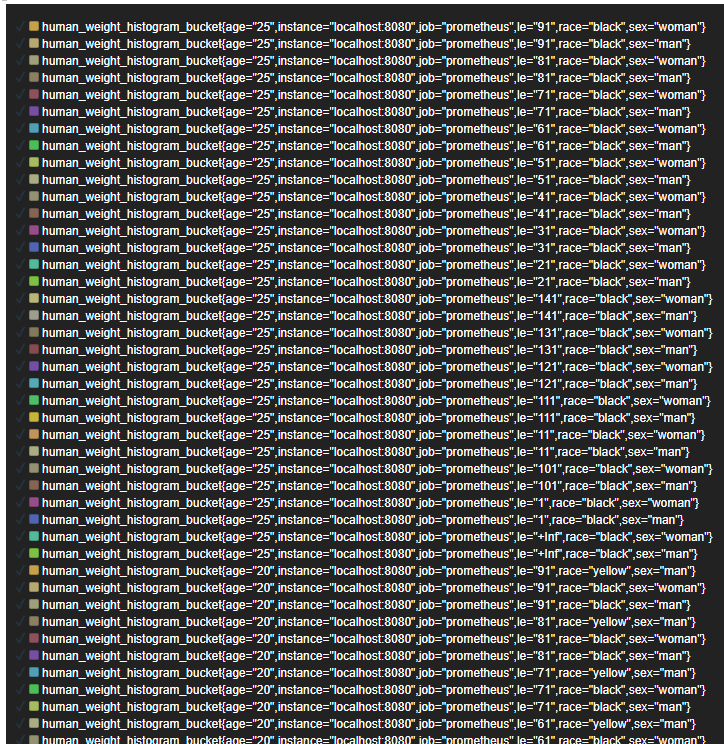
As you can see, there are too many
Let's filter the results
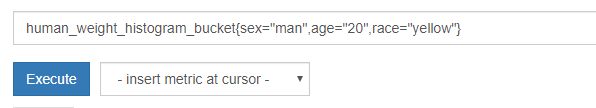
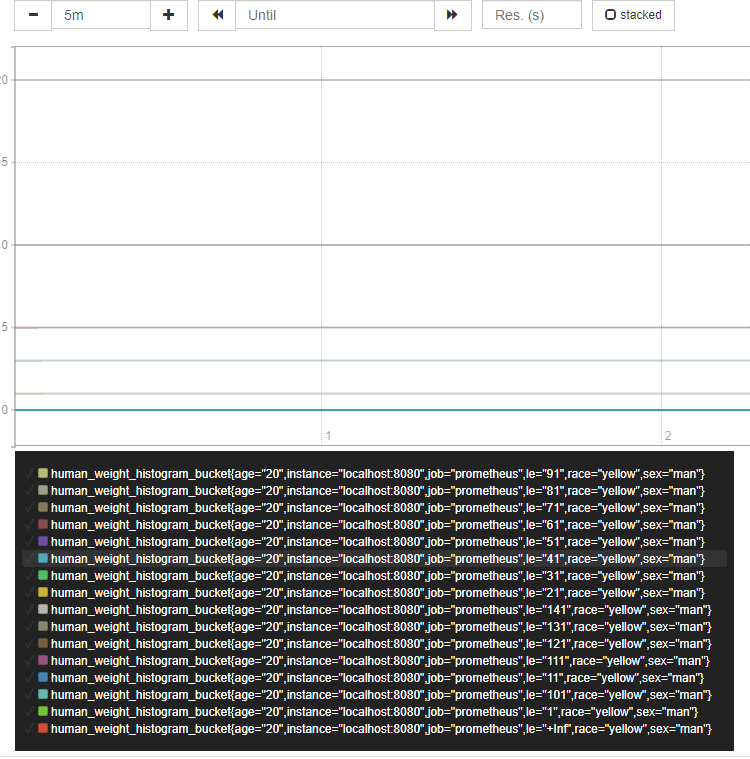
So you can filter the array, or the Histogram, or the Summary
promauto:
If you are a lazy person and do not want to go to the manual Registor(), promauto provides this method.
     import (
             "github.com/prometheus/client_golang/prometheus"
             "github.com/prometheus/client_golang/prometheus/promauto"
     )
     //At this time, you don't need to call the method with the word register. Except unregister!
     //But because promauto calls mustregister (xxx), if there is a problem with registration, it will directly panic()
     var histogram = promauto.NewHistogram(prometheus.HistogramOpts{
             Name:    "random_numbers",
             Help:    "A histogram of normally distributed random numbers.",
             Buckets: prometheus.LinearBuckets(-3, .1, 61),
     })
    //See the implementation of two promauto s
    func NewCounterFunc(opts prometheus.CounterOpts, function func() float64) prometheus.CounterFunc {
        g := prometheus.NewCounterFunc(opts, function)
        prometheus.MustRegister(g)
        return g
    }

    func NewSummary(opts prometheus.SummaryOpts) prometheus.Summary {
        s := prometheus.NewSummary(opts)
        prometheus.MustRegister(s)
        return s
    }
    func NewHistogramVec(opts prometheus.HistogramOpts, labelNames []string) *prometheus.HistogramVec {
        h := prometheus.NewHistogramVec(opts, labelNames)
        prometheus.MustRegister(h)
        return h
    }
Timer:
    //So much for the original
    package prometheus
    import "time"
    // Timer is a helper type to time functions. Use NewTimer to create new
    // instances.
    type Timer struct {
        begin    time.Time
        observer Observer
    }

    //  This form is usually used to Observe the run time of a function
    //  Tested, very easy to use
    //    func TimeMe() {
    //        timer := NewTimer(myHistogram)
    //        defer timer.ObserveDuration()
    //        // Do actual work.
    //    }
    func NewTimer(o Observer) *Timer {
        return &Timer{
            begin:    time.Now(),
            observer: o,
        }
    }

    func (t *Timer) ObserveDuration() time.Duration {
        d := time.Since(t.begin)
        if t.observer != nil {
            t.observer.Observe(d.Seconds())
        }
        return d
    }
Finally, some document links on the Internet are provided
https://godoc.org/github.com/prometheus/client_golang/prometheus
https://ryanyang.gitbook.io/prometheus/
https://s0prometheus0io.icopy.site/docs/introduction/overview/

