Main references: https://www.jianshu.com/p/c2b589170379
ECharts is an open-source framework developed and provided by Baidu, which is mainly provided for the use of the Web. Therefore, WebView is generally used in Android to load the display. In fact, WebView is essentially used to load the local H5.
Basic configuration
Download Plug-in:
Download on official website:
https://echarts.apache.org/zh/download.html
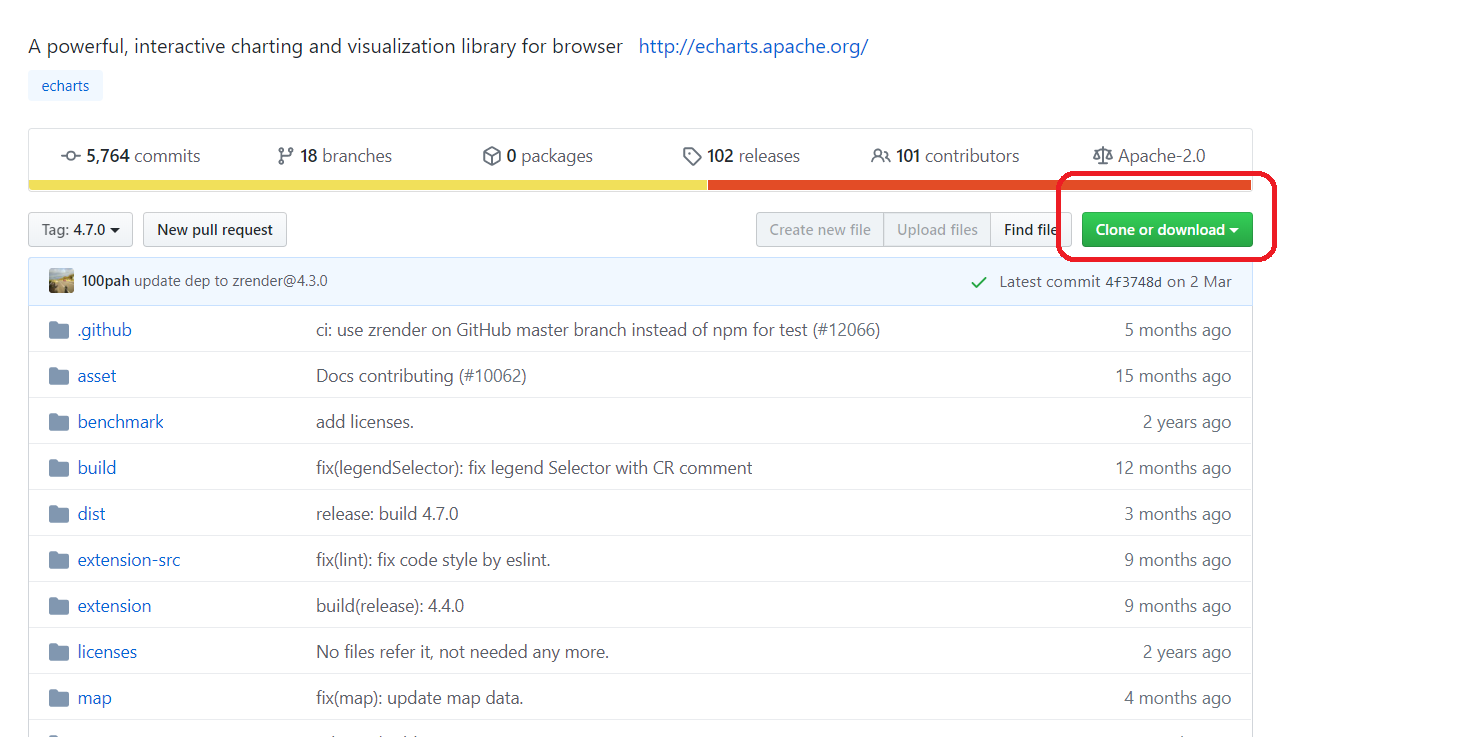
git Download
https://github.com/apache/incubator-echarts/tree/4.7.0/
I downloaded it from git
download
After downloading, create a new libs folder in the main directory, and find it in the download file echarts.min.js Files, copying to libs
incubator-echarts-4.7.0\incubator-echarts-4.7.0\dist\echarts.min.js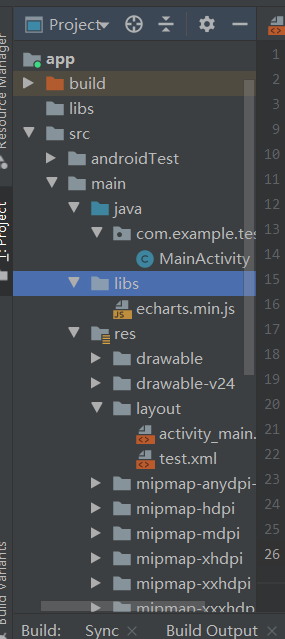
Add ecrats dependency:
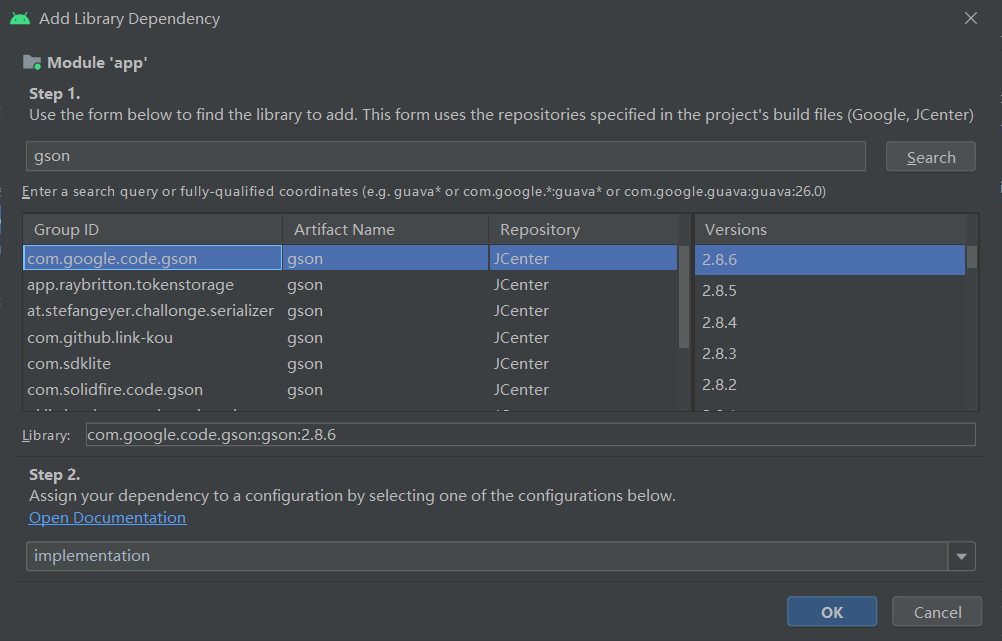
ctrl+shift+alt+s
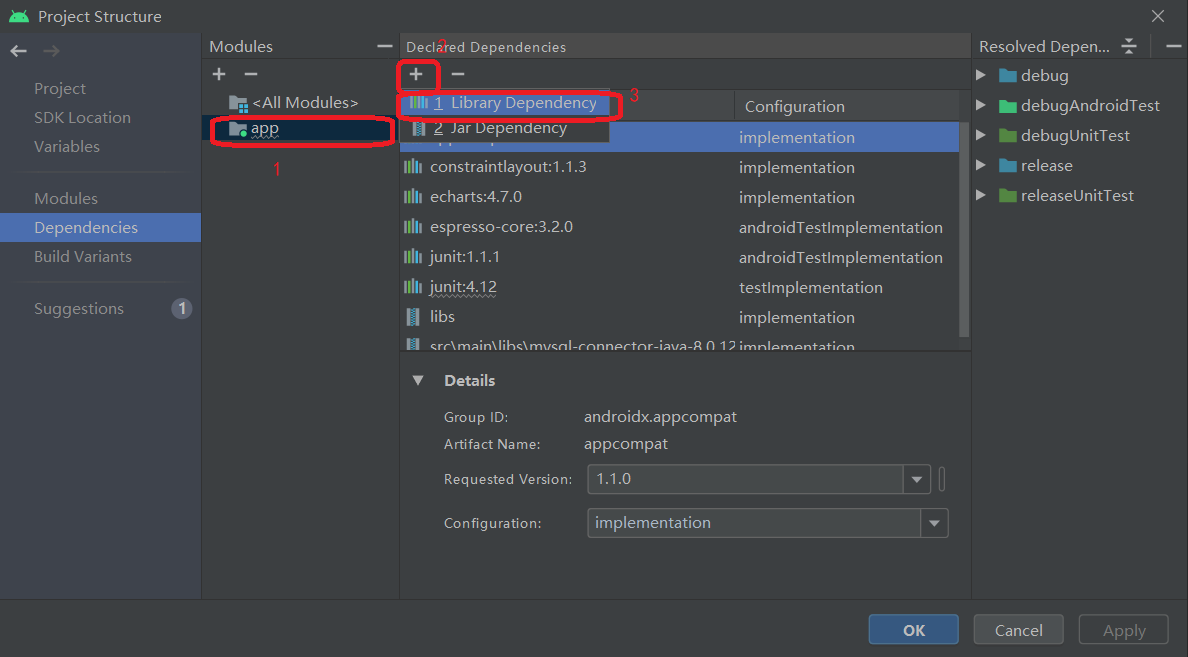
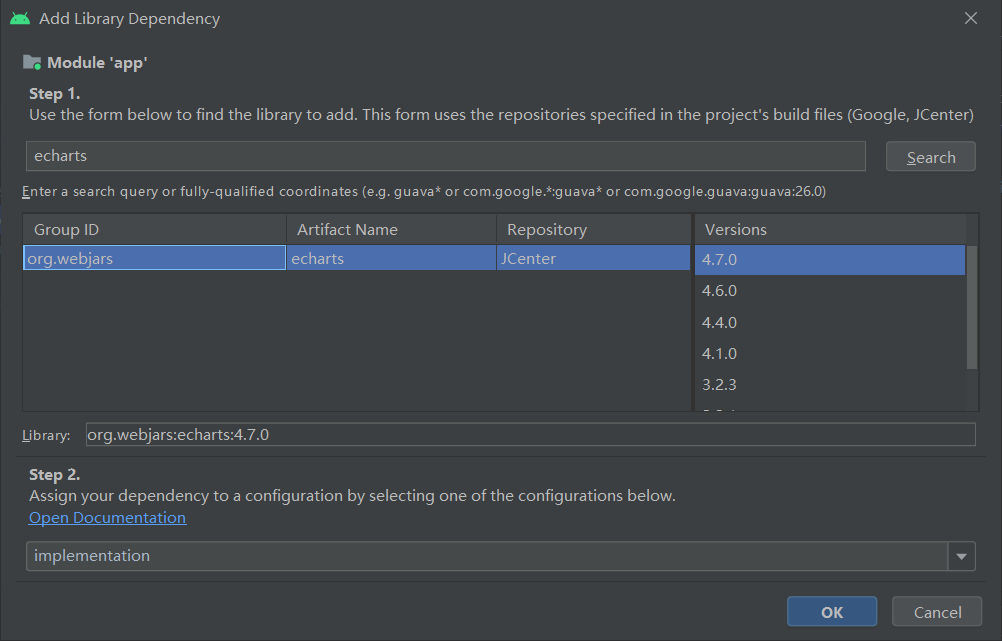
After the dependency is added, it will appear: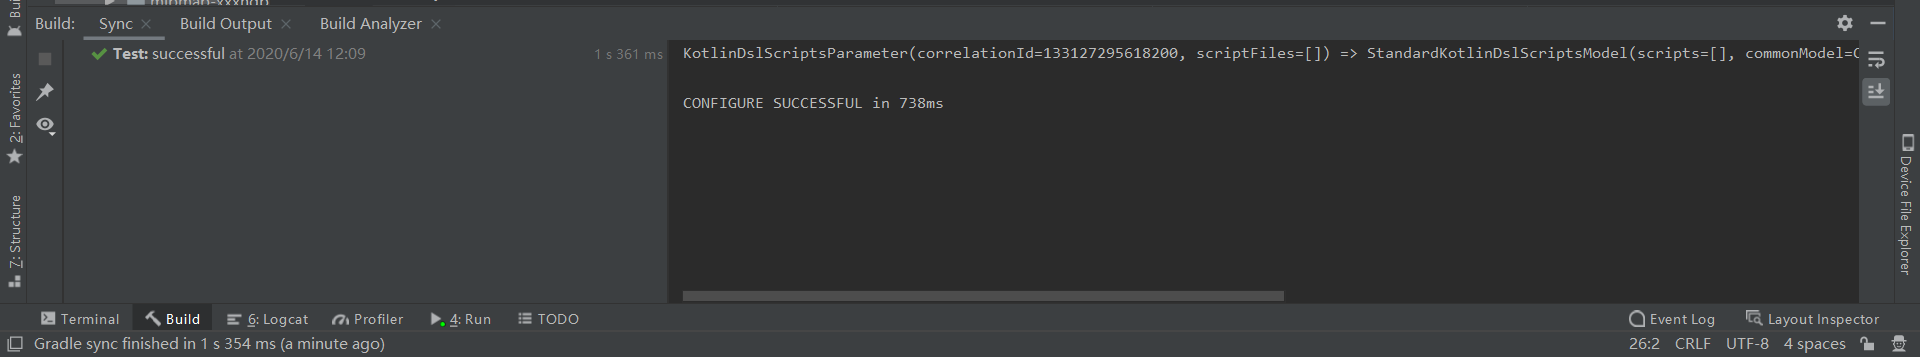
Open the app/gradle build file to view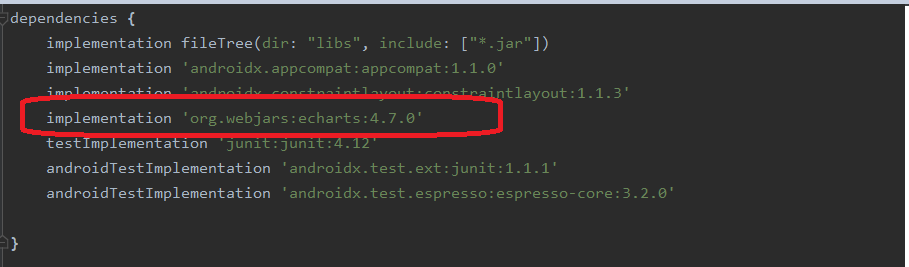
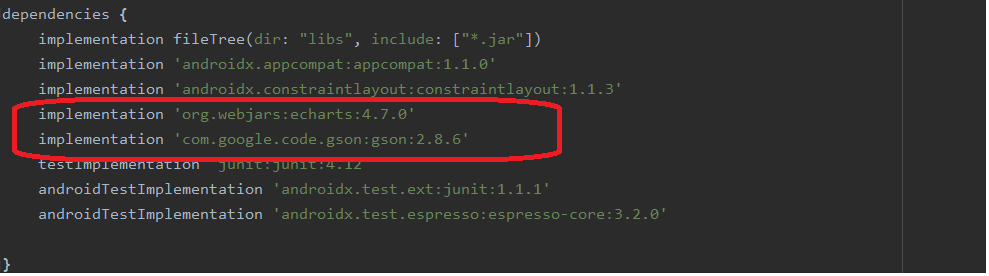
Add gson
echarts.html Document, and echarts.html Put it in the assets directory.
<!DOCTYPE html>
<html style="height: 100%">
    <head>
        <meta name="viewport" content="width=device-width, initial-scale=1" />
        <meta charset="utf-8">
    </head>
    <body style="height: 100%; margin: 0">
        <div id="container" style="height: 100%"></div>
        <script type="text/javascript" src="./echarts.min.js"></script>
        <script type="text/javascript">
            var dom =document.getElementById("container");
            var myChart =echarts.init(dom);
            var app ={};
            function loadEcharts(echartJson){
                var option = JSON.parse(echartJson);
                if (option &&typeof option ==="object") {
                    myChart.setOption(option,true);
                }
            }
        </script>
    </body>
</html>
Generally speaking, we have two solutions to implement ECharts in Android
- Android gets the data and encapsulates the option, then passes it to h5, h5 parses the data, and calls ECharts to draw.
The difficulty of this scheme is that there are too many attributes of option and it is too cumbersome to encapsulate. - h5 processes all operations, obtains data, and calls ECharts to draw.
This solution needs to be familiar with js.
Using the first scheme, we have a God to help us do the most difficult data encapsulation work:
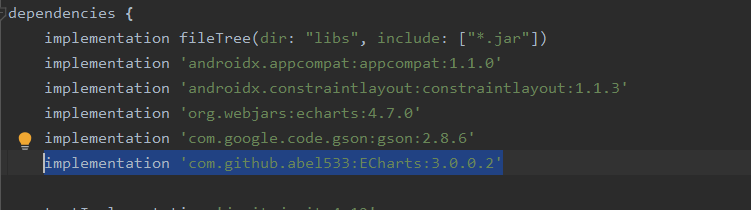
Open the app/gradle build file and add
implementation 'com.github.abel533:ECharts:3.0.0.2'
Project address https://github.com/abel533/ECharts
application
After the relevant configuration has been configured, start to try
Because Echarts needs to be displayed in WebView, we can directly customize an echart view inherited from WebView to display charts.
New EChartView
import android.content.Context;
import android.util.AttributeSet;
import android.webkit.WebSettings;
import android.webkit.WebView;

import com.github.abel533.echarts.json.GsonOption;

public class EChartView extends WebView {
    private static final String TAG = EChartView.class.getSimpleName();

    public EChartView(Context context) {
        this(context, null);
    }

    public EChartView(Context context, AttributeSet attrs) {
        this(context, attrs, 0);
    }

    public EChartView(Context context, AttributeSet attrs, int defStyleAttr) {
        super(context, attrs, defStyleAttr);
        init();
    }

    private void init() {
        WebSettings webSettings = getSettings();
        webSettings.setJavaScriptEnabled(true);
        webSettings.setJavaScriptCanOpenWindowsAutomatically(true);
        webSettings.setSupportZoom(false);
        webSettings.setDisplayZoomControls(false);
        loadUrl("file:///android_asset/echarts.html");
    }

    /**Refresh chart
     * java Call the loadechart method of js to refresh echart
     * You can't use this method to display the chart in the first time, because the html tag in the first time hasn't been loaded, so you can't get the tag value
     * @param option
     */
    public void refreshEchartsWithOption(GsonOption option) {
        if (option == null) {
            return;
        }
        String optionString = option.toString();
        String call = "javascript:loadEcharts('" + optionString + "')";
        loadUrl(call);
    }
}
Another tool class is defined to encapsulate the data as option. Here, only a simple line graph is encapsulated as an example.
EChartOptionUtil
import com.github.abel533.echarts.axis.CategoryAxis;
import com.github.abel533.echarts.axis.ValueAxis;
import com.github.abel533.echarts.code.Trigger;
import com.github.abel533.echarts.json.GsonOption;
import com.github.abel533.echarts.series.Line;

public class EChartOptionUtil {

    public static GsonOption getLineChartOptions(Object[] xAxis, Object[] yAxis) {
        GsonOption option = new GsonOption();
        option.title("Line chart");
        option.legend("sales volume");
        option.tooltip().trigger(Trigger.axis);

        ValueAxis valueAxis = new ValueAxis();
        option.yAxis(valueAxis);

        CategoryAxis categorxAxis = new CategoryAxis();
        categorxAxis.axisLine().onZero(false);
        categorxAxis.boundaryGap(true);
        categorxAxis.data(xAxis);
        option.xAxis(categorxAxis);

        Line line = new Line();
        line.smooth(false).name("sales volume").data(yAxis).itemStyle().normal().lineStyle().shadowColor("rgba(0,0,0,0.4)");
        option.series(line);
        return option;
    }
}
activity.main Layout file
You need to modify it according to your file location
<?xml version="1.0" encoding="utf-8"?>
<LinearLayout xmlns:android="http://schemas.android.com/apk/res/android"
    xmlns:tools="http://schemas.android.com/tools"
    android:layout_width="match_parent"
    android:layout_height="match_parent"
    tools:context="com.example.test.MainActivity">


    <com.example.test.EChartView
        android:id="@+id/lineChart"
        android:layout_width="400dp"
        android:layout_height="400dp"
        android:layout_gravity="center">
    </com.example.test.EChartView>

</LinearLayout>
MainActivity.main
import androidx.appcompat.app.AppCompatActivity;

import android.os.Bundle;
import android.view.View;
import android.webkit.WebView;
import android.webkit.WebViewClient;
import android.widget.Button;
import android.widget.TextView;

public class MainActivity extends AppCompatActivity {
    private EChartView lineChart;
    @Override
    protected void onCreate(Bundle savedInstanceState) {
        super.onCreate(savedInstanceState);
        setContentView(R.layout.activity_main);
        lineChart = findViewById(R.id.lineChart);
        lineChart.setWebViewClient(new WebViewClient(){
            @Override
            public void onPageFinished(WebView view, String url) {
                super.onPageFinished(view, url);
                //It is better to load the data after the h5 page is loaded to prevent html tags from being loaded and displaying normally
                refreshLineChart();
            }
        });
    }
    private void refreshLineChart(){
        Object[] x = new Object[]{
                "Mon", "Tue", "Wed", "Thu", "Fri", "Sat", "Sun"
        };
        Object[] y = new Object[]{
                820, 932, 901, 934, 1290, 1330, 1320
        };
        lineChart.refreshEchartsWithOption(EChartOptionUtil.getLineChartOptions(x, y));
    }

}
result: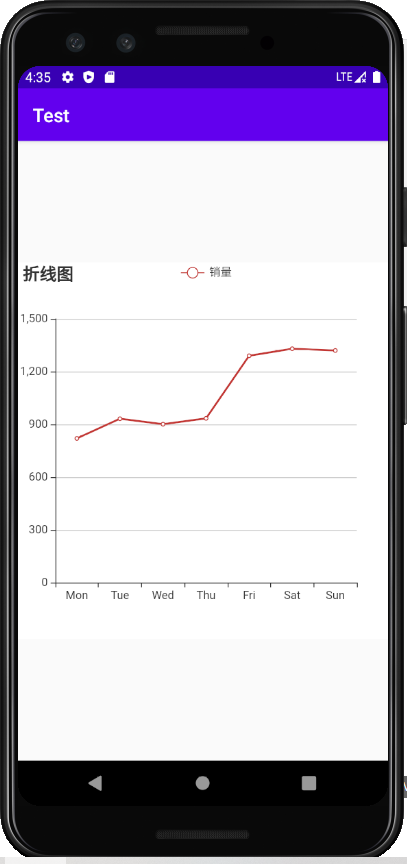
more
Official example:
https://echarts.apache.org/examples/zh/index.html
EChart java Object Library
https://github.com/abel533/ECharts