Hello, I'm Zhang Jintao.
Prometheus has almost become the de facto standard for monitoring and selection in the cloud native era. It is also the second project graduated from CNCF.
At present, Prometheus can almost meet the monitoring needs of various scenarios / services. I have written some articles about Prometheus and its ecology before. In this article, we will focus on the Agent mode released in the latest version of Prometheus. I will briefly cover some concepts or usages irrelevant to this topic.
Pull mode and Push mode
As we all know, Prometheus is a Pull mode monitoring system, which is different from the traditional Push mode based monitoring system.
What is Pull mode?

The service to be monitored itself or the interfaces of some metrics indicators exposed through some exporter s, and Prometheus takes the initiative to grab / collect at regular intervals, which is called Pull mode. That is, the monitoring system actively pulls the metrics of the target.
The corresponding is the Push mode.

The application actively reports some of its own metrics indicators, and the monitoring system performs corresponding processing. If you want to use Push mode for monitoring some applications, for example, it is difficult to implement the metrics interface, you can consider using Push gateway.
The discussion on which is better between Pull mode and Push mode continues all the time. Interested partners can search by themselves.
Here, we mainly focus on the hand mode of interaction between a single Prometheus and application services. In this article, we will take a look at how Prometheus does HA, persistence and clustering from a higher-level or global perspective.
Prometheus HA / persistence / cluster solution
When used in large-scale production environment, there are few cases where there is only one single instance Prometheus in the system. It is common to run multiple Prometheus instances, whether in terms of high availability, data persistence, or providing users with an easier to use global view.
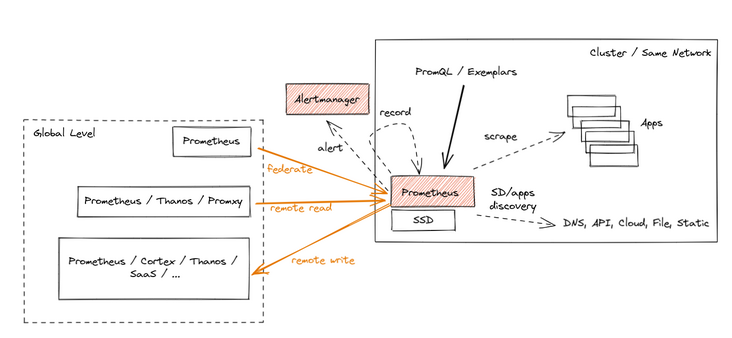
At present, Prometheus mainly has three methods to aggregate the data of multiple Prometheus instances and provide users with a unified global view.

- Federation: it is the earliest Prometheus built-in data aggregation scheme. In this scheme, you can use a central Prometheus instance to grab indicators from leaf Prometheus instances. Under this scheme, the original time stamp of metrics can be retained, and the whole scheme is relatively simple;
- Prometheus Remote Read: it supports reading original metrics from remote storage. Note: there are many options for remote storage here. After reading the data, they can be aggregated and presented to the user;
- Prometheus Remote Write: it supports collecting Prometheus into metrics and writing them to remote storage. When using, users directly read data from remote storage and provide global view, etc;
Prometheus Agent mode
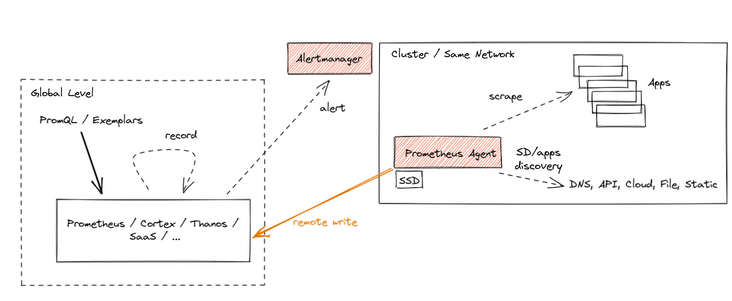
Prometheus Agent is a function that will be provided since Prometheus v2.32.0. It mainly uses the Prometheus Remote Write method mentioned above to write the data of Prometheus instances with Agent mode enabled to remote storage. And provide a global view with the help of remote storage.
Pre dependency
Because it uses Prometheus Remote Write, we need to prepare a "remote storage" for the centralized storage of metrcis. Here we use Thanos To provide this capability. Of course, if you want to use other schemes, such as Cortex, influxDB, etc.
Preparing remote storage
Here, we directly use the latest version of Thanos container image for deployment. Here we use the host network, which is more convenient for testing.
After executing these commands, Thanos receive will listen on the http://127.0.0.1:10908/api/v1/receive Used to receive remote writes.
➜  cd prometheus
➜  prometheus docker run -d --rm \
    -v $(pwd)/receive-data:/receive/data \
    --net=host \
    --name receive \
    quay.io/thanos/thanos:v0.23.1 \
    receive \
    --tsdb.path "/receive/data" \
    --grpc-address 127.0.0.1:10907 \
    --http-address 127.0.0.1:10909 \
    --label "receive_replica=\"0\"" \
    --label "receive_cluster=\"moelove\"" \
    --remote-write.address 127.0.0.1:10908
59498d43291b705709b3f360d28af81d5a8daba11f5629bb11d6e07532feb8b6
➜  prometheus docker ps -l
CONTAINER ID   IMAGE                           COMMAND                  CREATED          STATUS          PORTS     NAMES
59498d43291b   quay.io/thanos/thanos:v0.23.1   "/bin/thanos receive..."   21 seconds ago   Up 20 seconds             receive
Prepare query component
Next, we start a Thanos query component and connect it with the receive component to query the written data.
➜  prometheus docker run -d --rm \
--net=host \
--name query \
quay.io/thanos/thanos:v0.23.1 \
query \
--http-address "0.0.0.0:39090" \
--store "127.0.0.1:10907"
10c2b1bf2375837dbda16d09cee43d95787243f6dcbee73f4159a21b12d36019
➜  prometheus docker ps -l
CONTAINER ID   IMAGE                           COMMAND                  CREATED         STATUS         PORTS     NAMES
10c2b1bf2375   quay.io/thanos/thanos:v0.23.1   "/bin/thanos query -..."   4 seconds ago   Up 3 seconds             query
Note: Here we have configured the -- store field to point to the previous receive component.

Open browser access http://127.0.0.1:39090/stores , if it goes well together, you should see that the receive has been registered in the store.
Deploy Prometheus Agent mode
Here I go directly from Prometheus Release page Downloaded the binaries of its latest version v2.32.0. After unpacking, you will find that the contents in the directory are consistent with those in the previous version.
This is because the Prometheus Agent mode is now built into the Prometheus binary file. You can enable it by adding the -- enable feature = agent option.
Prepare profile
We need to prepare a configuration file for it. Note that remote needs to be configured_ Write, and there can be no configuration such as alerting
global:
  scrape_interval: 15s
  external_labels:
    cluster: moelove
    replica: 0

scrape_configs:
  - job_name: "prometheus"
    static_configs:
      - targets: ["localhost:9090"]

remote_write:
- url: 'http://127.0.0.1:10908/api/v1/receive'
Save the configuration file as prometheus.yml
start-up
We set its log level to debug to facilitate viewing some details of it
➜  ./prometheus --enable-feature=agent --log.level=debug --config.file="prometheus.yml"
ts=2021-11-27T19:03:15.861Z caller=main.go:195 level=info msg="Experimental agent mode enabled."
ts=2021-11-27T19:03:15.861Z caller=main.go:515 level=info msg="Starting Prometheus" version="(version=2.32.0-beta.0, branch=HEAD, revision=c32725ba7873dbaa39c223410043430ffa5a26c0)"
ts=2021-11-27T19:03:15.861Z caller=main.go:520 level=info build_context="(go=go1.17.3, user=root@da630543d231, date=20211116-11:23:14)"
ts=2021-11-27T19:03:15.861Z caller=main.go:521 level=info host_details="(Linux 5.14.18-200.fc34.x86_64 #1 SMP Fri Nov 12 16:48:10 UTC 2021 x86_64 moelove (none))"
ts=2021-11-27T19:03:15.861Z caller=main.go:522 level=info fd_limits="(soft=1024, hard=524288)"
ts=2021-11-27T19:03:15.861Z caller=main.go:523 level=info vm_limits="(soft=unlimited, hard=unlimited)"
ts=2021-11-27T19:03:15.862Z caller=web.go:546 level=info component=web msg="Start listening for connections" address=0.0.0.0:9090
ts=2021-11-27T19:03:15.862Z caller=main.go:980 level=info msg="Starting WAL storage ..."
ts=2021-11-27T19:03:15.863Z caller=tls_config.go:195 level=info component=web msg="TLS is disabled." http2=false
ts=2021-11-27T19:03:15.864Z caller=db.go:306 level=info msg="replaying WAL, this may take a while" dir=data-agent/wal
ts=2021-11-27T19:03:15.864Z caller=db.go:357 level=info msg="WAL segment loaded" segment=0 maxSegment=0
ts=2021-11-27T19:03:15.864Z caller=main.go:1001 level=info fs_type=9123683e
ts=2021-11-27T19:03:15.864Z caller=main.go:1004 level=info msg="Agent WAL storage started"
ts=2021-11-27T19:03:15.864Z caller=main.go:1005 level=debug msg="Agent WAL storage options" WALSegmentSize=0B WALCompression=true StripeSize=0 TruncateFrequency=0s MinWALTime=0s MaxWALTime=0s
ts=2021-11-27T19:03:15.864Z caller=main.go:1129 level=info msg="Loading configuration file" filename=prometheus.yml
ts=2021-11-27T19:03:15.865Z caller=dedupe.go:112 component=remote level=info remote_name=e6fa2a url=http://127.0.0.1:10908/api/v1/receive msg="Starting WAL watcher" queue=e6fa2a
ts=2021-11-27T19:03:15.865Z caller=dedupe.go:112 component=remote level=info remote_name=e6fa2a url=http://127.0.0.1:10908/api/v1/receive msg="Starting scraped metadata watcher"
ts=2021-11-27T19:03:15.865Z caller=dedupe.go:112 component=remote level=info remote_name=e6fa2a url=http://127.0.0.1:10908/api/v1/receive msg="Replaying WAL" queue=e6fa2a
ts=2021-11-27T19:03:15.865Z caller=dedupe.go:112 component=remote level=debug remote_name=e6fa2a url=http://127.0.0.1:10908/api/v1/receive msg="Tailing WAL" lastCheckpoint= checkpointIndex=0 currentSegment=0 lastSegment=0
ts=2021-11-27T19:03:15.865Z caller=dedupe.go:112 component=remote level=debug remote_name=e6fa2a url=http://127.0.0.1:10908/api/v1/receive msg="Processing segment" currentSegment=0
ts=2021-11-27T19:03:15.877Z caller=manager.go:196 level=debug component="discovery manager scrape" msg="Starting provider" provider=static/0 subs=[prometheus]
ts=2021-11-27T19:03:15.877Z caller=main.go:1166 level=info msg="Completed loading of configuration file" filename=prometheus.yml totalDuration=12.433099ms db_storage=361ns remote_storage=323.413µs web_handler=247ns query_engine=157ns scrape=11.609215ms scrape_sd=248.024µs notify=3.216µs notify_sd=6.338µs rules=914ns
ts=2021-11-27T19:03:15.877Z caller=main.go:897 level=info msg="Server is ready to receive web requests."
ts=2021-11-27T19:03:15.877Z caller=manager.go:214 level=debug component="discovery manager scrape" msg="Discoverer channel closed" provider=static/0
ts=2021-11-27T19:03:28.196Z caller=dedupe.go:112 component=remote level=info remote_name=e6fa2a url=http://127.0.0.1:10908/api/v1/receive msg="Done replaying WAL" duration=12.331255772s
ts=2021-11-27T19:03:30.867Z caller=dedupe.go:112 component=remote level=debug remote_name=e6fa2a url=http://127.0.0.1:10908/api/v1/receive msg="runShard timer ticked, sending buffered data" samples=230 exemplars=0 shard=0
ts=2021-11-27T19:03:35.865Z caller=dedupe.go:112 component=remote level=debug remote_name=e6fa2a url=http://127.0.0.1:10908/api/v1/receive msg=QueueManager.calculateDesiredShards dataInRate=23 dataOutRate=23 dataKeptRatio=1 dataPendingRate=0 dataPending=0 dataOutDuration=0.0003201718 timePerSample=1.3920513043478261e-05 desiredShards=0.0003201718 highestSent=1.638039808e+09 highestRecv=1.638039808e+09
ts=2021-11-27T19:03:35.865Z caller=dedupe.go:112 component=remote level=debug remote_name=e6fa2a url=http://127.0.0.1:10908/api/v1/receive msg=QueueManager.updateShardsLoop lowerBound=0.7 desiredShards=0.0003201718 upperBound=1.3
ts=2021-11-27T19:03:45.866Z caller=dedupe.go:112 component=remote level=debug remote_name=e6fa2a url=http://127.0.0.1:10908/api/v1/receive msg=QueueManager.calculateDesiredShards dataInRate=23.7 dataOutRate=18.4 dataKeptRatio=1 dataPendingRate=5.300000000000001 dataPending=355.5 dataOutDuration=0.00025613744 timePerSample=1.3920513043478263e-05 desiredShards=0.00037940358300000006 highestSent=1.638039808e+09 highestRecv=1.638039823e+09
ts=2021-11-27T19:03:45.866Z caller=dedupe.go:112 component=remote level=debug remote_name=e6fa2a url=http://127.0.0.1:10908/api/v1/receive msg=QueueManager.updateShardsLoop lowerBound=0.7 desiredShards=0.00037940358300000006 upperBound=1.3
ts=2021-11-27T19:03:45.871Z caller=dedupe.go:112 component=remote level=debug remote_name=e6fa2a url=http://127.0.0.1:10908/api/v1/receive msg="runShard timer ticked, sending buffered data" samples=265 exemplars=0 shard=0
You can see from the log where it will go http://127.0.0.1:10908/api/v1/receive That is, Thanos receive, which we deployed at the beginning, sends data.
Query data
Open the Thanos query we deployed at the beginning, and enter any metrics to query. You can query the expected results.

However, if we directly access the UI address of Prometheus with Agent mode enabled, we will directly report an error and cannot query. This is because if the Agent mode is enabled, Prometheus will turn off its UI query capability, alarm, local storage and other capabilities by default.
summary
This article mainly carries out the hands-on practice of Prometheus Agent, receives the metrics report from Prometheus Agent through Thanos receive, and then queries the results through Thanos query.

Prometheus Agent does not essentially change the way Prometheus indicators are collected, and still continues to use Pull mode.
Its usage scenario is mainly for Prometheus HA / data persistence or clustering. The architecture will slightly overlap with some existing schemes,
But there are some advantages:
- Agent mode is a built-in function of Prometheus;
- Open the Prometheus instance in Agent mode, which consumes less resources and has more single functions, which is more favorable for expanding some edge scenarios;
- After the Agent mode is enabled, the Prometheus instance can almost be regarded as a stateless application, which is more convenient for expansion;
The official version will be released in a while. Will you try to use it?
Welcome to subscribe my official account number [MoeLove].
