Actuator
In addition to service fault tolerance, Hystrix also provides near real-time monitoring function, which collects the service execution results and running indicators, the number of successful requests, etc. through the activator, and then accesses / Actor / Hystrix.stream to see the real-time monitoring data.
Add dependency
Add actor dependencies to projects that need to turn on data monitoring.
<!-- spring boot actuator rely on -->
<dependency>
    <groupId>org.springframework.boot</groupId>
    <artifactId>spring-boot-starter-actuator</artifactId>
</dependency>
configuration file
Open the hystrix.stream endpoint in the configuration file. Configure to '*' if you want all endpoints exposed.
# Measurement monitoring and health examination
management:
  endpoints:
    web:
      exposure:
        include: hystrix.stream
Startup class
package com.example;

import org.springframework.boot.SpringApplication;
import org.springframework.boot.autoconfigure.SpringBootApplication;
import org.springframework.cloud.client.circuitbreaker.EnableCircuitBreaker;
import org.springframework.cloud.client.loadbalancer.LoadBalanced;
import org.springframework.context.annotation.Bean;
import org.springframework.web.client.RestTemplate;

// Open fuse annotation 2, choose 1, @ EnableHystrix encapsulates @ enablechircuitbreaker
// @EnableHystrix
@EnableCircuitBreaker
@SpringBootApplication
public class OrderServiceRestApplication {

    @Bean
    @LoadBalanced
    public RestTemplate restTemplate() {
        return new RestTemplate();
    }

    public static void main(String[] args) {
        SpringApplication.run(OrderServiceRestApplication.class, args);
    }

}
Visit
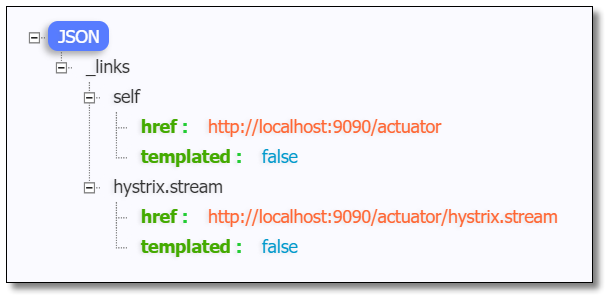
Visit: http://localhost:9090/actuator You can see that the hystrix.stream endpoint is turned on.
Visit: http://localhost:9090/actuator/hystrix.stream The results are as follows:
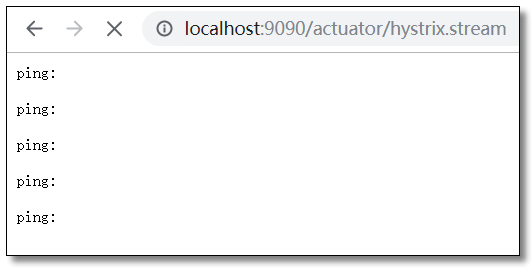
No data from Hystrix is available at this time. Next, request a method that is sure to make an error to generate the service fuse degradation processing. The result is as follows:
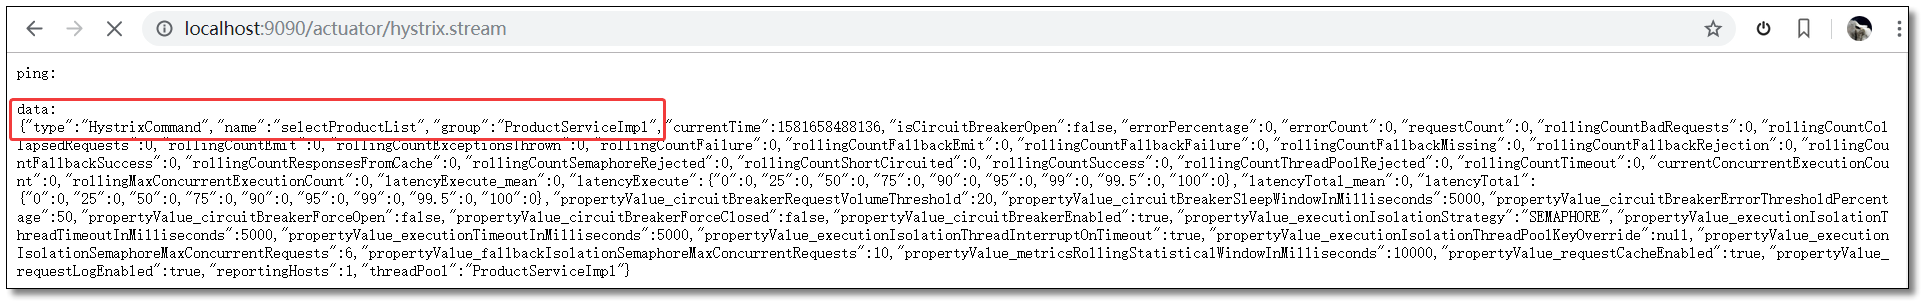
It is very inconvenient for us to observe the running state of the service intuitively for this pure JSON viewing mode. We can use the Hystrix monitoring center to view it.
monitoring center

The so-called monitoring center is a set of visualization system hystrix dashboard provided by hystrix, which can be very friendly to see the running status of services in the current environment. Hystrix dashboard is a real-time monitoring tool for hystrix. Through hystrix dashboard, we can directly see the request response time, request success rate and other data of each Hystrix Command.
Add dependency
Add dashboard dependencies to projects that need data monitoring turned on.
<!-- spring boot actuator rely on -->
<dependency>
    <groupId>org.springframework.boot</groupId>
    <artifactId>spring-boot-starter-actuator</artifactId>
</dependency>
<!-- spring cloud netflix hystrix rely on -->
<dependency>
    <groupId>org.springframework.cloud</groupId>
    <artifactId>spring-cloud-starter-netflix-hystrix</artifactId>
</dependency>
<!-- spring cloud netflix hystrix dashboard rely on -->
<dependency>
    <groupId>org.springframework.cloud</groupId>
    <artifactId>spring-cloud-starter-netflix-hystrix-dashboard</artifactId>
</dependency>
Startup class
Add the @ EnableHystrixDashboard annotation to the project startup class where data monitoring needs to be enabled.
package com.example;

import org.springframework.boot.SpringApplication;
import org.springframework.boot.autoconfigure.SpringBootApplication;
import org.springframework.cloud.client.circuitbreaker.EnableCircuitBreaker;
import org.springframework.cloud.client.loadbalancer.LoadBalanced;
import org.springframework.cloud.netflix.hystrix.dashboard.EnableHystrixDashboard;
import org.springframework.context.annotation.Bean;
import org.springframework.web.client.RestTemplate;

// Open fuse annotation 2, choose 1, @ EnableHystrix encapsulates @ enablechircuitbreaker
// @EnableHystrix
@EnableCircuitBreaker
// Enable data monitoring annotation
@EnableHystrixDashboard
@SpringBootApplication
public class OrderServiceRestApplication {

    @Bean
    @LoadBalanced
    public RestTemplate restTemplate() {
        return new RestTemplate();
    }

    public static void main(String[] args) {
        SpringApplication.run(OrderServiceRestApplication.class, args);
    }

}
Visit
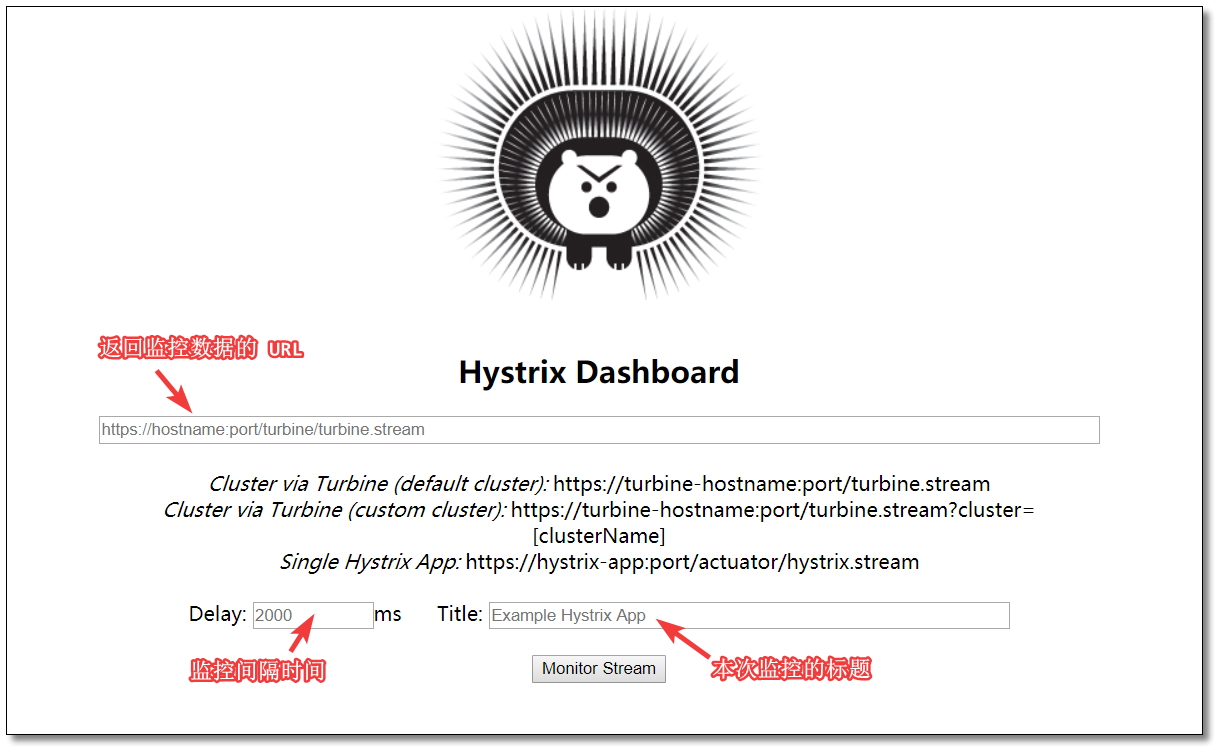
Visit: http://localhost:9090/hystrix The interface of monitoring center is as follows:
View data
Enter the URL that can return the monitoring data: http://localhost:9090/actuator/hystrix.stream
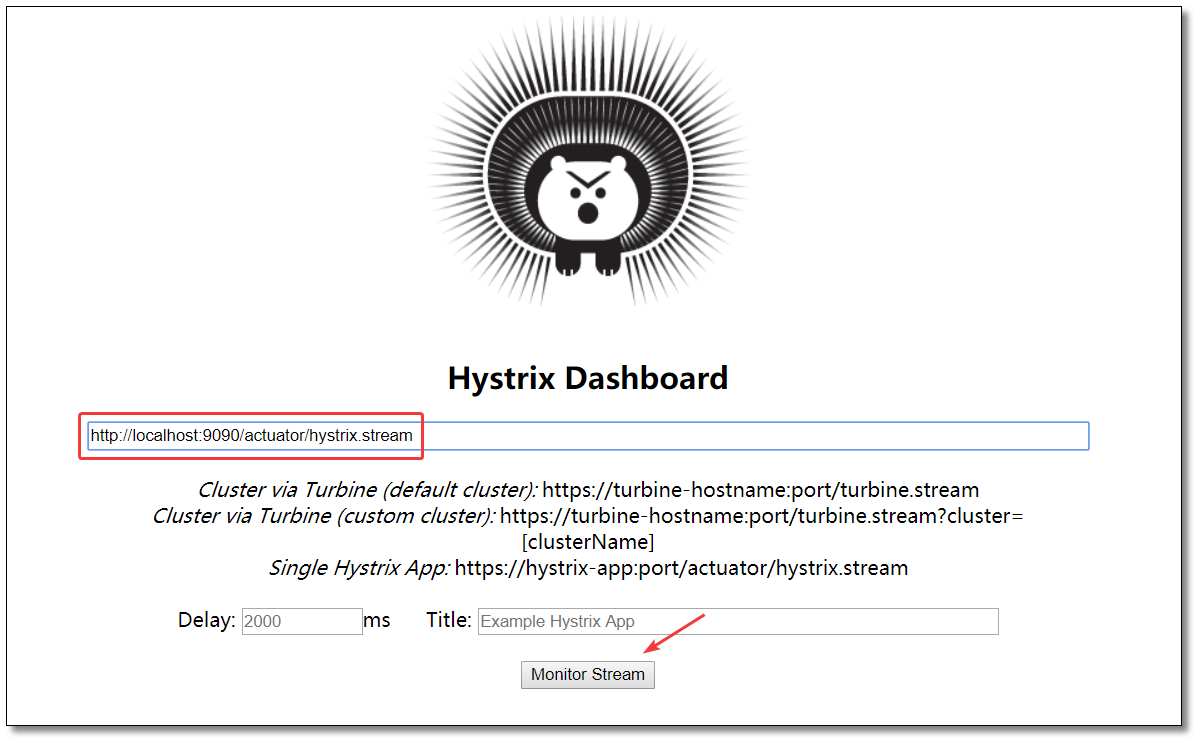
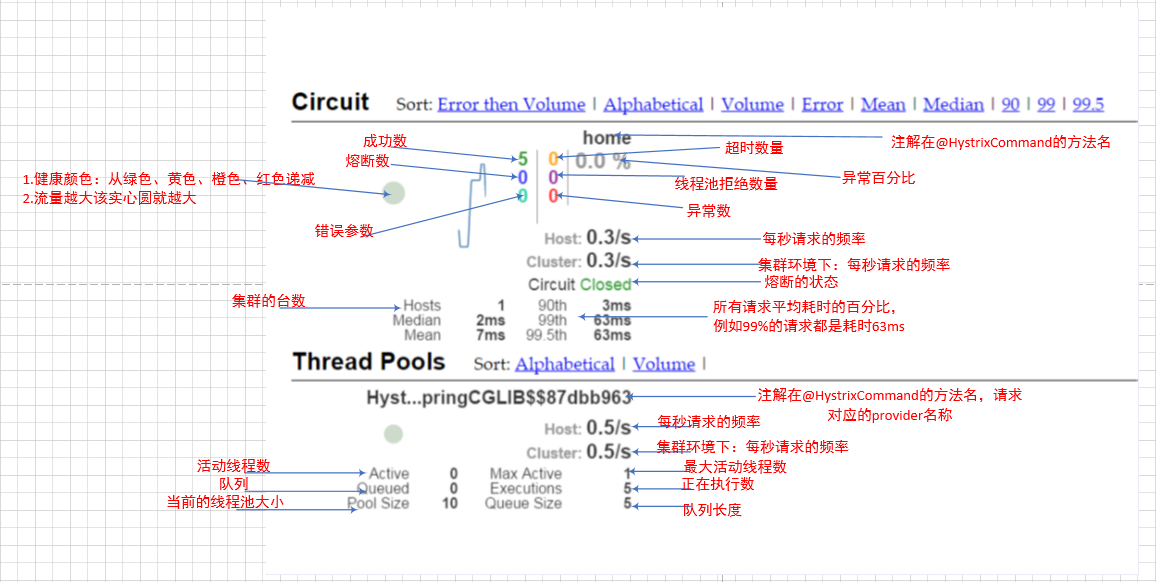
Diagram of monitoring center
Aggregation monitoring

Turbine is a tool for aggregating server to send event flow data. dashboard can only monitor a single node. In the actual production environment, it is a cluster, so it can monitor cluster services through turbine.
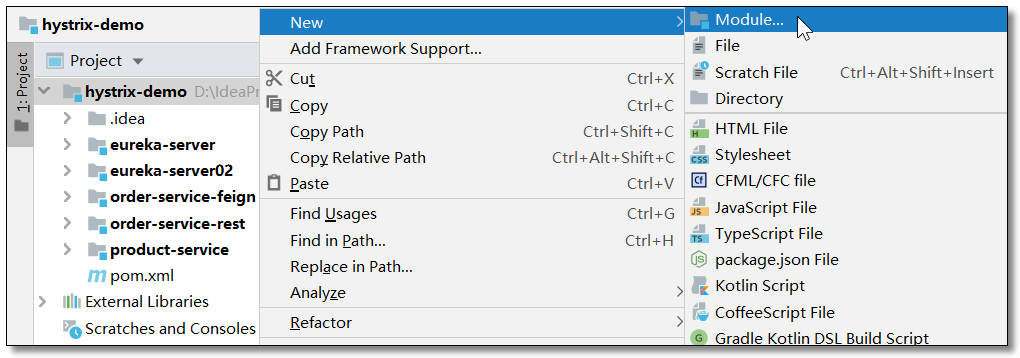
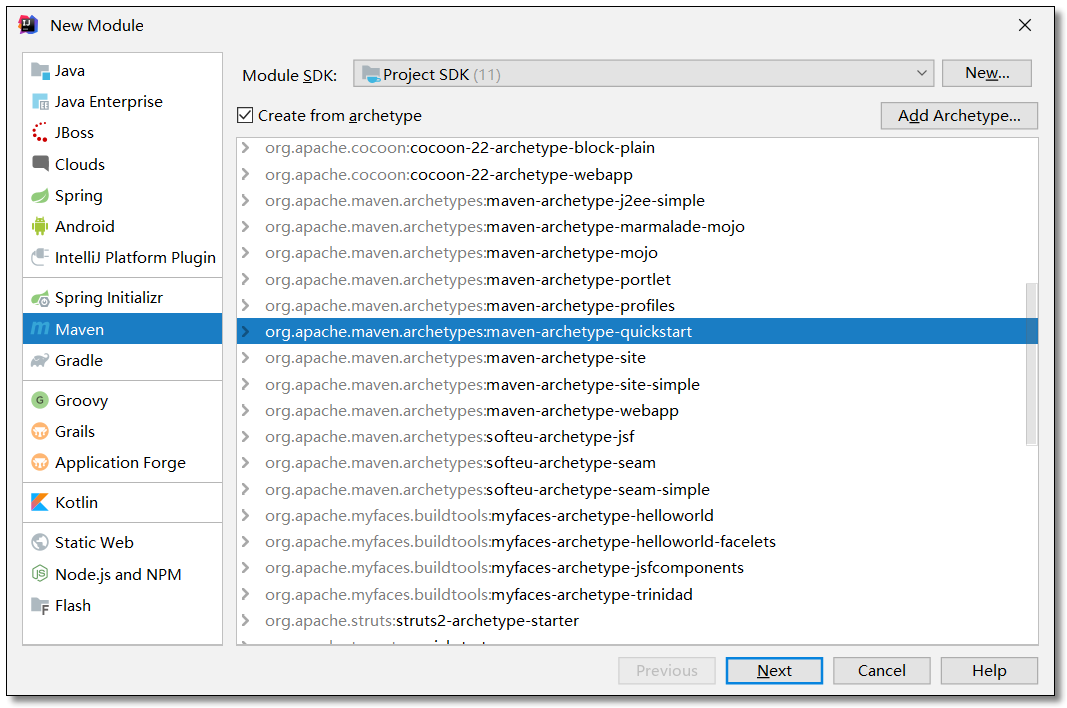
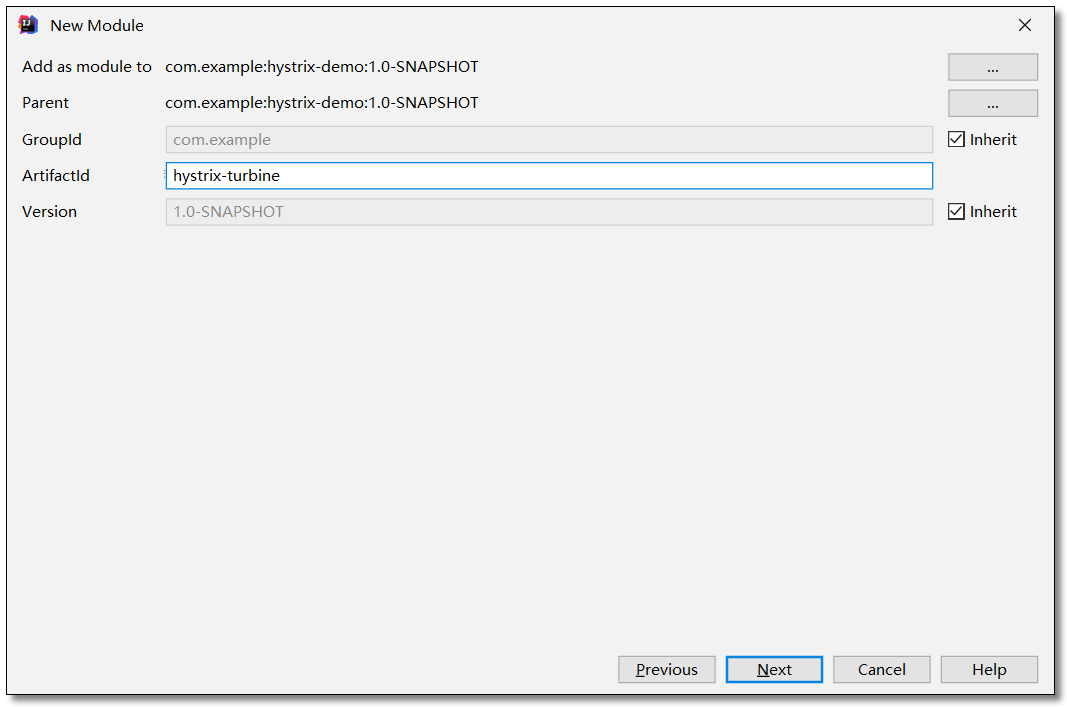
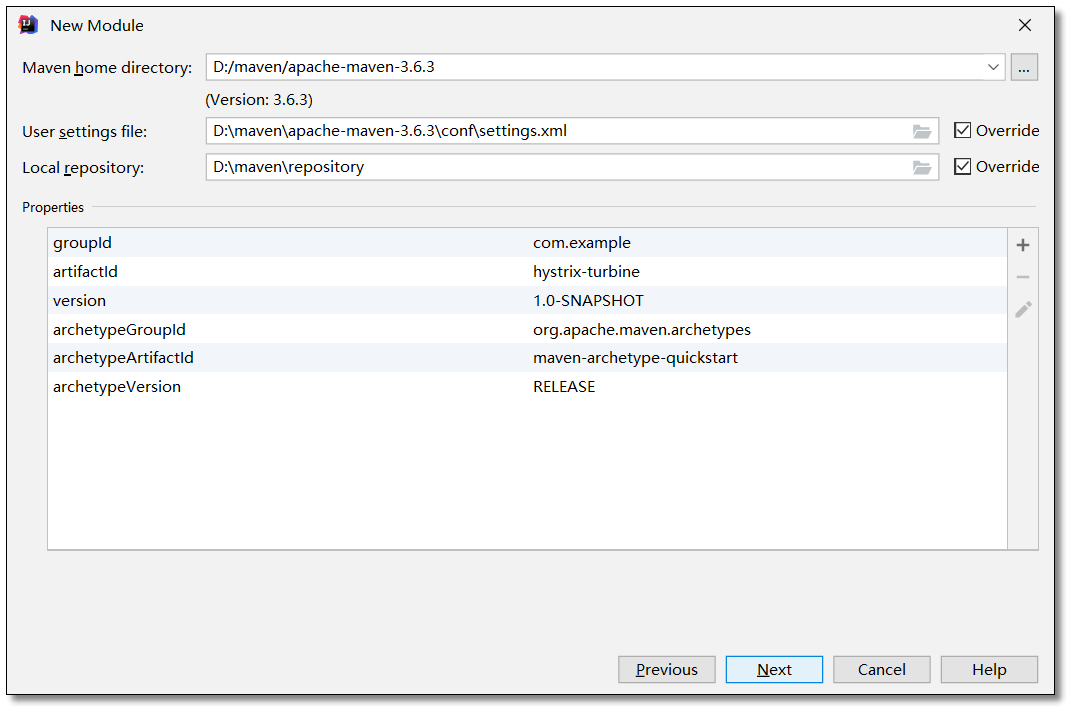
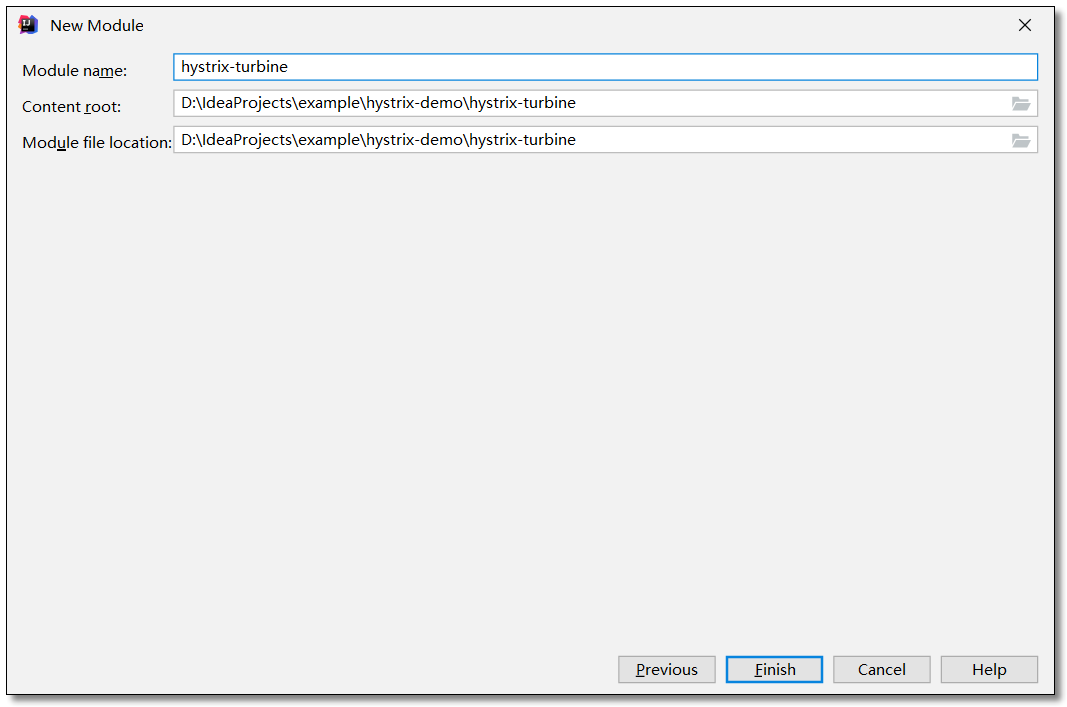
Create project
Create the hystrix turbo project under the parent project of hystrix demo.
Add dependency
The project introduces three dependencies: hystrix, dashboard and turbine.
<?xml version="1.0" encoding="UTF-8"?>

<project xmlns="http://maven.apache.org/POM/4.0.0" xmlns:xsi="http://www.w3.org/2001/XMLSchema-instance"
         xsi:schemaLocation="http://maven.apache.org/POM/4.0.0 http://maven.apache.org/xsd/maven-4.0.0.xsd">
    <modelVersion>4.0.0</modelVersion>

    <groupId>com.example</groupId>
    <artifactId>hystrix-turbine</artifactId>
    <version>1.0-SNAPSHOT</version>

    <!-- Inherit parent dependency -->
    <parent>
        <groupId>com.example</groupId>
        <artifactId>hystrix-demo</artifactId>
        <version>1.0-SNAPSHOT</version>
    </parent>

    <!-- Project dependence -->
    <dependencies>
        <!-- spring-cloud netflix hystrix rely on -->
        <dependency>
            <groupId>org.springframework.cloud</groupId>
            <artifactId>spring-cloud-starter-netflix-hystrix</artifactId>
        </dependency>
        <!-- spring cloud netflix hystrix dashboard rely on -->
        <dependency>
            <groupId>org.springframework.cloud</groupId>
            <artifactId>spring-cloud-starter-netflix-hystrix-dashboard</artifactId>
        </dependency>
        <!-- spring cloud netflix turbine rely on -->
        <dependency>
            <groupId>org.springframework.cloud</groupId>
            <artifactId>spring-cloud-starter-netflix-turbine</artifactId>
        </dependency>
    </dependencies>
</project>
configuration file
application.yml
server:
  port: 8181 # port

spring:
  application:
    name: hystrix-turbine # apply name

# Configure Eureka Server registry
eureka:
  instance:
    prefer-ip-address: true       # Use ip address to register
    instance-id: ${spring.cloud.client.ip-address}:${server.port} # ip:port
  client:
    service-url:                  # Set service registry address
      defaultZone: http://localhost:8761/eureka/,http://localhost:8762/eureka/

# Aggregation monitoring
turbine:
  # Comma separated list of services to monitor
  app-config: order-service-rest,order-service-feign
  # Specify cluster name
  cluster-name-expression: "'default'"
Startup class
Three annotations @ EnableHystrix, @ EnableHystrixDashboard, @ EnableTurbine need to be enabled for the startup class.
package com.example;

import org.springframework.boot.SpringApplication;
import org.springframework.boot.autoconfigure.SpringBootApplication;
import org.springframework.cloud.client.circuitbreaker.EnableCircuitBreaker;
import org.springframework.cloud.netflix.hystrix.dashboard.EnableHystrixDashboard;
import org.springframework.cloud.netflix.turbine.EnableTurbine;

// Open fuse annotation 2, choose 1, @ EnableHystrix encapsulates @ enablechircuitbreaker
// @EnableHystrix
@EnableCircuitBreaker
// Enable data monitoring annotation
@EnableHystrixDashboard
// Enable aggregation monitoring comment
@EnableTurbine
@SpringBootApplication
public class HystrixTurbineApplication {

    public static void main(String[] args) {
        SpringApplication.run(HystrixTurbineApplication.class, args);
    }

}
Visit
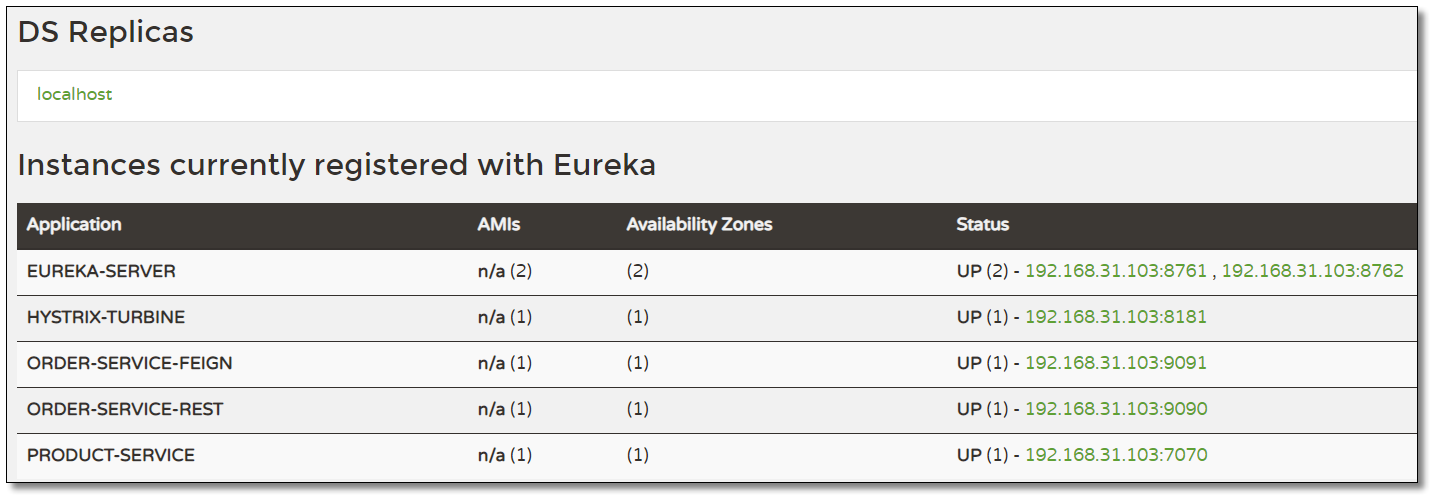
Both order service rest and order service feign are configured with monitoring center. The final environment is as follows:
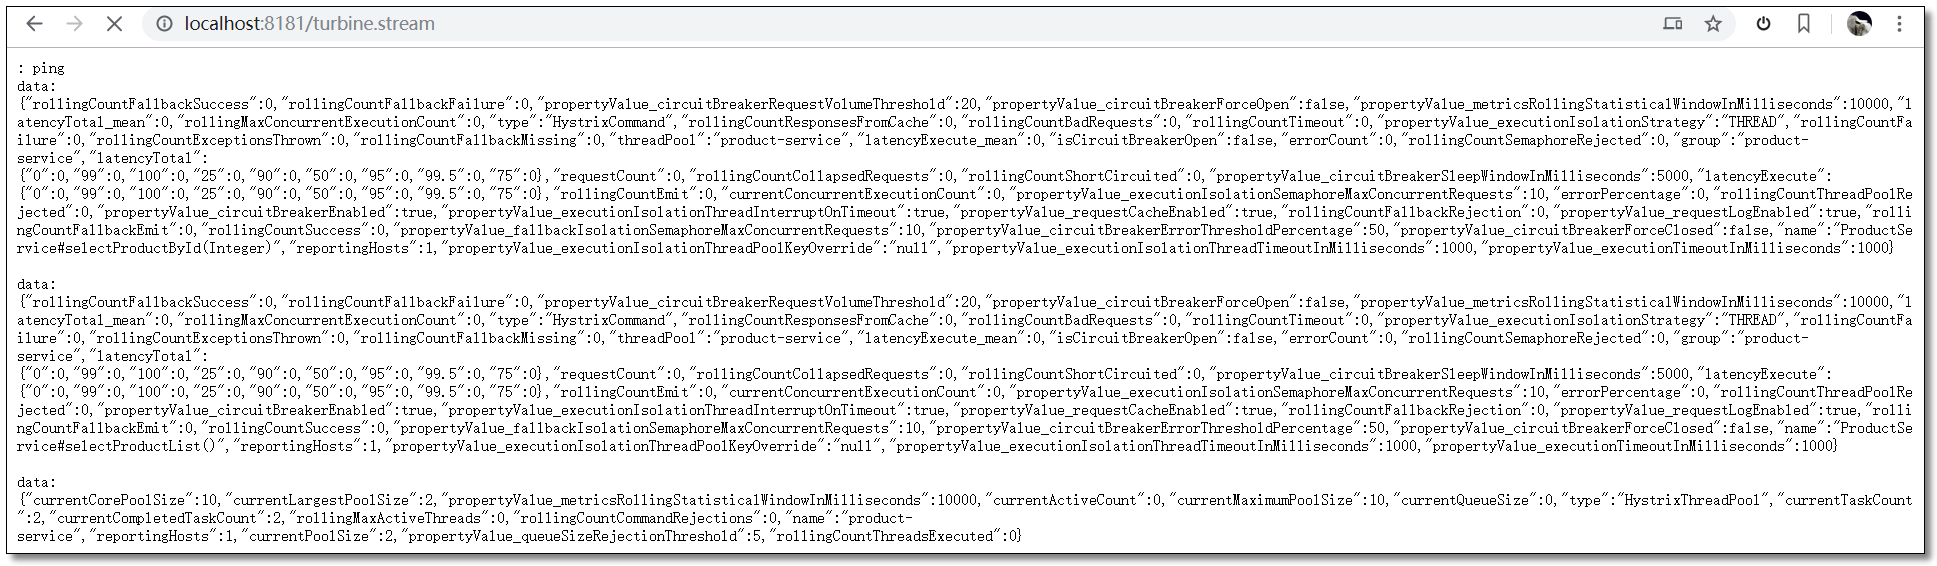
Visit: http://localhost:8181/turbine.stream Multi node service status data is as follows:
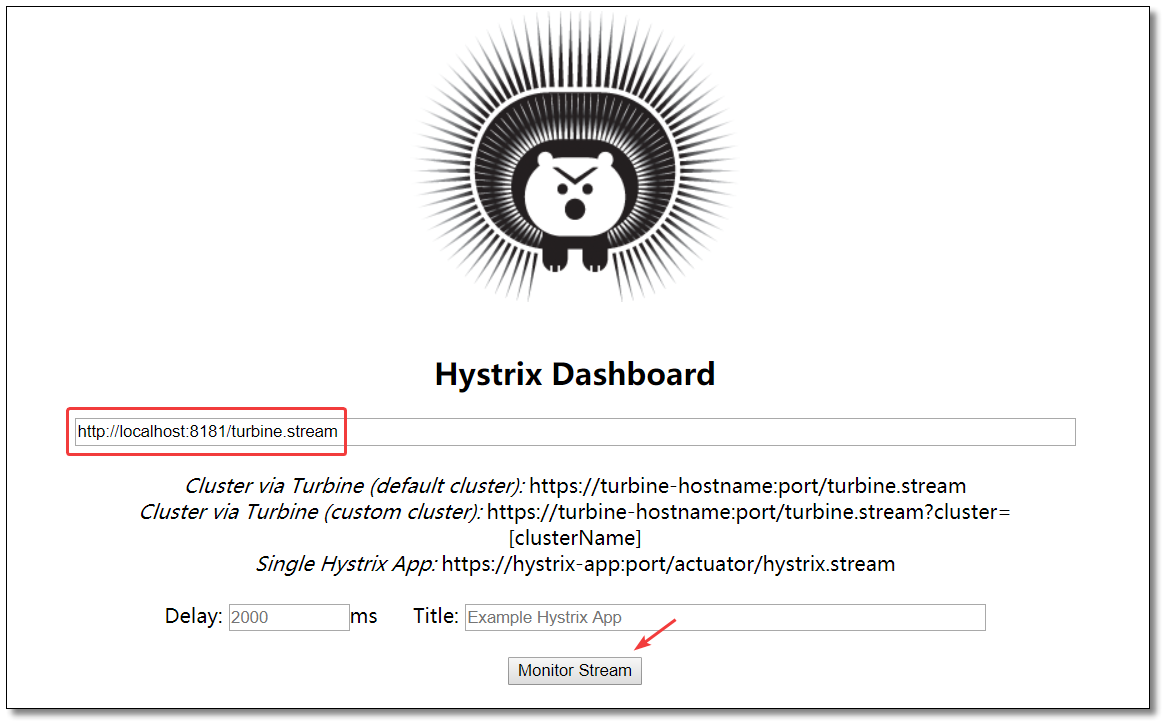
Visit: http://localhost:8181/hystrix
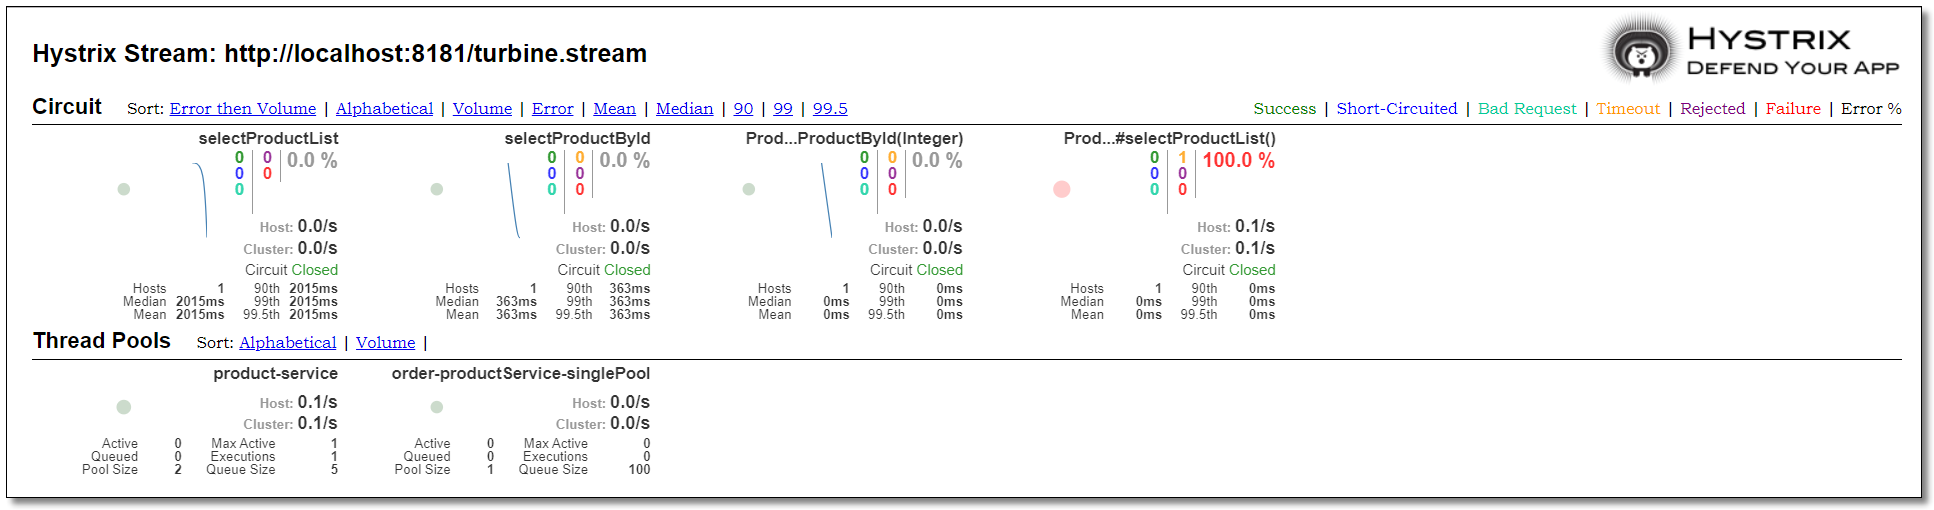
The operation status of order service rest and order service feign are as follows:
At this point, the introduction of Hystrix service monitoring knowledge point is over.

This paper adopts Intellectual sharing "signature - non-commercial use - no deduction 4.0 international" License Agreement.
You can go through classification See more about Spring Cloud Article.
Your comments and forwarding are the biggest support for me.
A kind of Scan the code and follow Mr. halloward's "document + video". Each article is provided with a special video explanation, which makes learning easier~