1. Overview
*Why should we have service tracking? There are many services in the distributed system calling each other, and the invocation relationship is complex. If there is a problem, we will have a lot of work when we do problem investigation or optimize the architecture. At this time, we need to be able to accurately track each network request and understand the entire operation process, such as the network.We can use Spring Cloud Zipkin to find out which microservices have passed through the request and whether there are delays in each microservice.
Spring Cloud Zipkin is a component that can collect and track request data in a distributed system, allowing developers to more intuitively monitor the time spent by requests in various microservices, including the Zipkin Server server and the Zipkin Client client.The Zipkin Server server is used to collect tracking data between microservices, and the data is generated and displayed through the Zipkin Client client.Next let's go into a real-world exercise!
2. Actual combat!Quickly build Zipkin Server and Zipkin client
1. Create a subproject zipkinServer with the pom.xml configuration as follows:
    <dependency>
    	<groupId>org.springframework.boot</groupId>
    	<artifactId>spring-boot-starter-web</artifactId>
    </dependency>

    <dependency>
    	<groupId>io.zipkin.java</groupId>
    	<artifactId>zipkin-server</artifactId>
    	<version>2.9.4</version>
    </dependency>

    <dependency>
    	<groupId>io.zipkin.java</groupId>
    	<artifactId>zipkin-autoconfigure-ui</artifactId>
    	<version>2.9.4</version>
    </dependency>
2. Create a configuration file with the following code:
server:
  port: 9090
3. Create a startup class with the following code:
package com.zing;

import org.springframework.boot.SpringApplication;
import org.springframework.boot.autoconfigure.SpringBootApplication;

import zipkin.server.internal.EnableZipkinServer;

@SpringBootApplication
@EnableZipkinServer
public class ZipkinApplication {
	public static void main(String[] args) throws Exception {
		SpringApplication.run(ZipkinApplication.class, args);
	}
}
Note Description
* @EnableZipkinServer: Declare to start Zipkin Server
4. Create a zipkin Client.Create a subproject with the pom.xml file configured as follows:
    <dependency>
    	<groupId>org.springframework.cloud</groupId>
    	<artifactId>spring-cloud-starter-zipkin</artifactId>
    	<version>2.0.2.RELEASE</version>
    </dependency>
5. Create the configuration file application.yml, which is configured as follows:
server:
  port: 8090
spring:
  application:
    name: zipkinclient
  sleuth:
    web:
      client:
        enabled: true
    sampler:
      probability: 1.0
  zipkin:
    base-url: http://localhost:9090/
eureka:
  client:
    service-url:
      defaultZone: http://localhost:8761/eureka/
Attribute description
* spring.sleuth.web.client.enabled: Set to turn on request tracking
* spring.sleuth.sampler.probability: Set sampling ratio, default is 1.0
* spring.zipkin.base-url: address of Zipkin Server
6. Create a startup class with the following code:
package com.zing;

import org.springframework.boot.SpringApplication;
import org.springframework.boot.autoconfigure.SpringBootApplication;

@SpringBootApplication
public class ZipKinClientApplication {
	public static void main(String[] args) throws Exception {
		SpringApplication.run(ZipKinClientApplication.class, args);
	}

}
7. Create a controller for testing, code as follows:
package com.zing.controller;

import org.springframework.beans.factory.annotation.Value;
import org.springframework.web.bind.annotation.GetMapping;
import org.springframework.web.bind.annotation.RequestMapping;
import org.springframework.web.bind.annotation.RestController;

@RestController
@RequestMapping("/zipkin")
public class ZipkinHandler {

	@Value("${server.port}")
	private String port;

	@GetMapping("/index")
	public String index() {
		return this.port;
	}

}
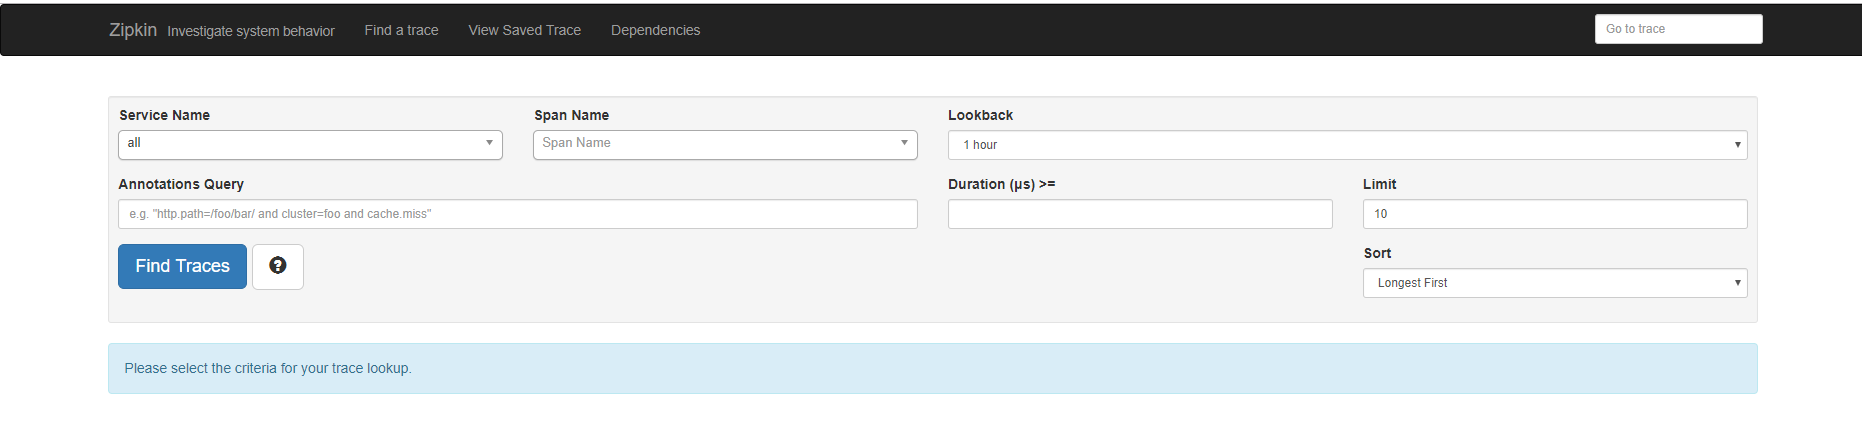
8. Start the registry, zipkinserver, zipkinclient services in turn, access http://localhost:9090/zipkin/ The following visual interfaces can appear:
9. Let's visit the interface to be tracked http://localhost:8090/zipkin/index Show the following interface:

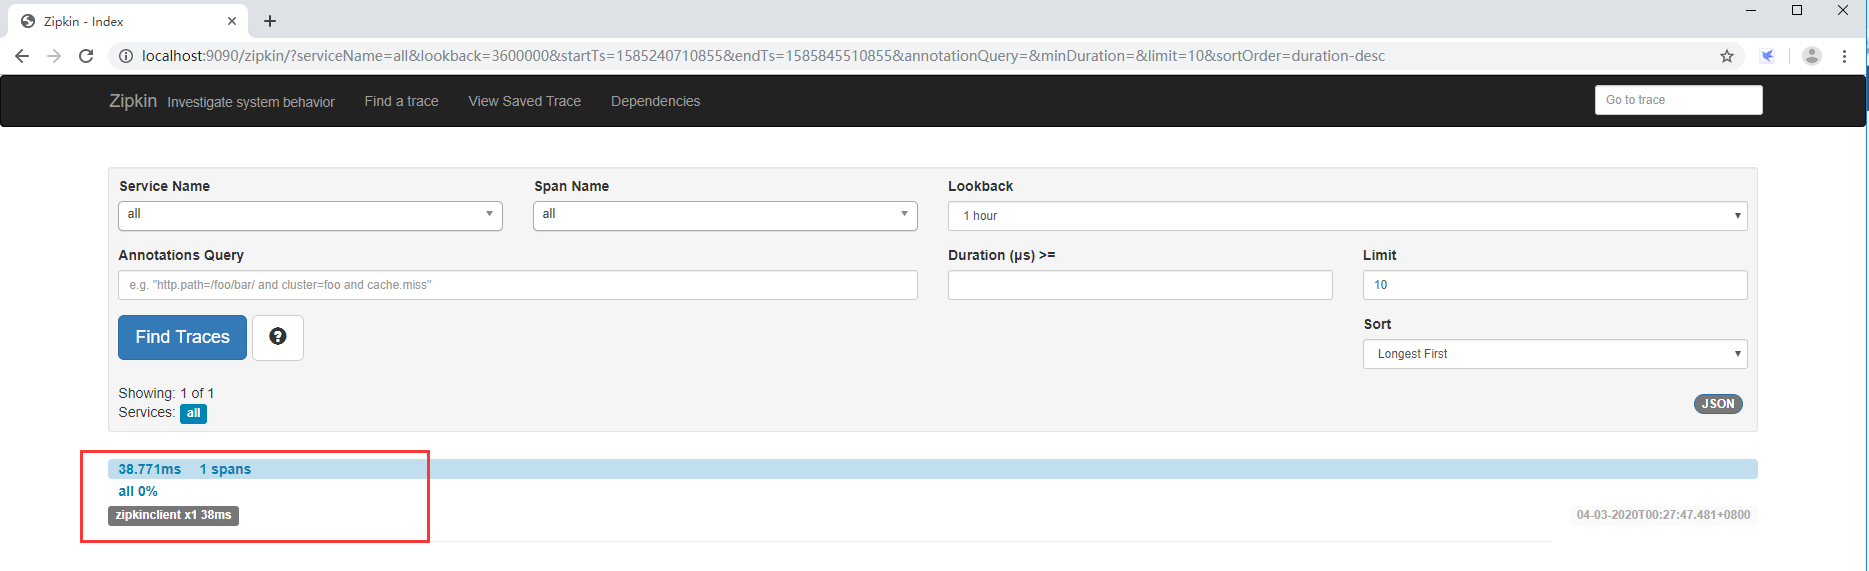
10. Access the zipkin service tracking visual interface address again http://localhost:9090/zipkin/ Click the Find Traces button to go to the following page
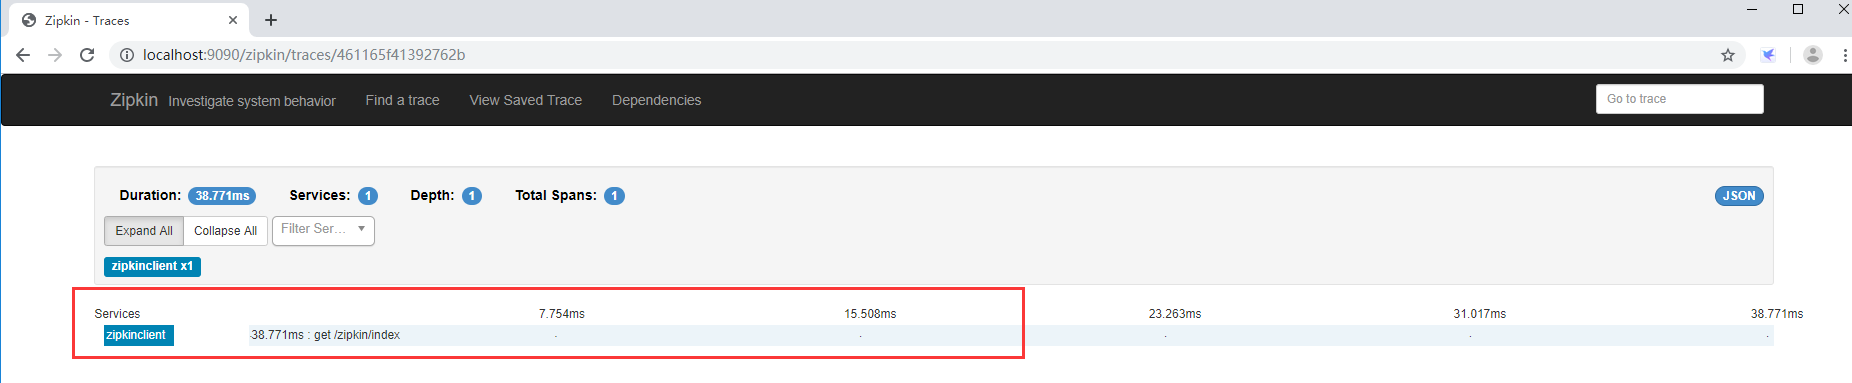
11. Click on the data in the list above to enter the specific display list, as shown below:
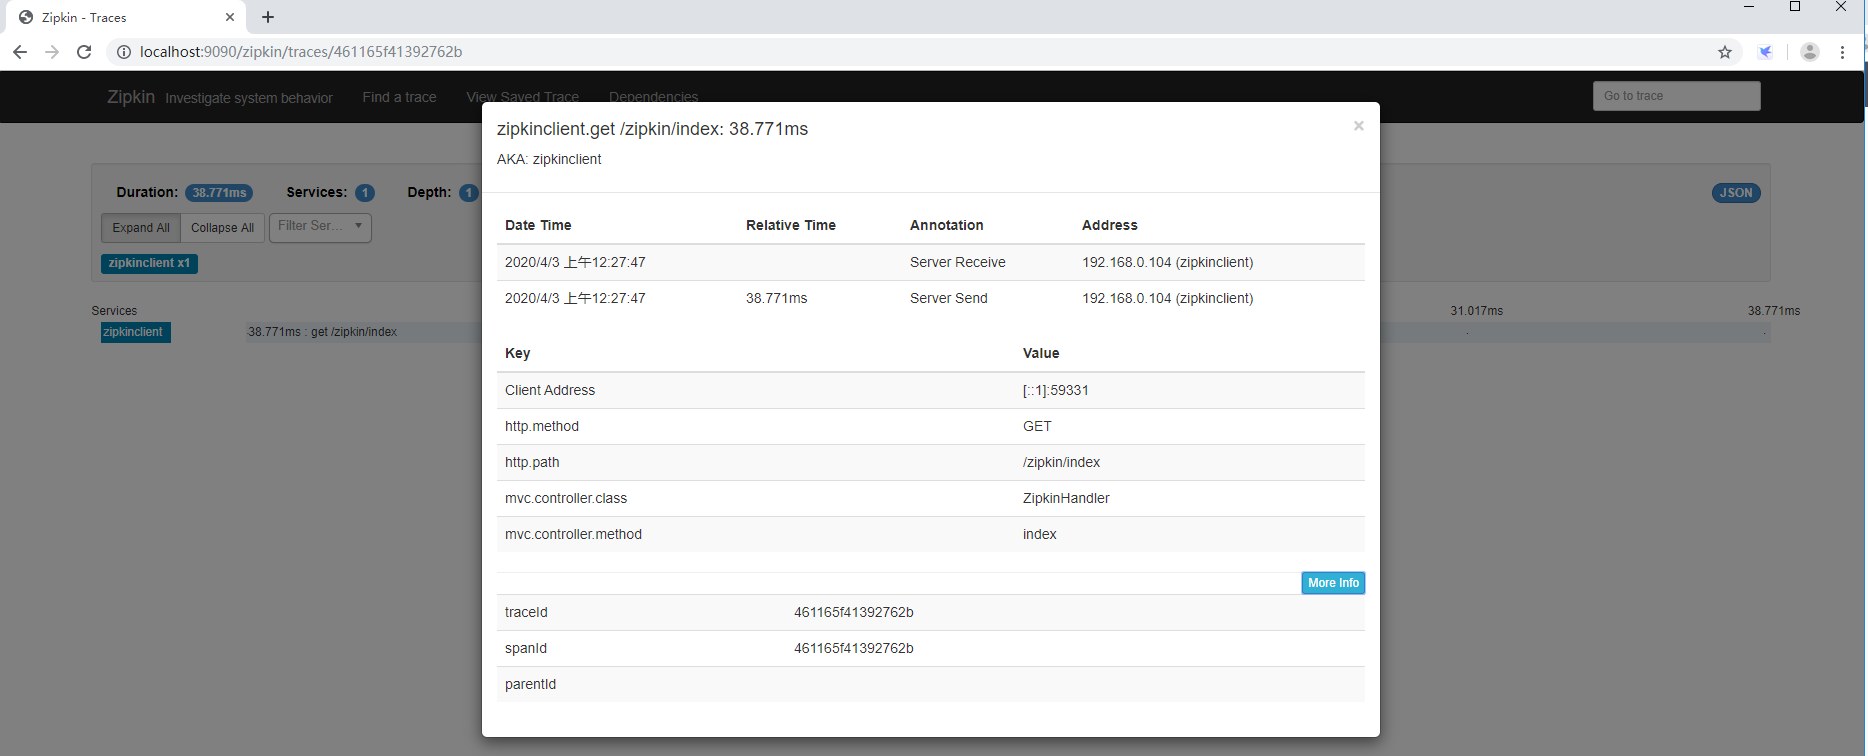
12. Click on the data in the list to view the details of the tracked service, as shown below:
3. Summary
This article uses Zipkin to monitor requests between our micro-services. You can see some details, such as the time consumed and the path method of the specific requests. That's how Zipkin is used.