Code:
object Main extends App{
  def Hθ(θ0:Double,θ1:Double,x:Double):Double=θ0+θ1*x
  def costFunction(θ0:Double,θ1:Double):Double={
    val m=data.size
    var squreSum=0.0
    data.foreach{case (x,y)=>{
      squreSum+= (Hθ(θ0,θ1,x)-y)*(Hθ(θ0,θ1,x)-y)
    }}
    squreSum/(2.0*m)
  }
  val data=List((3,4),(2,1),(4,3),(0,1))//Data sets are relatively small ____________
  val α=0.1 //learning rate
  var θ0=0.0 //Parameter 1
  var θ1=0.0 //Parameter 2
  var temp=0.0 // Cumulative and Variable
  val m:Double=data.size*1.0 // Number of data
  breakable{
    for(i<- 1 to 10000){ //Maximum Iteration 10000
      temp=0.0
      data.foreach{case (x,y)=>{
        temp=temp+ Hθ(θ0,θ1,x)-y
      }}
      val  tempθ0 = α*(1.0/m)*temp //Record change
      θ0=θ0 - α*(1.0/m)*temp
      temp=0.0
      data.foreach{case (x,y)=>{
        temp=temp+(Hθ(θ0,θ1,x)-y)*x
      }}
      val  tempθ1 = α*(1.0/m)*temp //Record change
      θ1=θ1- α*(1.0/m)*temp
      if(doesEqualZero(tempθ0) && doesEqualZero(tempθ1))
        break() //The break exits the iteration after the change has been very small
    }
  }
  println(s"θ0:$θ0 θ1:$θ1")
  def doesEqualZero(a:Double):Boolean=if(a<=0.0001 && a >= -0.0001) true else false
  val xs=for(item<-data)yield item._1
  val ys=for(item<-data) yield item._2
  val xs1=for(i<- -100 to 100)yield i
  val ys1=for(x <- xs1)yield Hθ(θ0,θ1,x)
  val p=Plot().withScatter(xs,ys,ScatterOptions().mode(ScatterMode.Marker))
    .withScatter(xs1,ys1,ScatterOptions().mode(ScatterMode.Line))
  draw(p,"ML")
}
The result is (data visualization uses plot.ly Support scala: 
Regression is the prediction of another numerical target value from a known data set. For example, the price of a house is related to the size of the house, the number of rooms, etc. Suppose they satisfy a linear relationship. To simplify the problem, let's assume that there is only a relationship between y and x. We have only known discrete data points. The goal is to find one.
 This function is used to fit known discrete data points.
cost function(loss function)
Let's call the following formula cost function 
The significance of this formula is to measure the difference between the fitting value and the actual value of the known data.
We choose gradient descent algorithm to minimize this gap.
Gradient descent
Mathematically, the gradient is perpendicular to the contour line. 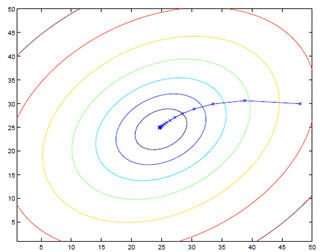
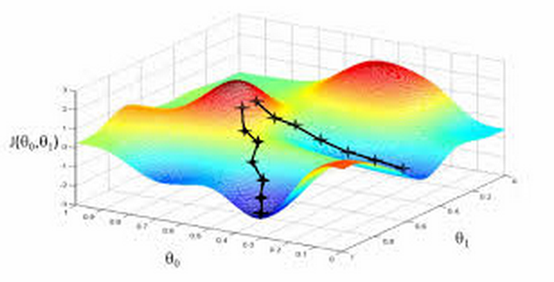
The formula is: 
a is the learning rate.
Following are the formulas for finding partial derivatives: 
Jiang Hang's blog address: hangscer