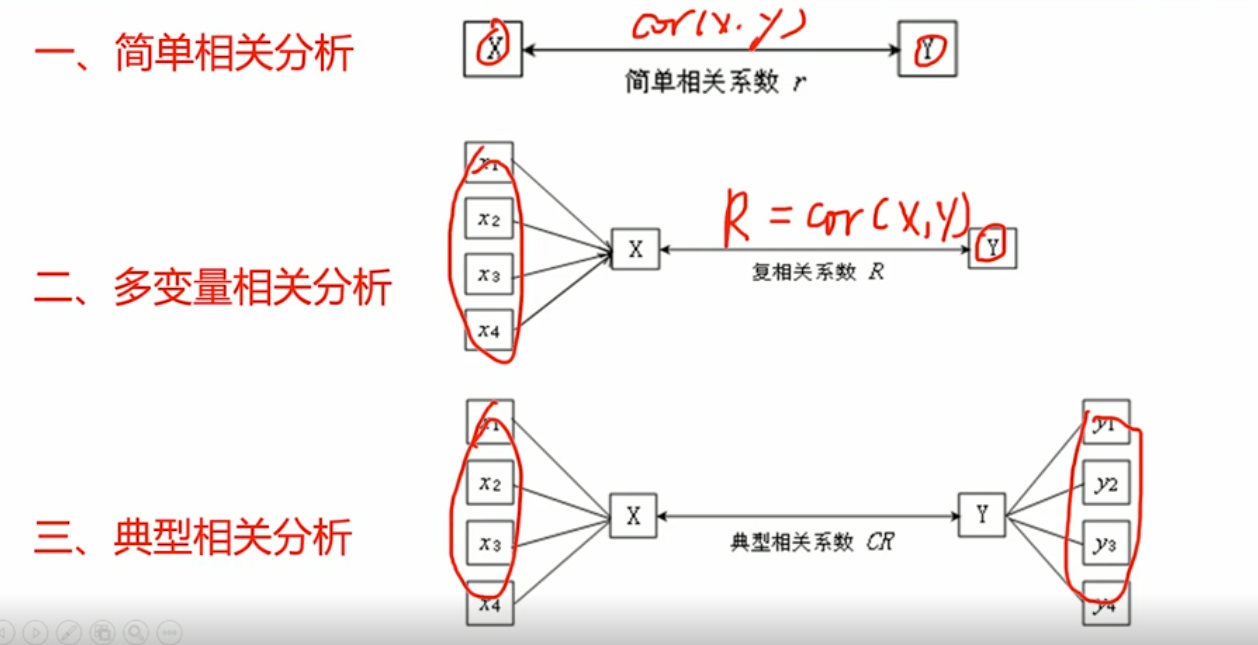
- Concept: To explore the correlation between one set of variables and another (Canonical Correlation Analysis) is an extension of simple correlation and multivariate correlation
- Compress parameters into a variable
- Parameter limit: standardize the transformation so that the covariance is 1
- Lagrange expansion
- Seeking the extreme value of derivation
- Get characteristic equation
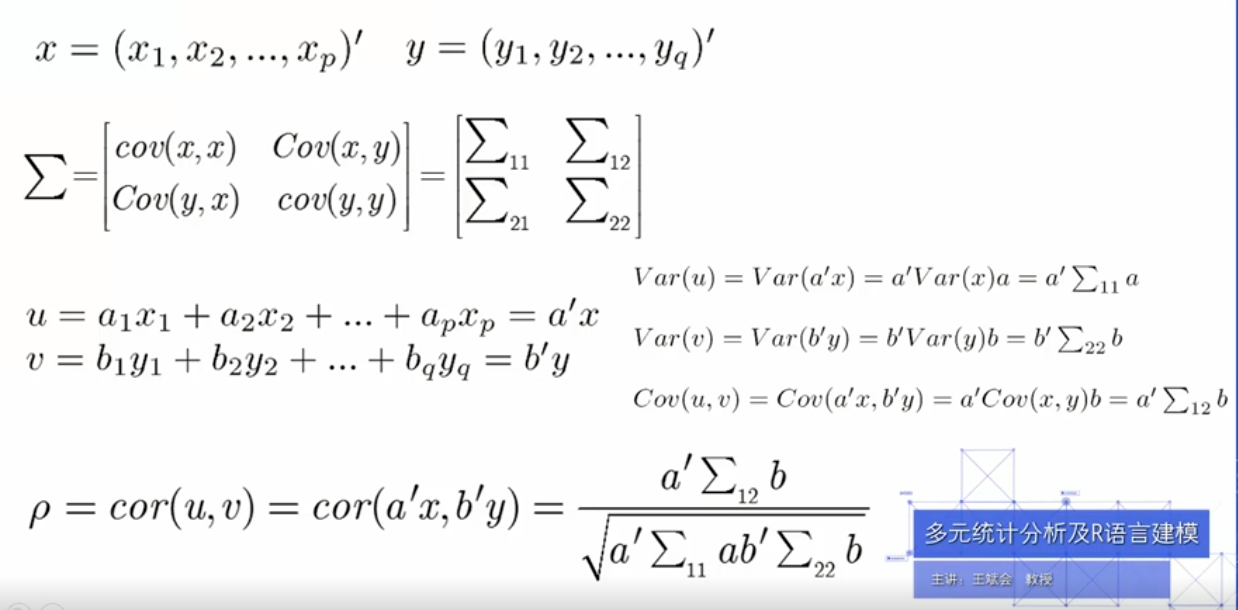
- Properties of typical variables
- Test of correlation of typical variables: test the typical correlation coefficient to determine the number of correlation coefficients, and then analyze the typical correlation of data according to the significant typical correlation coefficient
d11.1=read.table('clipboard',header = T)
#Simple correlation analysis
cor(d11.1)
#Multivariate correlation analysis
summary(lm(y1~x1+x2+x3,d11.1))$r.sq
summary(lm(y2~x1+x2+x3,d11.1))$r.sq
summary(lm(y3~x1+x2+x3,d11.1))$r.sq
#canonical correlation analysis
d11.2=read.table('clipboard',header = T)
ca=cancor(d11.1[,1:3],d11.1[,4:6])
ca$cor
#Canonical variables
ca$xcoef
ca$ycoef

msa.cancor(d11.1[,1:3],d11.1[,4:6],plot = TRUE)

msa.cancor(d11.2[,1:4],d11.2[,5:10],plot = TRUE,pq=2)

msa.cancor<-function (x, y, pq=min(ncol(x),ncol(y)), plot = FALSE){
  x = scale(x)
  y = scale(y)
  n = nrow(x)
  p = ncol(x)
  q = ncol(y)
  ca = cancor(x, y)
  #cat("\n");	print(ca)
  r = ca$cor
  m <- length(r)
  Q <- rep(0, m)
  P = rep(0, m)
  lambda <- 1
  for (k in m:1) {
    lambda <- lambda * (1 - r[k]^2)
    Q[k] <- -log(lambda)
  }
  s <- 0
  i <- m
  for (k in 1:m) {
    Q[k] <- (n - k + 1 - 1/2 * (p + q + 3) + s) * Q[k]
    P[k] <- 1 - pchisq(Q[k], (p - k + 1) * (q - k + 1))
  }
  #cat("\n cancor test: \n")
  #print(round(data.frame(r, Q, P),4))
  cr=round(data.frame(CR=r, Q, P),4)
  cat("\n")
  u=as.data.frame(ca$xcoef[,1:pq]); colnames(u)=paste('u',1:pq,sep='')
  #print(round(u,4))
  v=as.data.frame(ca$ycoef[,1:pq]); colnames(v)=paste('v',1:pq,sep='')
  #print(round(v,4))
  if (plot) {
    u1 = as.matrix(x) %*% u[,1]
    v1 = as.matrix(y) %*% v[,1]
    plot(u1, v1, xlab = "u1", ylab = "v1")
    abline(lm(u1 ~ v1))
  }
  list(cor=cr,xcoef=t(round(u,4)),ycoef=t(round(v,4)))
}