Because the AChart Engine provided by Google is powerful but complex to use, MPAndroid Chart can also achieve some better histograms, line charts, pie charts and other drawing, and the use is relatively simple and portable.
Introduction to MPAndroid Chart
Main Api methods:
- Set Description (String desc): Set the description of the table
- SetDescription Typeface (Typeface): Customize the font displayed in the table
- setDrawYValues(boolean enabled): Data that sets whether the value of the y axis is displayed
- setValuePaintColor(int color): Set the color of the value of the y axis in the table, but you must set setDrawYValues (true)
- SetValueTypeface (Typeface): Set fonts
- setValueFormatter(DecimalFormat format): Set the format of the display
- setPaint(Paint p, int which): Custom brush
- public ChartData getDataCurrent(): Returns the chart currently displayed by the ChartData object. It contains the minimum and maximum display values of all information, etc.
- public float getYChartMin(): Returns the current minimum
- public float getYChartMax(): Returns the current maximum
- public float getAverage(): Returns the average of all values.
- public float getAverage(int type): Returns average
- public PointF getCenter(): Return to the midpoint
- public Paint getPaint(int which): Get the brush
- SetTouch Enabled (boolean enabled): Set whether it can be touched, such as false, it can not be dragged, zoomed, etc.
- SetDragScale Enabled (boolean enabled): Set whether drag and zoom is allowed
- SetOnChartValueSelectedListener (OnChartValueSelectedListener): Sets the point on the table and callback function when clicked
- Set Highlight Enabled (boolean enabled): Set whether to highlight when clicking value
- Public void highlight Values (Highlight [] highs): Set highlights
- saveToGallery(String title): Save the chart to the gallery
- SaveToPath (String title, String path OnSD): Save.
- setScaleMinima(float x, float y): Set the smallest zoom
- Center ViewPort (int xIndex, float val): Set Viewport
- fitScreen(): Adapt to Screen
Here's a little Demo for your own project
- xml file
<com.github.mikephil.charting.charts.PieChart
        android:layout_marginTop="20dp"
        android:id="@+id/spread_pie_chat"
        android:layout_width="match_parent"
        android:layout_height="match_parent"
        android:background="@color/Null"
        android:layout_weight="1"
        android:layout_gravity="center_horizontal"
        android:layout_alignParentTop="true"
        android:layout_centerHorizontal="true">
</com.github.mikephil.charting.charts.PieChart>-
java file
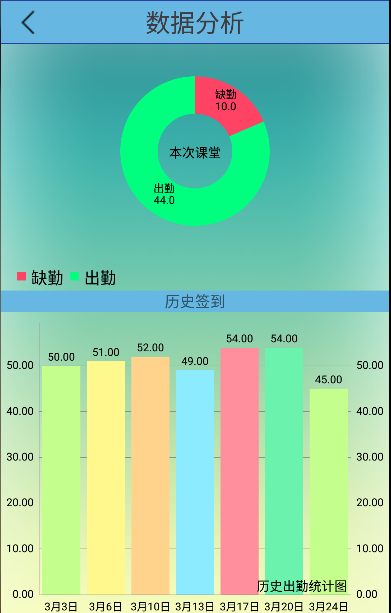
/**
 -    Function:    drawPie()
 -    Description:    Draw a pie chart
 **/
public void drawPie(){

    //Name
    ArrayList<String> names=new ArrayList<String>();
    names.add("Absence from duty");
    names.add("Attendance");
    //Size
    ArrayList<Entry> sizes=new ArrayList<Entry>();
    sizes.add(new Entry(10,0));
    sizes.add(new Entry(44,1));
    //colour
    ArrayList<Integer> colors=new ArrayList<Integer>();
    colors.add(Color.parseColor("#FE4365"));
    colors.add(Color.parseColor("#00FF7F"));

    PieDataSet pieDataSet=new PieDataSet(sizes,"");//Parameters: The color bar displays the color catalog
    pieDataSet.setValueTextSize(10f);
    //pieDataSet.setDrawValues(true); // Whether to display values and percentages on blocks
    //pieDataSet.setSliceSpace(0f);//block spacing
    pieDataSet.setColors(colors);


    //DisplayMetrics metrics=this.getResources().getDisplayMetrics();
    PieData pieData=new PieData(names,pieDataSet);

    pieChart.setHoleRadius(120f);  //radius
    pieChart.setTransparentCircleRadius(50f); // Translucent circle
    //PieChart. setTransparent CircleRadius (0f); // Set the radius of a small transparent circle inside a large circle, and the hole is not a circle.

    pieChart.setDrawHoleEnabled(true);
    pieChart.setHoleColorTransparent(true);//Whether the central hole is transparent: true is black, false is white
    pieChart.setHoleRadius(50f);//Set the radius of the colorless circle inside the big circle (hole...)
    pieChart.setCenterText("This class");  //Characters in the middle of a pie chart

    pieChart.setDescription("");//Parameter: Graphic description in lower right corner

    //pieChart.setDrawCenterText(false); // does not display graphic center text
    //pieChart.setCenterText("traffic graph"); // Picture center text
    pieChart.setRotationEnabled(true);//Manual rotation

    //pieChart.setDrawMarkerViews(false);
    //pieChart.setDrawSliceText(false); // whether the text of the block is displayed


    pieChart.setData(pieData);

    Legend legend=pieChart.getLegend();
    legend.setEnabled(true);//Whether or not to display graphical instructions must be placed after setData, otherwise an error will occur.
    legend.setTextSize(15f);

    //The two parameters have different meanings:
    //Duration MillisX: The time when each block runs to a fixed initial position
    //Duration MillisY: From each block to the end of the drawing
    pieChart.animateXY(1000, 1000);//Set animation (parameter is time)
}
/**
 -   Function:    drawHistogram()
 -   Description:    Draw a histogram
 **/
public void drawHistogram(){
    //Name
    ArrayList<String> mMonths=new ArrayList<String>();
    mMonths.add("3 3 Month");
    mMonths.add("3 June 6");
    mMonths.add("3 10 January");
    mMonths.add("3 13 January");
    mMonths.add("3 17 January");
    mMonths.add("3 20 January");
    mMonths.add("3 24 February");
    //Size (height)
    ArrayList<BarEntry> sizes=new ArrayList<BarEntry>();
    sizes.add(new BarEntry(50,0));
    sizes.add(new BarEntry(51,1));
    sizes.add(new BarEntry(52,2));
    sizes.add(new BarEntry(49,3));
    sizes.add(new BarEntry(54,4));
    sizes.add(new BarEntry(54,5));
    sizes.add(new BarEntry(45,6));

    //colour
    BarDataSet barDataSet=new BarDataSet(sizes,"");
    barDataSet.setValueTextSize(10f);
    ArrayList<Integer> colors = new ArrayList<Integer>();
    for(int i = 0;i < 7 ;i++){
        colors.add(Color.parseColor(color[i]));
    }//color setting
    barDataSet.setColors(colors);
    BarData barData=new BarData(mMonths,barDataSet);
    barChart.setDescription("Historical Attendance Chart");//data description
    barChart.setDescriptionTextSize(12f);
    barChart.setNoDataTextDescription("No data for the chart");// If there is no data, this will be displayed, similar to ListView's EmptyView
    barChart.setPinchZoom(false);// Set double finger zooming
    barChart.setScaleEnabled(false);//Manual scaling effect
    barChart.setPinchZoom(false);//The xy axis is zoomed at the same time and is used with setScaleEnabled

    barChart.setDrawGridBackground(false);
    //barChart.setDrawBorders(false); // Canvas Edge
    //barChart.setVisibleXRange(7);
    //barChart.setMaxVisibleValueCount(6);
    barChart.setDrawBarShadow(false);//Set Rectangular Shadow Not to Display
    //BarChart. setBackgroundColor (Color. parseColor (" FFFFFF");// Set the background color

    //barChart.setMinOffset(0);//=padding
    barChart.setDrawValueAboveBar(true);

    barChart.setData(barData);
    barChart.animateXY(1000, 1000);//Setting up animation
    Legend legend=barChart.getLegend();//Cancel Graphic Description
    legend.setEnabled(false);

    //Getting X-axis coordinates
    XAxis xAxis=barChart.getXAxis();
    xAxis.setPosition(XAxisPosition.BOTTOM);//X coordinates at the bottom of the icon
    xAxis.setDrawGridLines(false);
    xAxis.setSpaceBetweenLabels(2);//Set the spacing between names
    //xAxis.

    //Get the right coordinates of Y axis
    YAxis yAxisR=barChart.getAxisRight();
    yAxisR.setEnabled(true);
    yAxisR.setDrawGridLines(true);

    //Getting the left coordinates of the Y-axis
    YAxis yAxisL=barChart.getAxisLeft();
    yAxisL.setEnabled(true);
    yAxisL.setDrawGridLines(true);
}
Design sketch