Environmental Science
linux: centos7.6
- The most common server system in the company
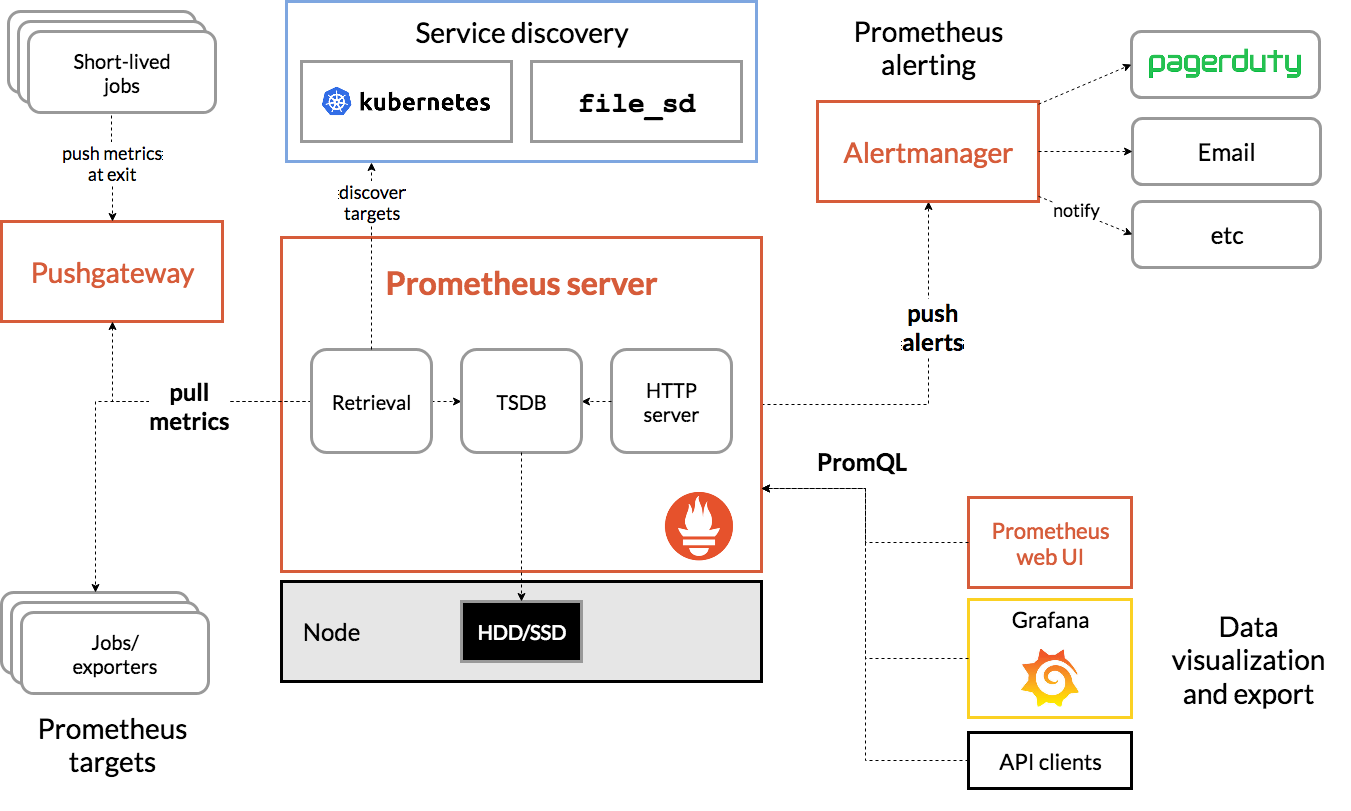
prometheus: 2.13.1.linux-amd64
- Container monitoring solution for numerical data based on time series: with its own data storage and monitoring, it is the official monitoring scheme designated by k8s.
node_exporter: 0.18.1.linux-amd64
- Used to collect operational metrics at the server level, then convert to a format recognized by prometheus, and then set up central services such as monitoring to actively capture data
process-exporter: 0.5.0.linux-amd64
- Mainly used to monitor service processes, but also to convert data to a fixed format, such as the central server to take the initiative to capture
grafana: 6.4.3.linux-amd64 >>>Official document https://grafana.com/docs/grafana/latest/
- A mature and complete tool for presenting data that can be used by most data sources throughout the market
Preparing for installation package
prometheus-2.13.1.linux-amd64.tar.gz
process-exporter-0.5.0.linux-amd64.tar.gz
node_exporter-0.18.1.linux-amd64.tar.gz
grafana-6.4.3.linux-amd64.tar.gz
- This article is installed using binary packages and decompressed directly
Install prometheus
Download the latest version and unzip it
Download address: https://prometheus.io/download/
tar xvfz prometheus-*.tar.gz
cd prometheus-*
Here is the basic configuration, which you can see in the full documentation> Official documentation: https://prometheus.io/docs/prometheus/2.13/configuration/configuration/
# my global config
global:
scrape_interval:     15s # Set the scrape interval to every 15 seconds. Default is every 1 minute.
evaluation_interval: 15s # Evaluate rules every 15 seconds. The default is every 1 minute.
# scrape_timeout is set to the global default (10s).

# Alertmanager configuration
alerting:
alertmanagers:
- static_configs:
 - targets:
   # - alertmanager:9093

# Load rules once and periodically evaluate them according to the global 'evaluation_interval'.
rule_files:
# - "first_rules.yml"
# - "second_rules.yml"

# A scrape configuration containing exactly one endpoint to scrape:
# Here it's Prometheus itself.
scrape_configs:
# The job name is added as a label `job=<job_name>` to any timeseries scraped from this config.
- job_name: 'prometheus'

 # metrics_path defaults to '/metrics'
 # scheme defaults to 'http'.

 static_configs:
 - targets: ['localhost:9090']
If the exporter component is later configured, you can add job s in scrape_configs, for example:
scrape_configs:
# The job name is added as a label `job=<job_name>` to any timeseries scraped from this config.
- job_name: 'prometheus'

 # metrics_path defaults to '/metrics'
 # scheme defaults to 'http'.

 static_configs:
 - targets: ['localhost:9090']

- job_name: 'node_exporter'
 static_configs:
 - targets: ['localhost:9100']
start-up
# Start Prometheus.
# By default, Prometheus stores its database in. /data (flag-storage.tsdb.path)
$ cd prometheus-2.13.1.linux-amd64/
$ nohup ./prometheus --config.file=prometheus.yml >/dev/null &
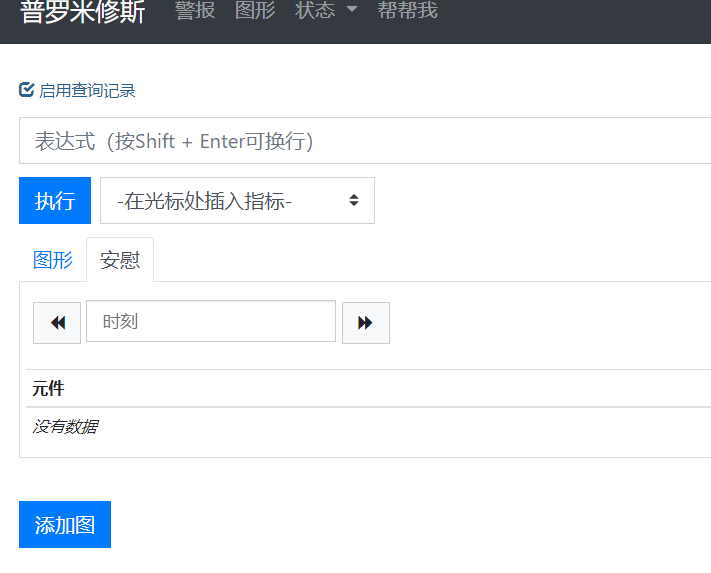
- Verification: Browsers can be accessed through http://ip:9090, or http://ip:9090/metrics to see if they can provide metrics about themselves
Install node_exporter
Download the binary installation package, install and start
wget https://github.com/prometheus/node_exporter/releases/download/v*/node_exporter-*.*-amd64.tar.gz
tar xvfz node_exporter-*.*-amd64.tar.gz
cd node_exporter-*.*-amd64
nohup ./node_exporter >/dev/null &
- Startup does not require a configuration file, in which case the server will have a listening port of 9100.
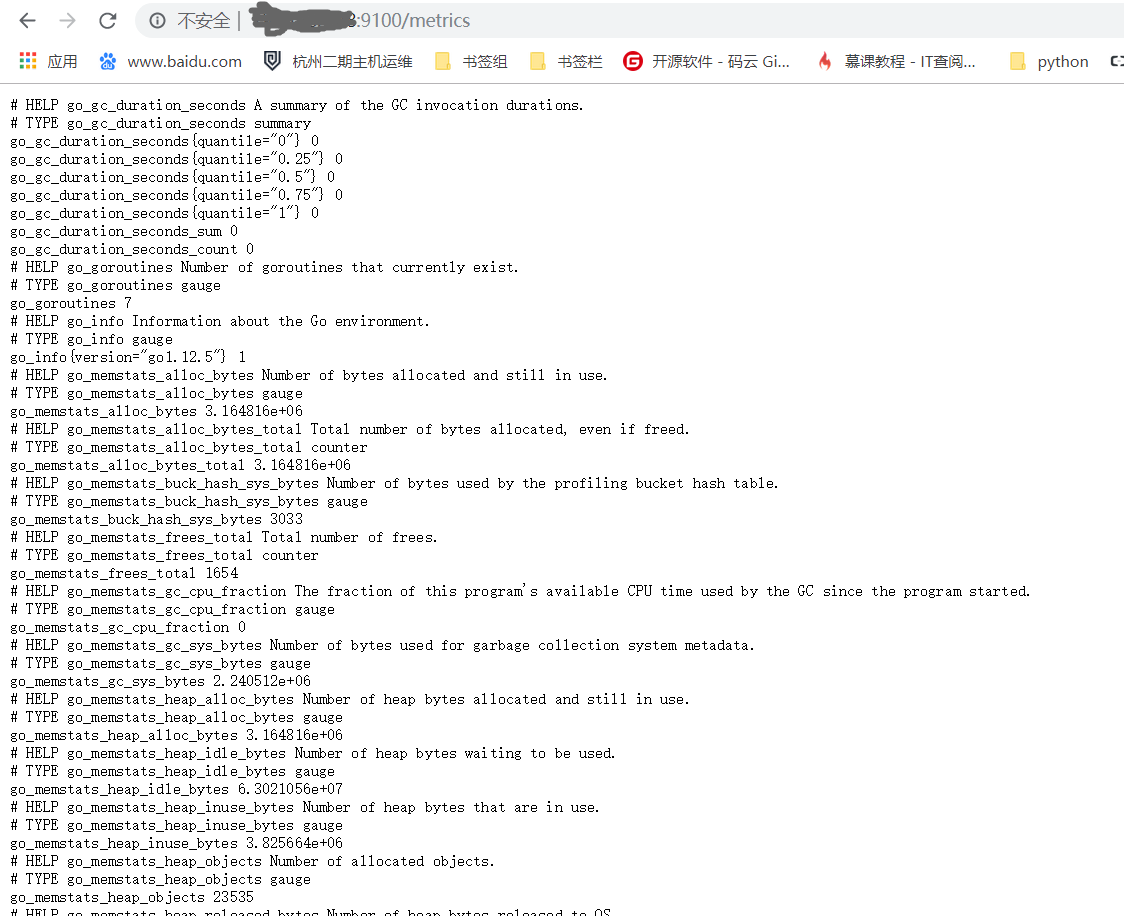
- Validation: Server metrics can be accessed by accessing the browser http://ip:9100/metrics
Install process_exporter
Download Binary Installation Package
$ wget https://github.com/ncabatoff/process-exporter/releases/download/v0.5.0/process-exporter-0.5.0.linux-amd64.tar.gz
$ tar -xvf  process-exporter-0.5.0.linux-amd64.tar.gz
$ ll
-rw-r--r-- 1 3434 3434    1076 Apr 14  2019 LICENSE
-rwxr-xr-x 1 3434 3434 7681088 Apr 14  2019 process-exporter
-rw-r--r-- 1 3434 3434   12958 Apr 14  2019 README.md
- There is no configuration file by default after this decompression. We need to write one by ourselves and specify the configuration file by -config.path at startup.
The essence of reading a configuration file is to read the name of the service configured inside and use the service name for pid lookup and analysis. Here is an example <Use the {{Matches}} template>to match two services, mysql and prometheus:
$ vim process.yaml
process_names:
  - name: "{{.Matches}}"
    cmdline:
    - 'mysqld'

  - name: "{{.Matches}}"
    cmdline:
    - 'prometheus'
start-up
# Start process_exporter.
nohup ./process-exporter -config.path process.yaml >/dev/null &
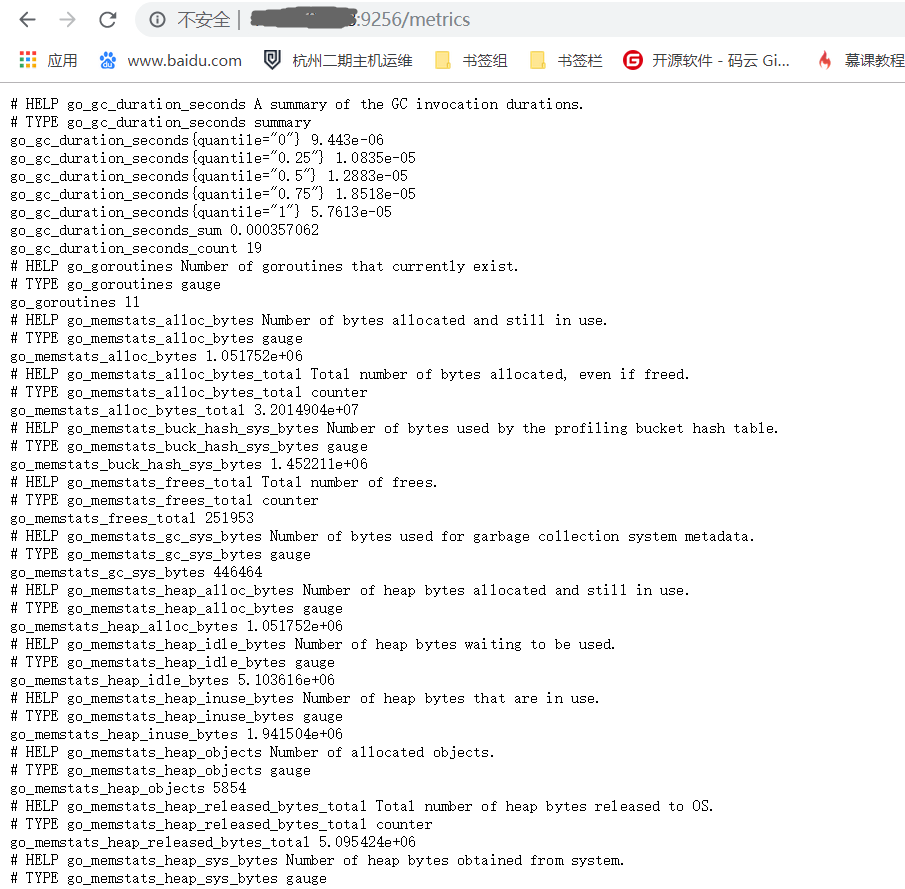
- Verification: Accessing the browser http://ip:9256/metrics returns the service process information specified in the configuration file
Install grafana
Download Binary Installation Package
wget https://dl.grafana.com/oss/release/grafana-6.4.3.linux-amd64.tar.gz
tar -zxvf grafana-6.4.3.linux-amd64.tar.gz
start-up
- It's a bit simpler to use the official binary startup method here, and the formal project recommendations are all configured as system system services
 $ cd grafana-6.4.3
 $ nohup ./bin/grafana-server web >/dev/null &
- Verify: Access browser http://ip:3000, default account password is: admin / admin

Configuring prometheus data sources using grafana
Go to the grafana administration page
Configure prometheus data source
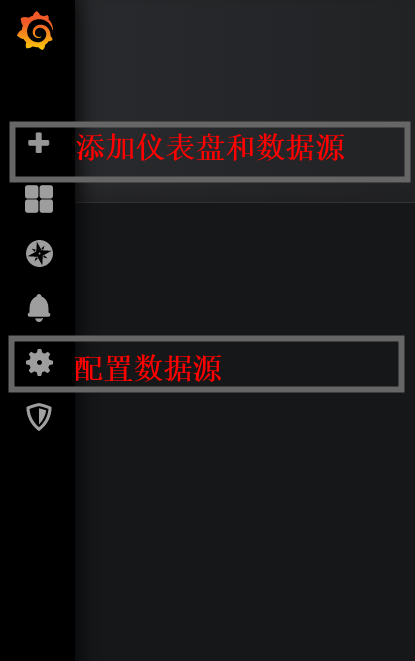
- Click the left gear icon - > Add data source - > > > prometheus
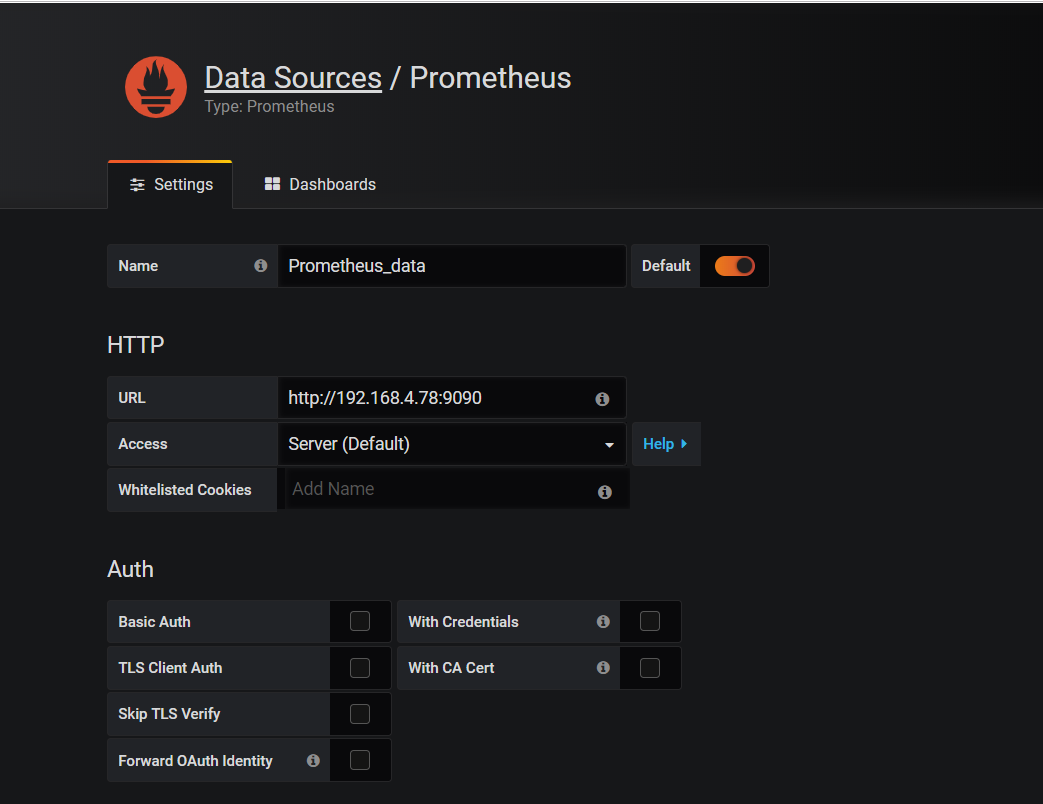
- Pull to the bottom, click Save&Test, then click on the gear to see the configured data source
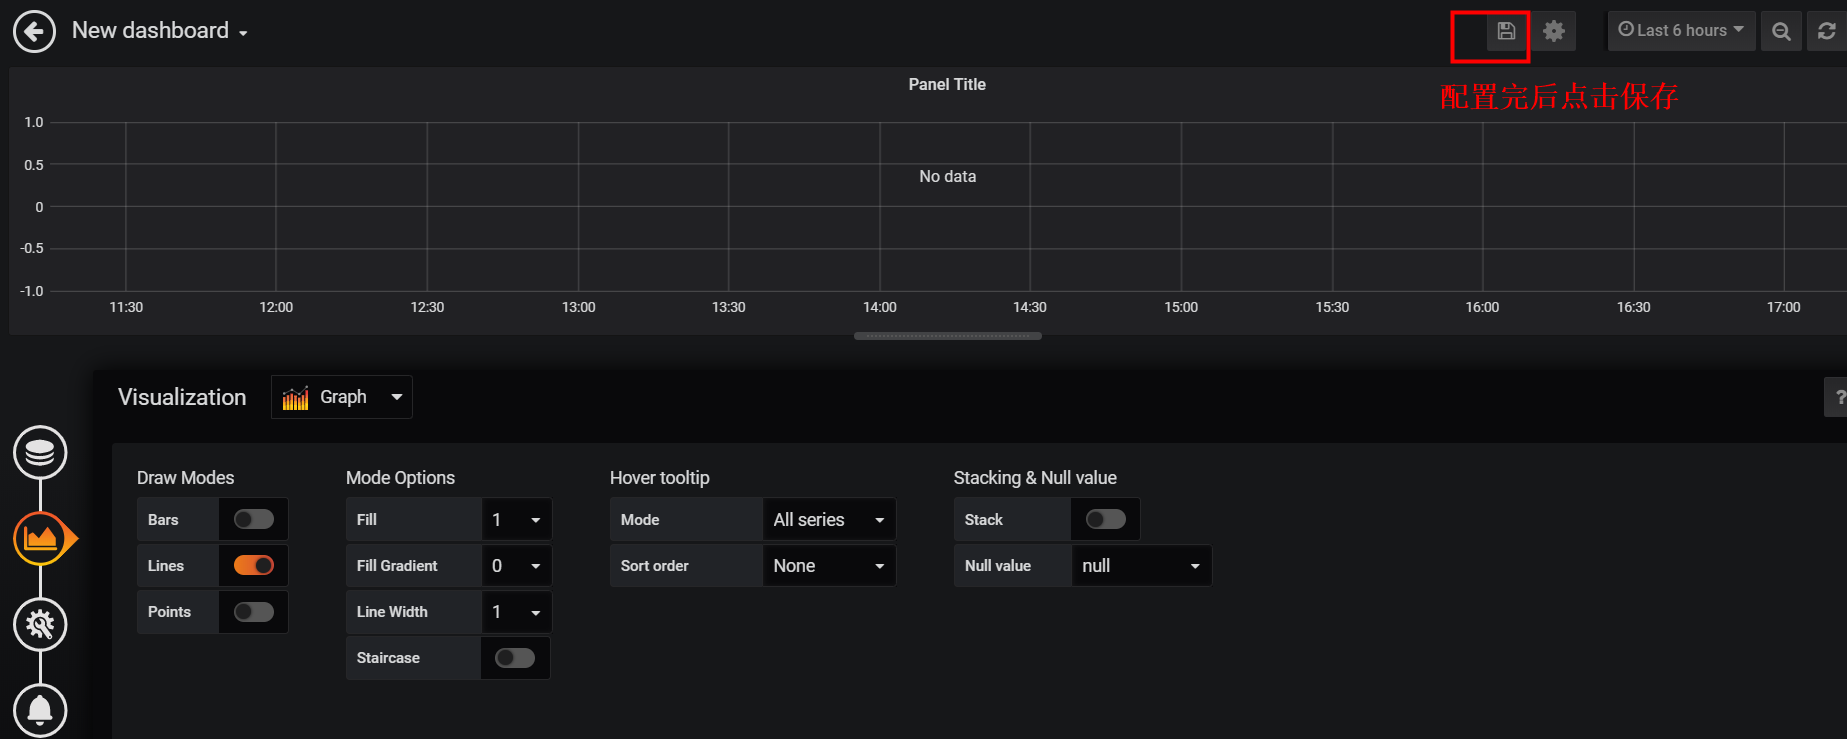
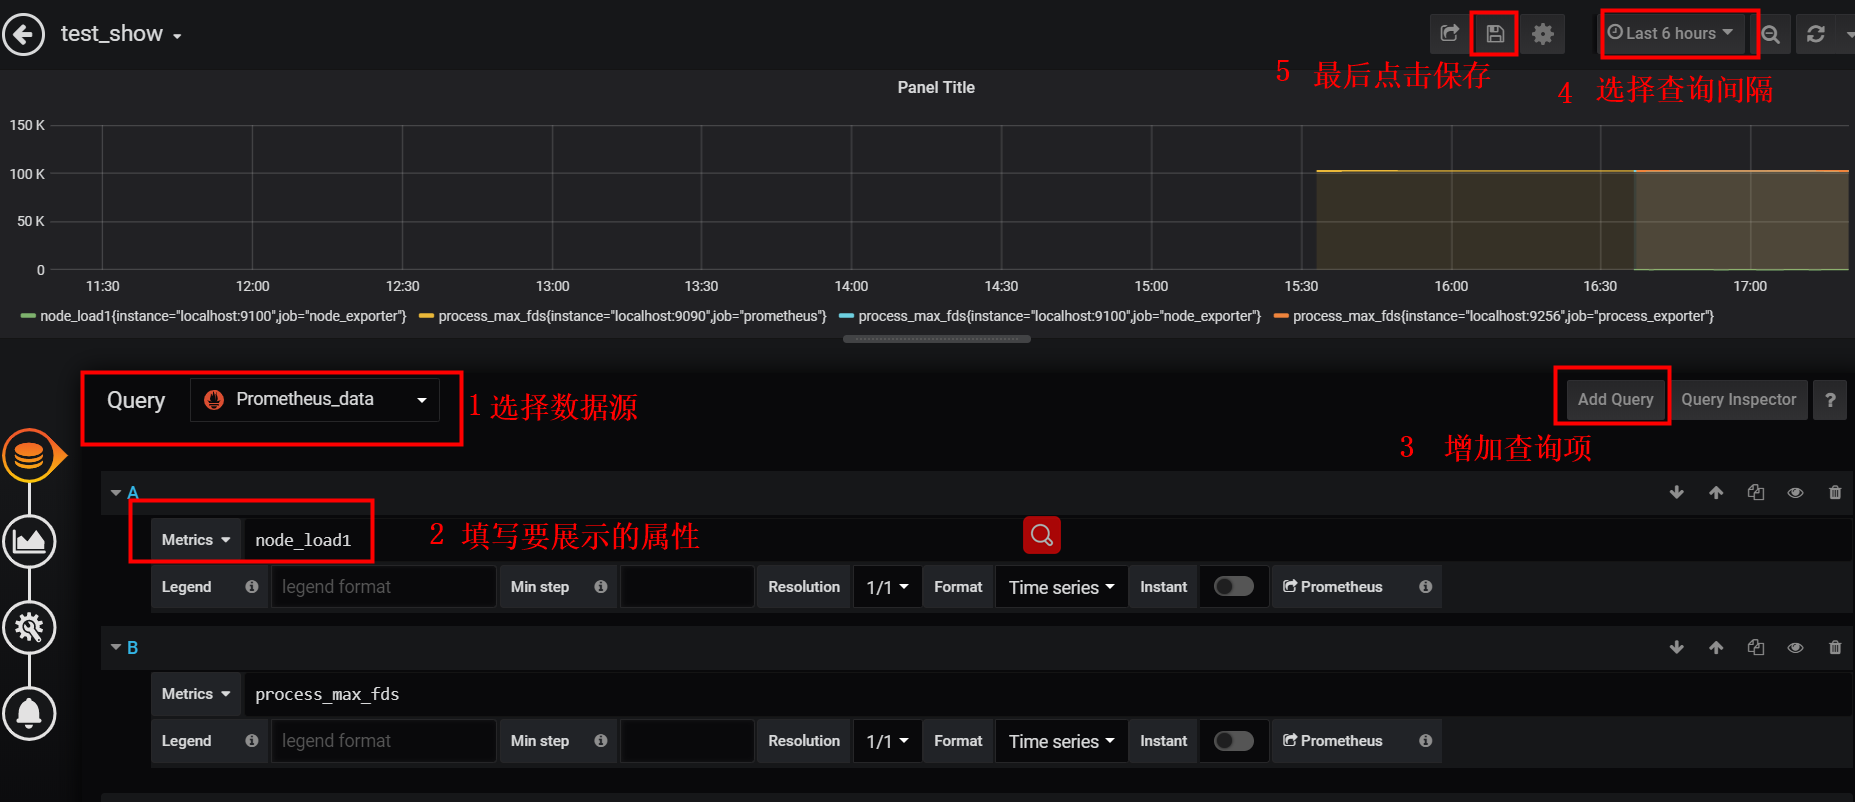
Add dashboard <can see last step directly>
- Click the plus icon on the left ->> Click Choose Visualization
Add a data source to the dashboard <see last step directly>
- Click on the icon of the box on the left ---> Select the dashboard you just saved -->> Click on the Title of the dashboard
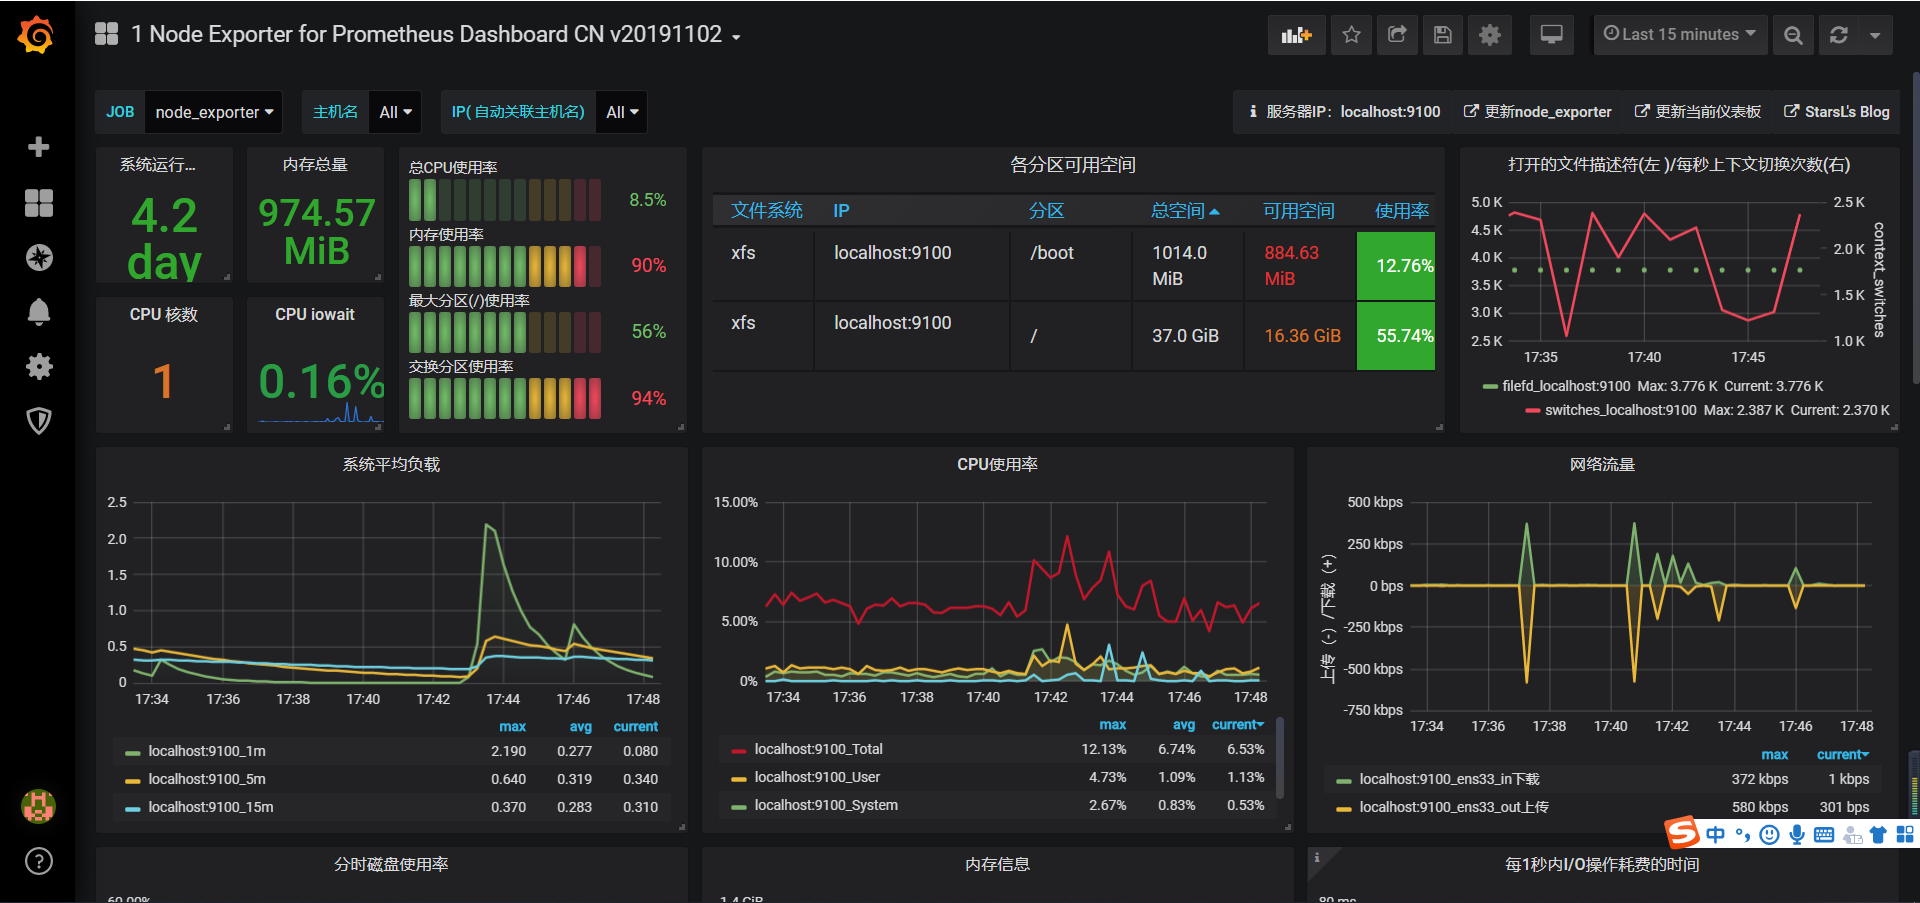
Use an existing dashboard template
- Click the icon on the left ---> import ->> fill in 8919 in Grafana.com Dashboard and wait a few seconds for ok
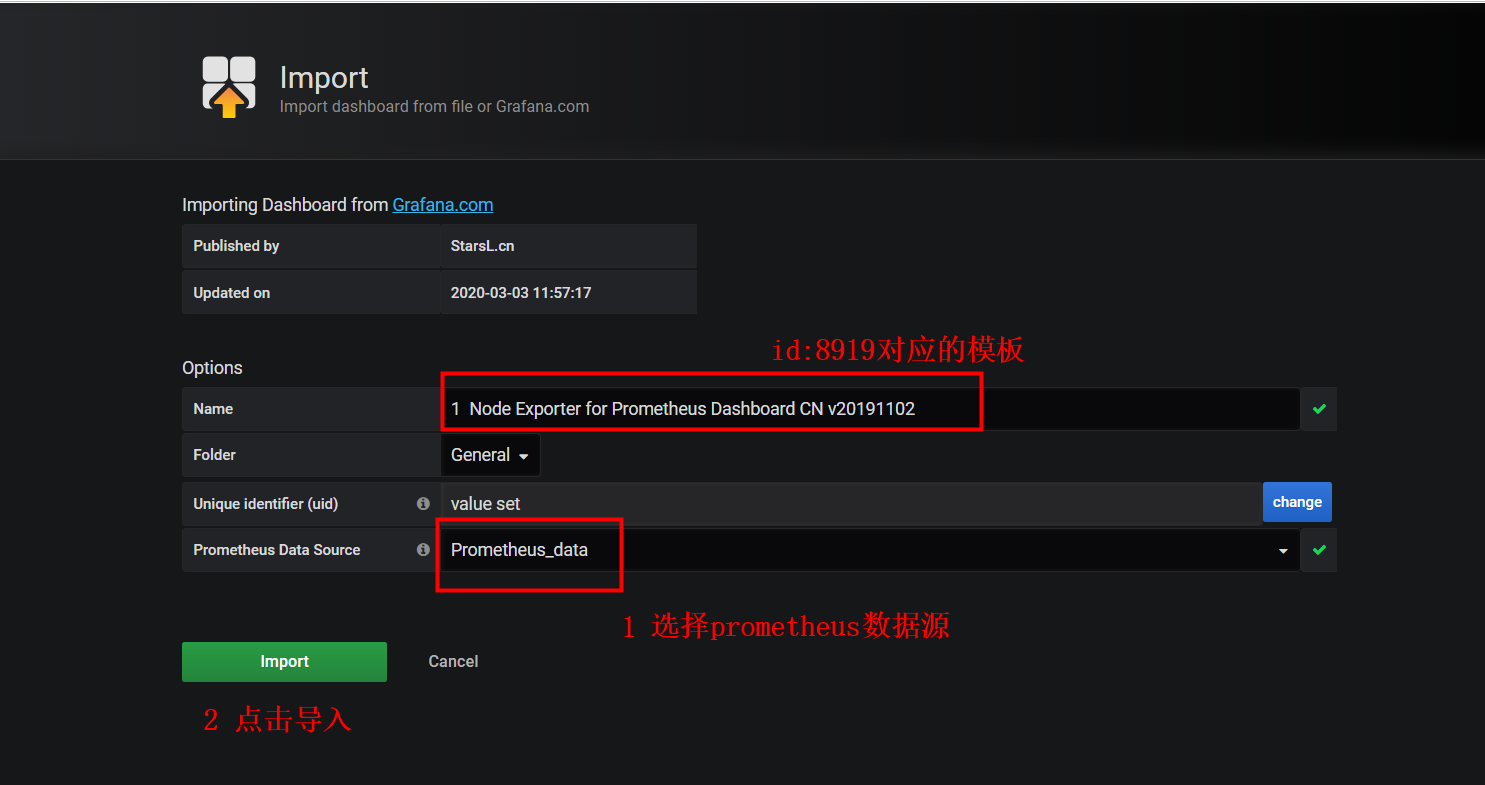
- Final Success