1. Prometheus installation
1.1 main components
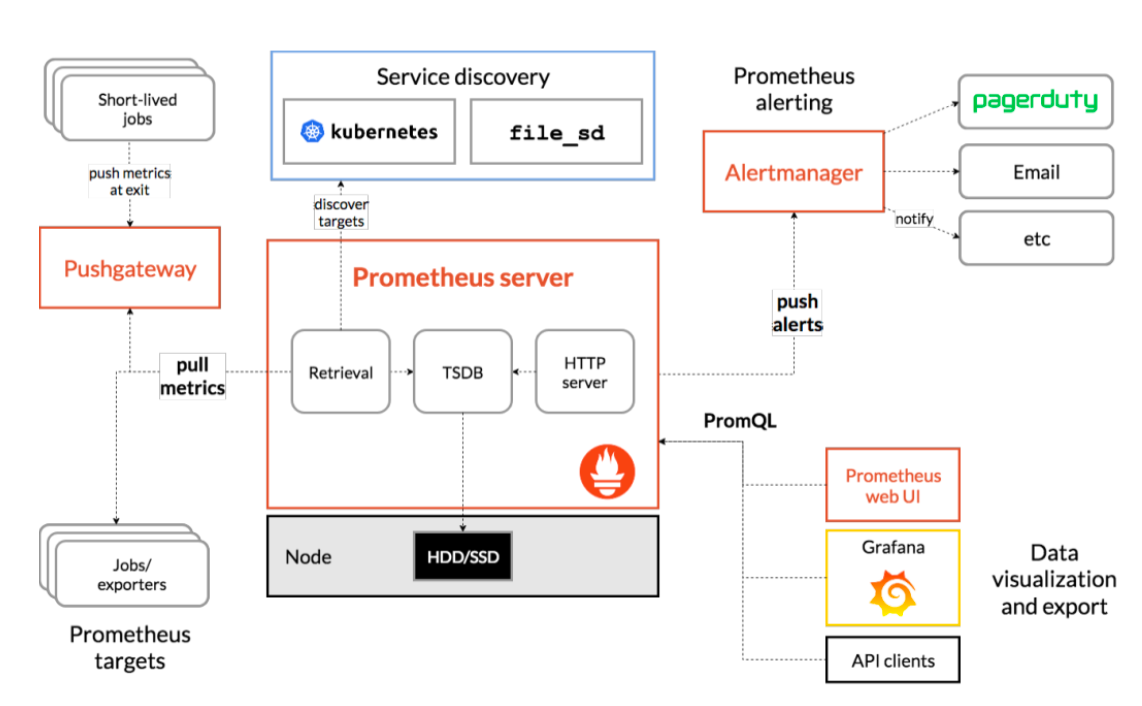
- Prometheus server: the main service, which accepts external http requests, collects, stores and queries data, etc
- Prometheus targets: statically collected target service data
- Service discovery: dynamic discovery of services
- Prometheus alerting: alarm notification
- Push gateway: data collection proxy server (similar to zabbix proxy)
- Data visualization and export: data visualization and data export (access client)
1.2 Prometheus Server installation
Official documents: https://prometheus.io/docs/prometheus/latest/installation/
Download: https://prometheus.io/download/
1.2.1 start through container
docker pull prom/prometheus:v2.31.1
docker run -it -d --restart=always -p 9090 prom/prometheus:v2.31.1
1.2.2 online installation
# apt search prometheus
# apt-cache madison prometheus
prometheus | 2.15.2+ds-2 | http://mirrors.aliyun.com/ubuntu focal/universe amd64 Packages
prometheus | 2.15.2+ds-2 | http://mirrors.aliyun.com/ubuntu focal/universe Sources
#apt install prometheus
1.2.3 Operator deployment
Official deployment documents: https://github.com/prometheus-operator/kube-prometheus
# git clone -b release-0.9 https://github.com/prometheus-operator/kube-prometheus.git # pay attention to the correspondence between version and k8s version
# cd kube-prometheus/
# kubectl apply -f manifests/setup
# kubectl apply -f manifests/

It can be modified as appropriate manifests and manifests/setup(grep -R image: *.yaml)in yaml The mirror source in the file.
1.2.3.1 verify Prometheus
kubectl port-forward --help  #Access the node on which it is executed, and temporarily expose the port
kubectl --namespace monitoring port-forward --address 0.0.0.0 svc/prometheus-k8s 9090:9090
1.2.3.2 SVC exposure Prometheus
# vim manifests/prometheus-service.yaml
apiVersion: v1
kind: Service
metadata:
  labels:
    app.kubernetes.io/component: prometheus
    app.kubernetes.io/name: prometheus
    app.kubernetes.io/part-of: kube-prometheus
    app.kubernetes.io/version: 2.29.1
    prometheus: k8s
  name: prometheus-k8s
  namespace: monitoring
spec:
  type: NodePort
  ports:
  - name: web
      port: 9090
      nodePort: 39090
      targetPort: web
  selector:
    app: prometheus app.kubernetes.io/component: prometheus
    app.kubernetes.io/name: prometheus
    app.kubernetes.io/part-of: kube-prometheus
    prometheus: k8s
  sessionAffinity: ClientIP

# kubectl apply -f manifests/prometheus-service.yaml
service/prometheus-k8s configured
1.2.3.3 validation of Grafana
# kubectl --namespace monitoring port-forward --address 0.0.0.0 svc/grafana 3000:3000
1.2.3.4 SVC exposure to Grafana
# vim manifests/grafana-service.yaml
apiVersion: v1
kind: Service
metadata:
  labels:
    app.kubernetes.io/component: grafana
    app.kubernetes.io/name: grafana
    app.kubernetes.io/part-of: kube-prometheus
    app.kubernetes.io/version: 8.1.1
name: grafana
namespace: monitoring
spec:
  type: NodePort
  ports:
  - name: http
      port: 3000
      targetPort: http
      nodePort: 33000
  selector:
    app.kubernetes.io/component: grafana
    app.kubernetes.io/name: grafana
    app.kubernetes.io/part-of: kube-prometheus
1.2.4 official binary deployment
1.2.4.1 download the official binary package
# mkdir /apps
# tar xvf prometheus-2.31.1.linux-amd64.tar.gz
# ln -sv /apps/prometheus-2.31.1.linux-amd64 /apps/prometheus
'/apps/prometheus' -> '/apps/prometheus-2.31.1.linux-amd64'
# cd /apps/prometheus # ll
prometheus* #prometheus service executable
prometheus.yml #configuration file
promtool* #Test tool, used to detect prometheus configuration files, detect metrics data, etc
# ./promtool check config prometheus.yml Checking prometheus.yml
SUCCESS: 0 rule files found
1.2.4.2 create a service file
# vim /etc/systemd/system/prometheus.service
[Unit]
Description=Prometheus Server Documentation=https://prometheus.io/docs/introduction/overview/
After=network.target
[Service]
Restart=on-failure WorkingDirectory=/apps/prometheus/
ExecStart=/apps/prometheus/prometheus --config.file=/apps/prometheus/prometheus.yml
[Install]
WantedBy=multi-user.target
1.2.4.3 start prometheus service
# systemctl daemon-reload && systemctl restart prometheus && systemctl enable prometheus
1.2.4.4 installing Node_exporter
1.2.4.4.1 install node on node_exporter
https://prometheus.io/download/
# wget https://github.com/prometheus/node_exporter/releases/download/v1.2.2/node_exporter-1.2.2.linux-amd64.tar.gz
# mkdir /apps
# tar xf node_exporter-1.2.2.linux-amd64.tar.gz  -C /apps
# ln -sv node_exporter-1.2.2.linux-amd64/ node_exporter
1.2.4.4.2 configure node_exporter's service file
# vim /etc/systemd/system/node-exporter.service
[Unit]
Description=Prometheus Node Exporter After=network.target
[Service]
ExecStart=/apps/node_exporter/node_exporter --web.listen-address=":9110"
[Install]
WantedBy=multi-user.target
1.2.4.4.3 start node_exporter service
# systemctl daemon-reload && systemctl restart node-exporter && systemctl enable node-exporter.service
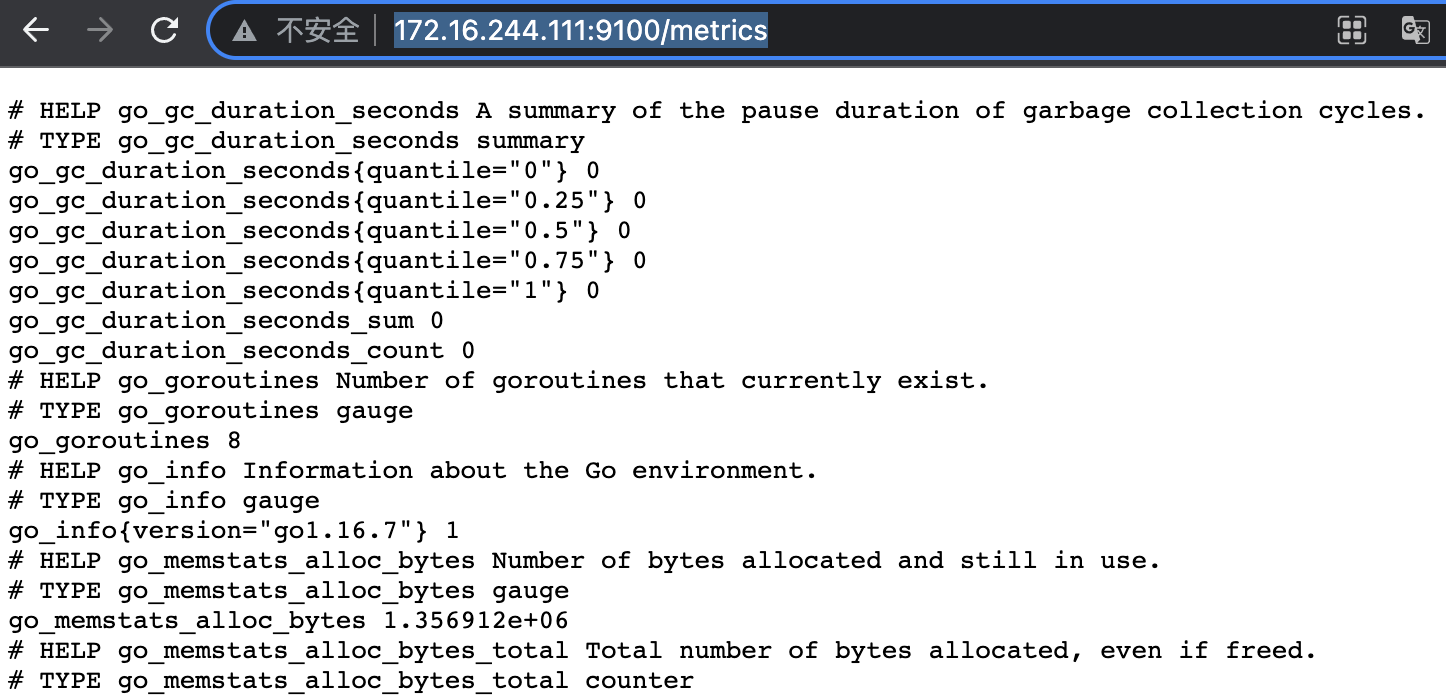
1.2.4.4.4 verification services
1.2.4.5 configure Prometheus to collect node index data
Configure Prometheus to collect node node monitoring indicator data through node exporter.
# vim /apps/prometheus/prometheus.yml
# my global config
global:
scrape_interval: 15s # Set the scratch interval to every 15 seconds. Default is every 1 minute. If not configured, the default is one minute
evaluation_interval: 15s # Evaluate rules every 15 seconds. The default is every 1 minute. If not configured, the default is one minute
# scrape_timeout is set to the global default (10s)
# Alertmanager configuration alarm notification configuration
alerting:
alertmanagers:
- static_configs:
- targets:
# - alertmanager:9093
# Load rules once and periodically evaluate them according to the global 'evaluation_interval'. rule_files: #Rule configuration
# - "first_rules.yml"
# - "second_rules.yml"
# A scrape configuration containing exactly one endpoint to scrape:
# Here it's Prometheus itself.
scrape_configs: #Data collection target configuration
# The job name is added as a label `job=<job_name>` to any timeseries scraped from this config.
- job_name: "prometheus"
# metrics_path defaults to '/metrics'
# scheme defaults to 'http'.
static_configs:
- targets: ["localhost:9090"]
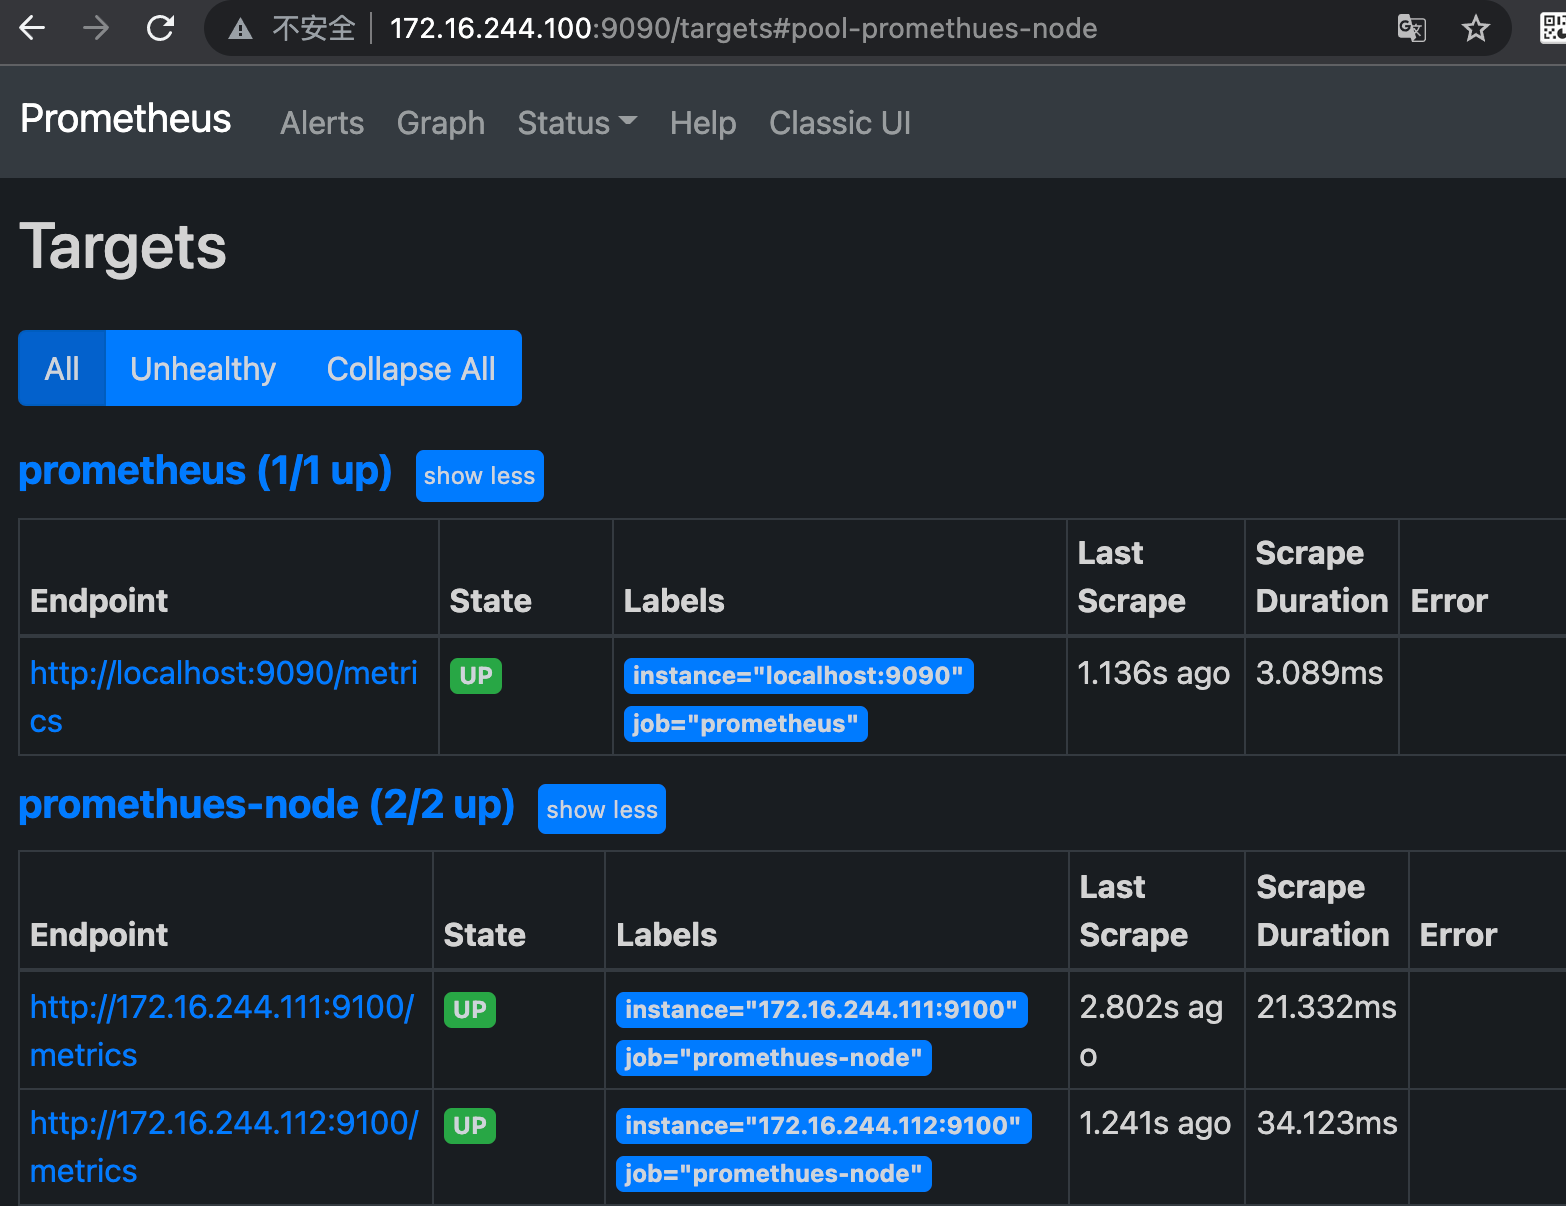
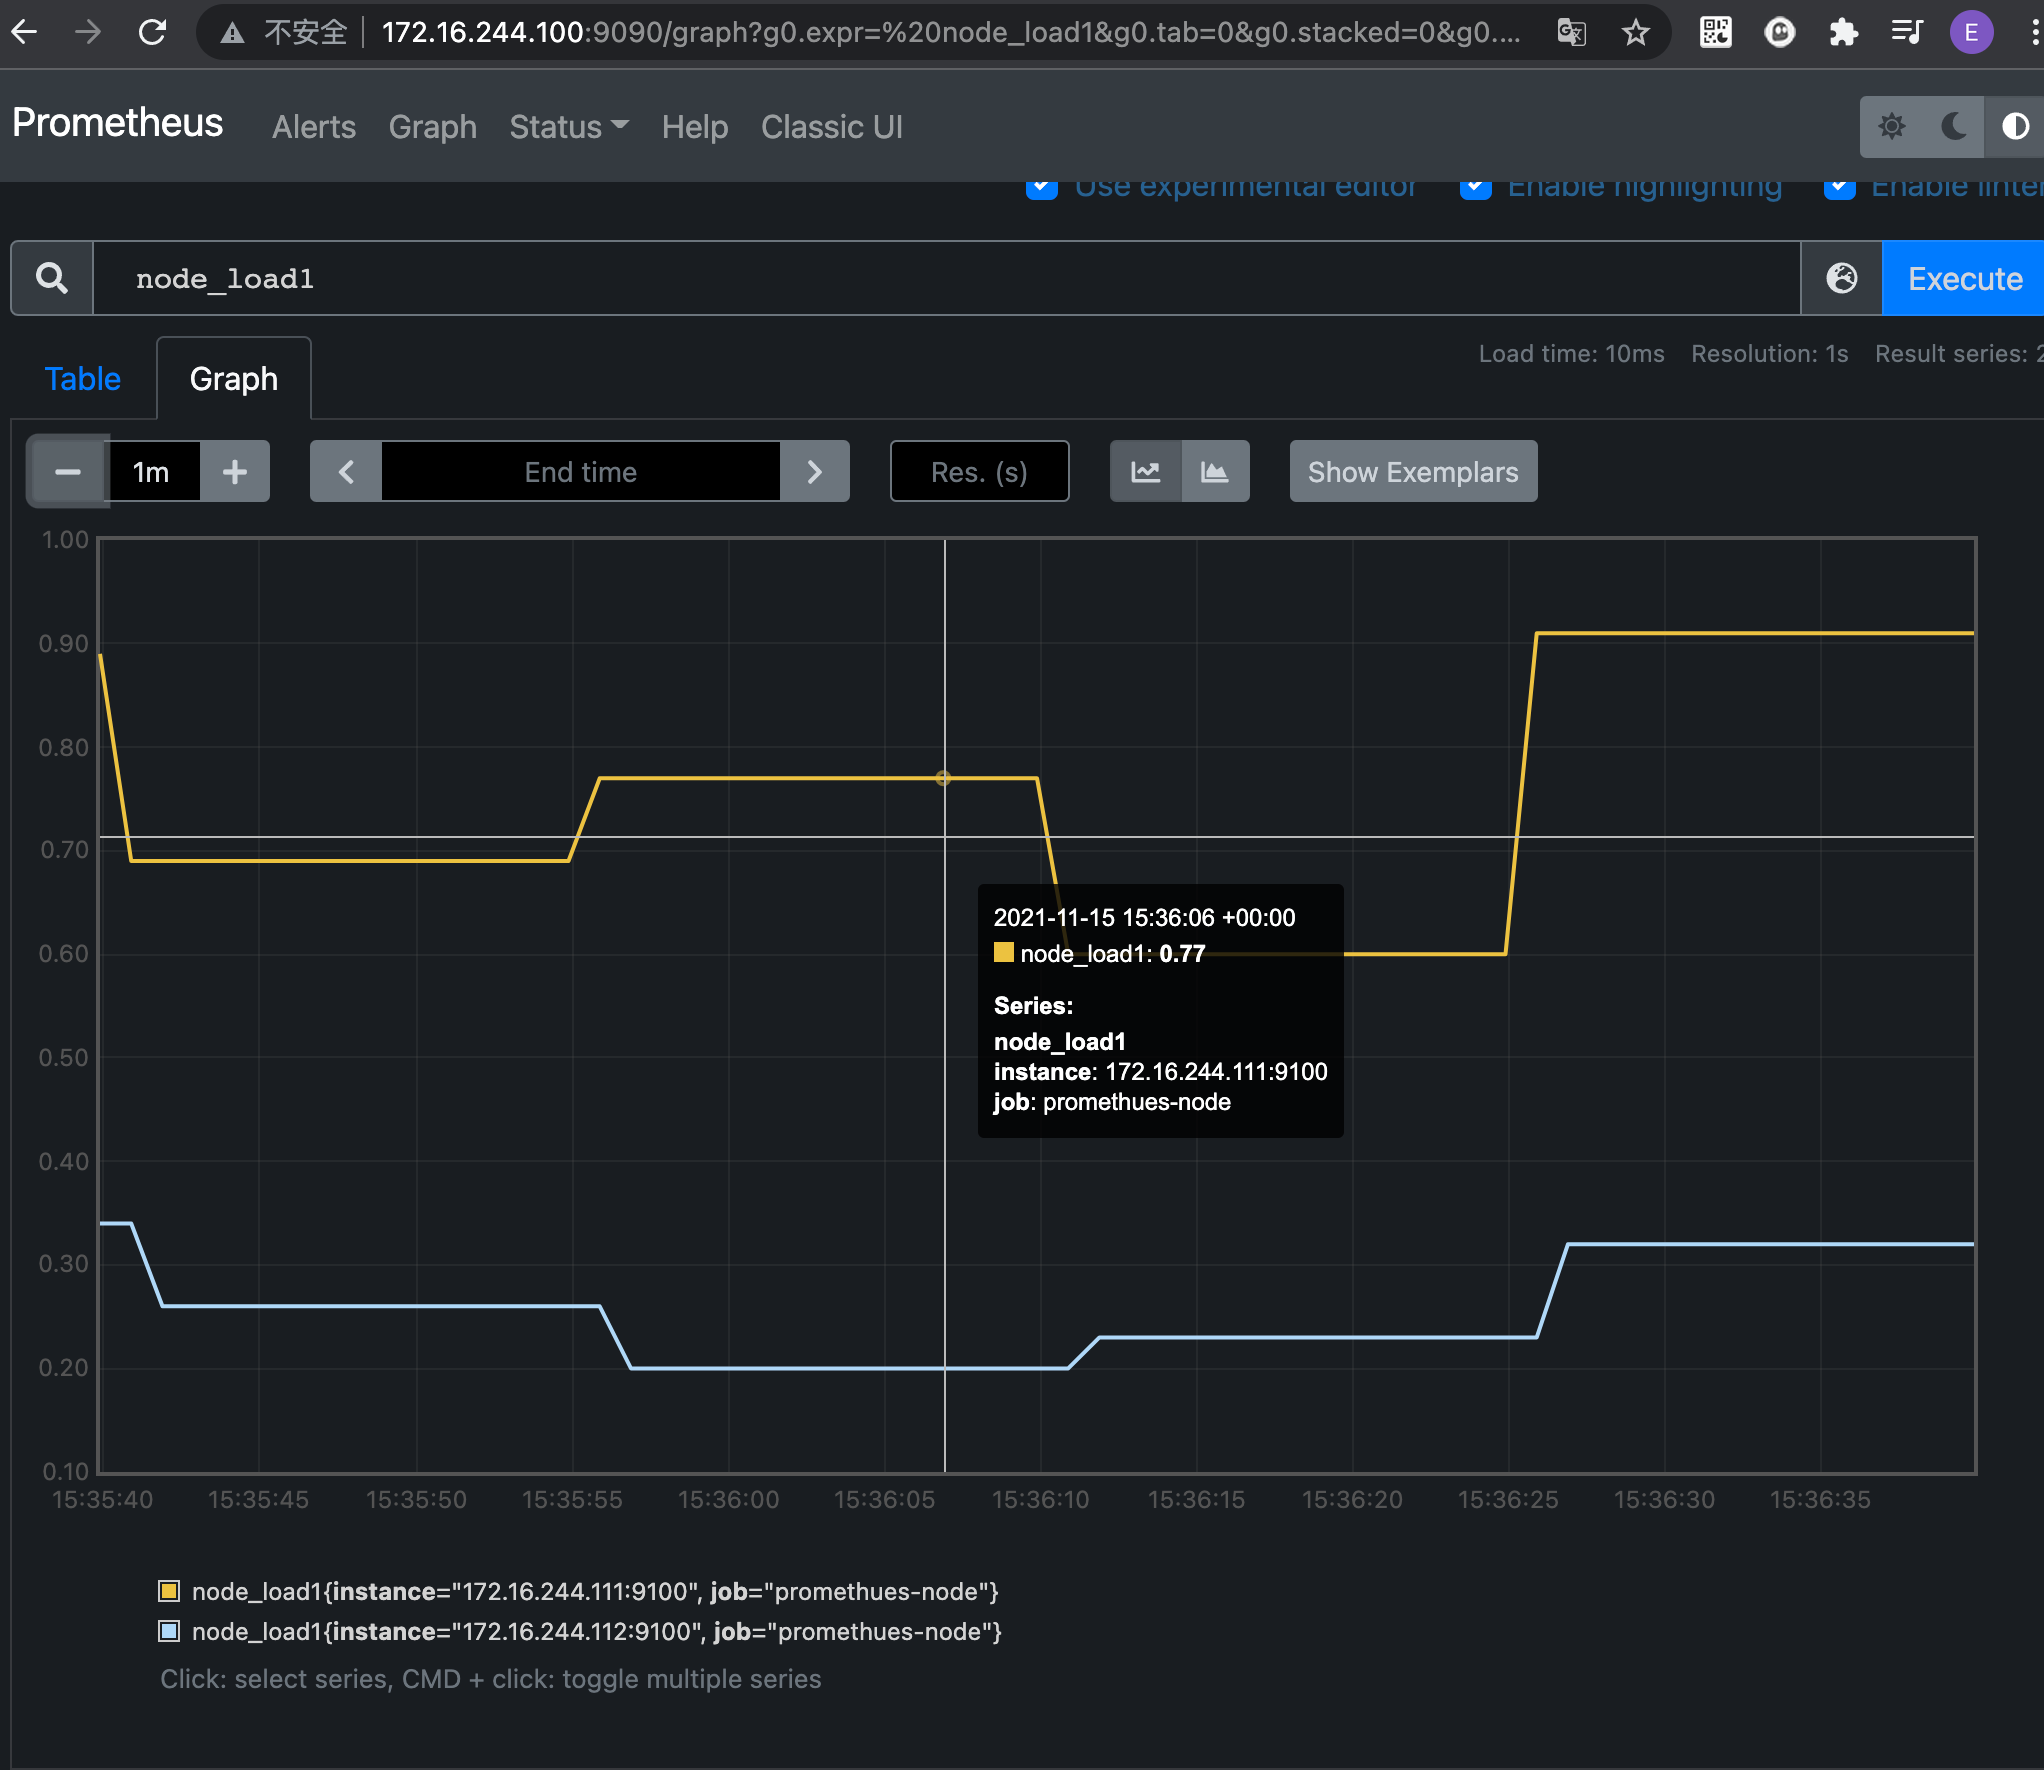
- job_name: 'promethues-node'
static_configs:
- targets: ['172.16.244.111:9110','172.16.244.112:9110']
# systemctl restart prometheus.service
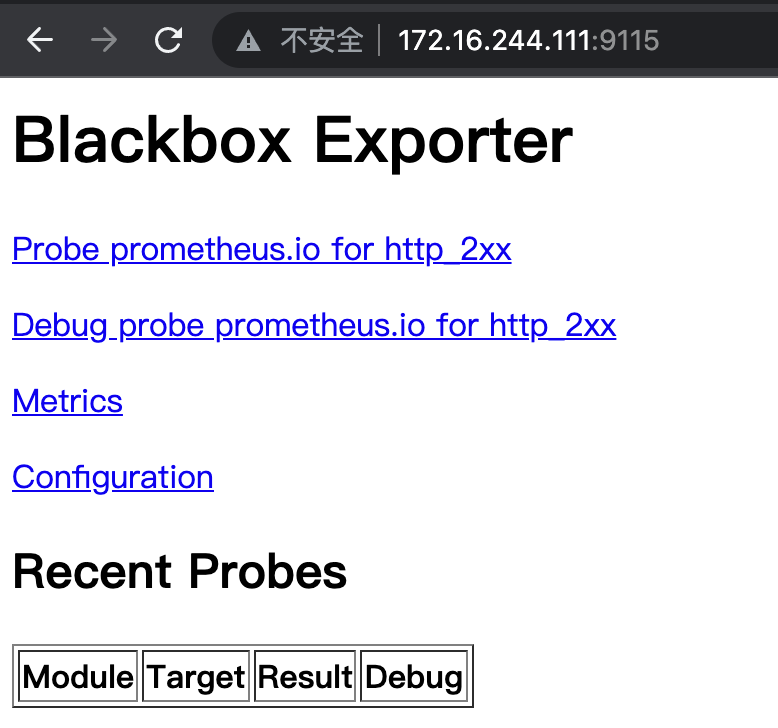
1.2.4.6 installing the blackbox exporter
https://prometheus.io/download/#blackbox_exporter
blackbox_exporter is an exporter officially provided by Prometheus. It can monitor and collect data from monitored nodes through HTTP, HTTPS, DNS, TCP and ICMP.
- HTTP/HTPPS:URL/API availability detection
- TCP: Port listening detection ICMP: host survival detection
- DNS: domain name resolution
1.2.4.6.1 deployment on node
# wget https://github.com/prometheus/blackbox_exporter/releases/download/v0.19.0/blackbox_exporter-0.19.0.linux-amd64.tar.gz
# tar xf /root/blackbox_exporter-0.19.0.linux-amd64.tar.gz  -C /apps
# ln -sv /apps/blackbox_exporter-0.19.0.linux-amd64 /apps/blackbox_exporter
1.2.4.6.2 configuration file
# cat blackbox.yml #Generally, it doesn't need to be moved, because the blackbox configures which service to monitor through the prometheus server, the server sends the monitoring request, and the client collects the monitoring data and pushes it to the server. Therefore, the configuration module of the client only defines some startup modules.
modules:
  http_2xx:
    prober: http
  http_post_2xx:
    prober: http
    http:
      method: POST
  tcp_connect:
    prober: tcp
  pop3s_banner:
    prober: tcp
    tcp:
      query_response:
      - expect: "^+OK"
      tls: true
      tls_config:
        insecure_skip_verify: false
  ssh_banner:
    prober: tcp
    tcp:
      query_response:
      - expect: "^SSH-2.0-"
      - send: "SSH-2.0-blackbox-ssh-check"
  irc_banner:
    prober: tcp
    tcp:
      query_response:
      - send: "NICK prober"
      - send: "USER prober prober prober :prober"
      - expect: "PING :([^ ]+)"
        send: "PONG ${1}"
      - expect: "^:[^ ]+ 001"
  icmp:
    prober: icmp
1.2.4.6.3 configuring service files
# vim /etc/systemd/system/blackbox-exporter.service
[Unit]
Description=Prometheus Blackbox Exporter
After=network.target
[Service]
Type=simple
User=root
Group=root
ExecStart=/apps/blackbox_exporter/blackbox_exporter \
    --config.file=/apps/blackbox_exporter/blackbox.yml \
    --web.listen-address=:9115
Restart=on-failure
[Install]
WantedBy=multi-user.target
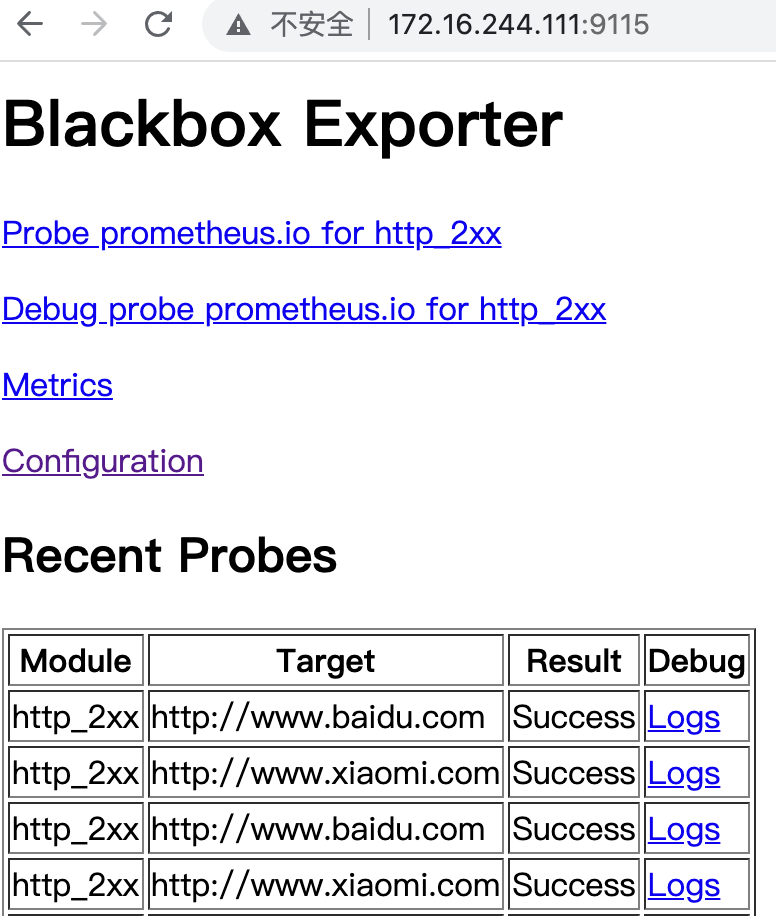
1.2.4.6.4 Start black_exporter and verify
systemctl daemon-reload && systemctl restart blackbox-exporter.service && systemctl enable blackbox-exporter.service
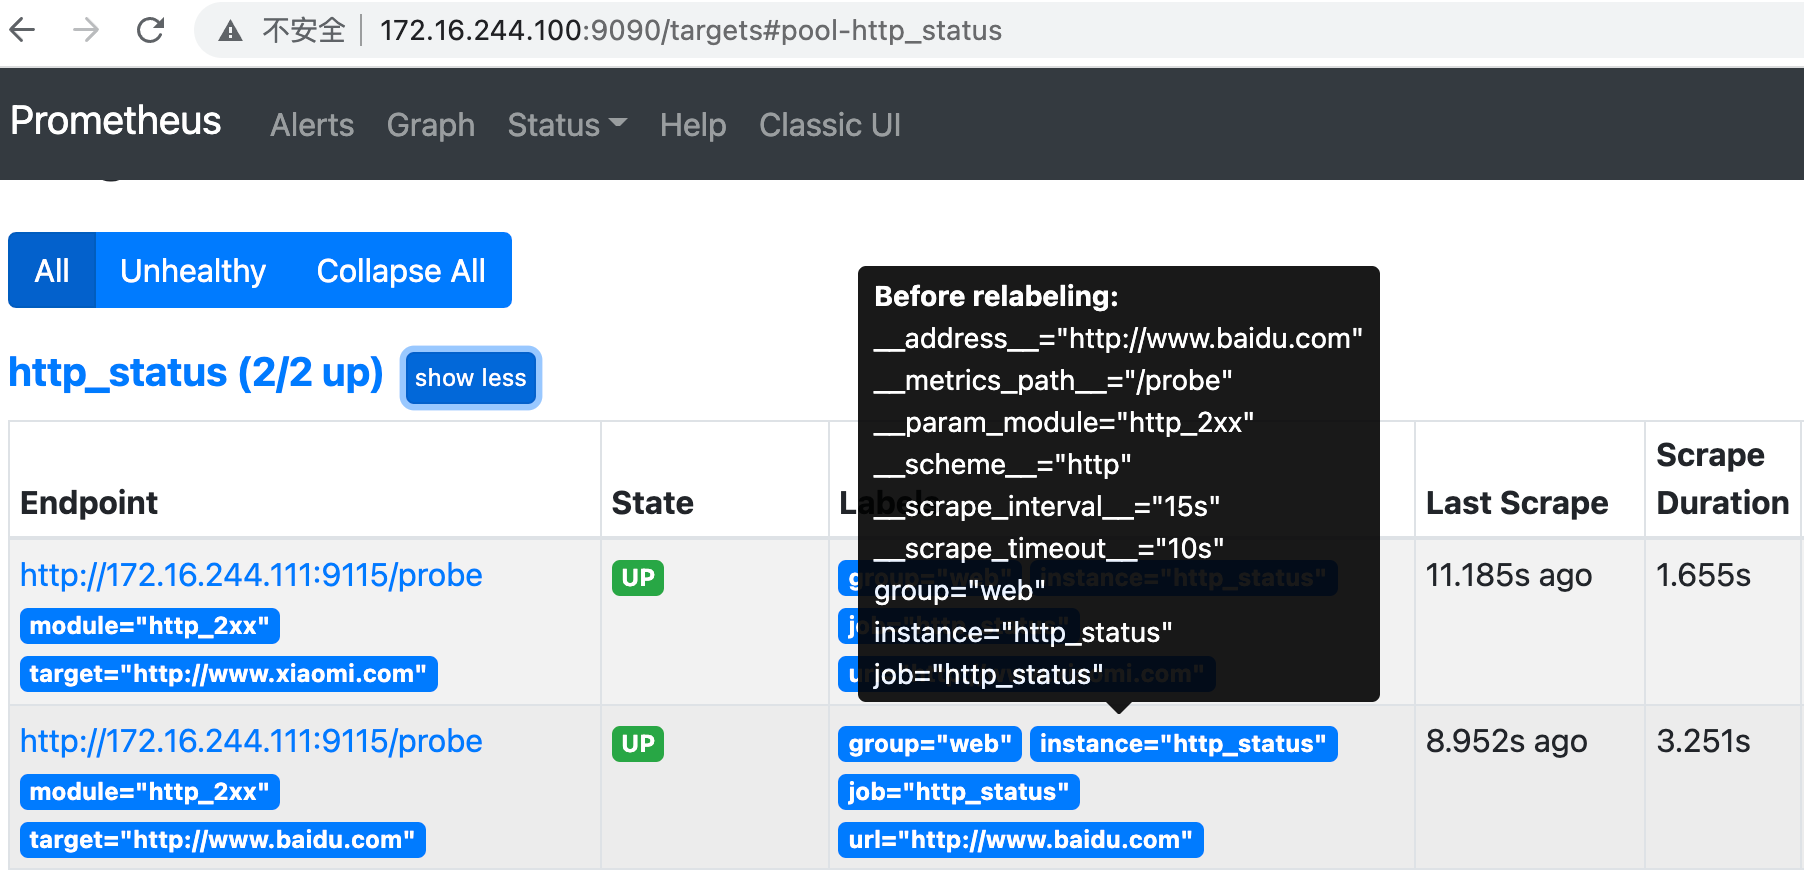
1.2.4.7 blackbox exporter realizes URL monitoring
# vim /apps/prometheus/prometheus.yml
# Website monitoring
- job_name: 'http_status'
  metrics_path: /probe
  params:
    module: [http_2xx]
  static_configs:
    - targets: ['http://www.xiaomi.com', 'http://www.baidu.com']
      labels:
        instance: http_status
        group: web
  relabel_configs:
    - source_labels: [__address__] #relabel through__ address__ (current destination address) write__ param_target tag to create a label.
      target_label: __param_target #Monitoring target www.xiaomi.com as__ address__ value of
    - source_labels: [__param_target] #Monitoring target
      target_label: url #Create a label between the monitoring target and the url
    - target_label: __address__
      replacement: 172.16.244.111:9115
# /apps/prometheus/promtool check config /apps/prometheus/prometheus.yml
Checking /apps/prometheus/prometheus.yml
SUCCESS: 0 rule files found
# systemctl restart prometheus.service
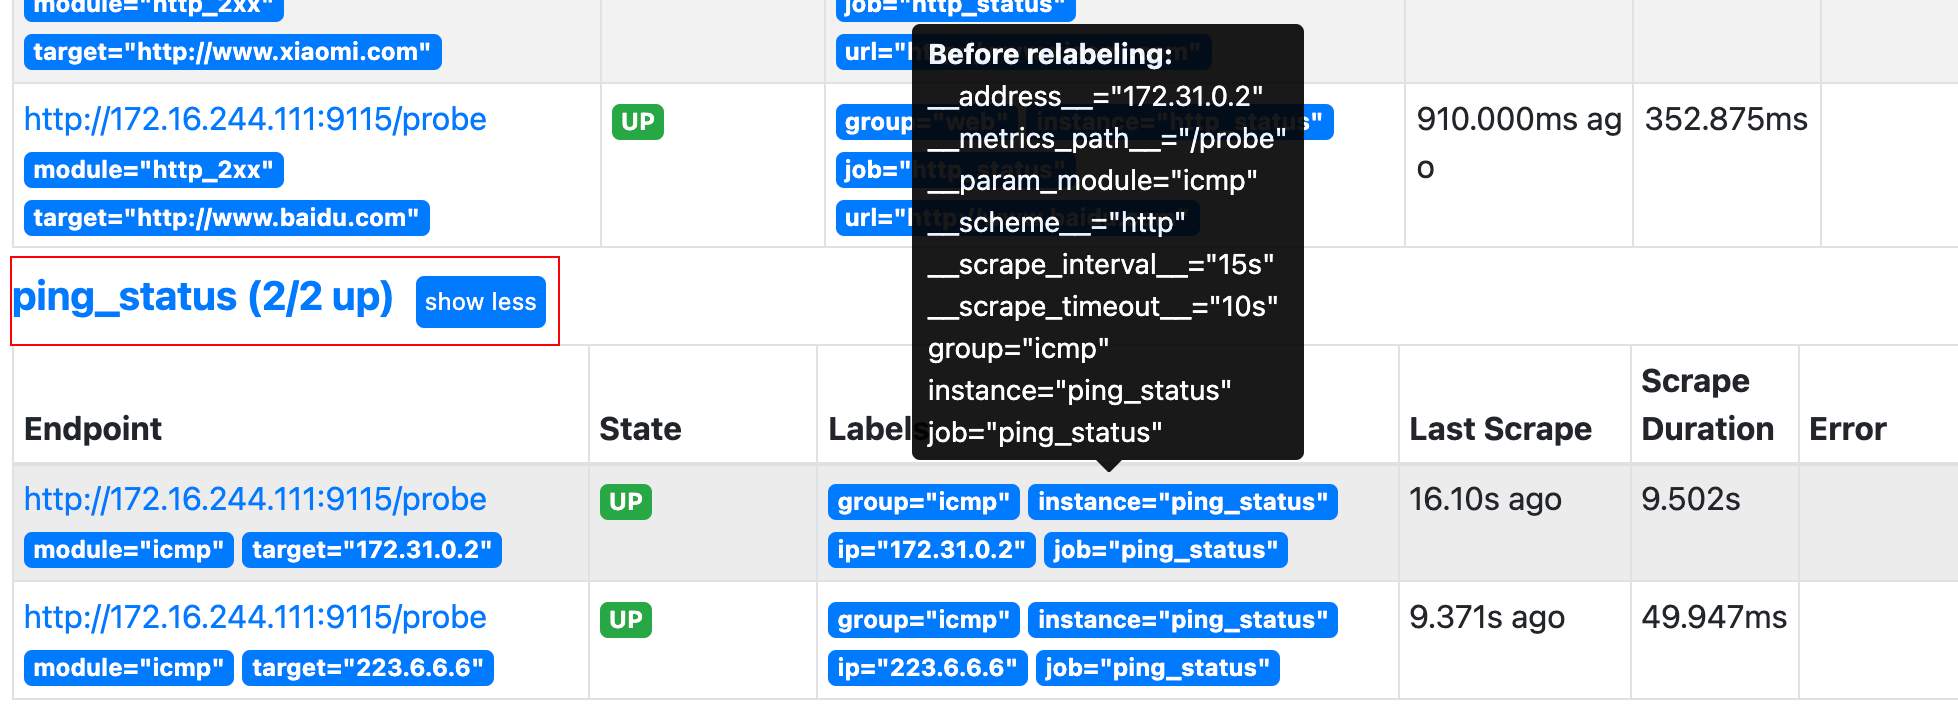
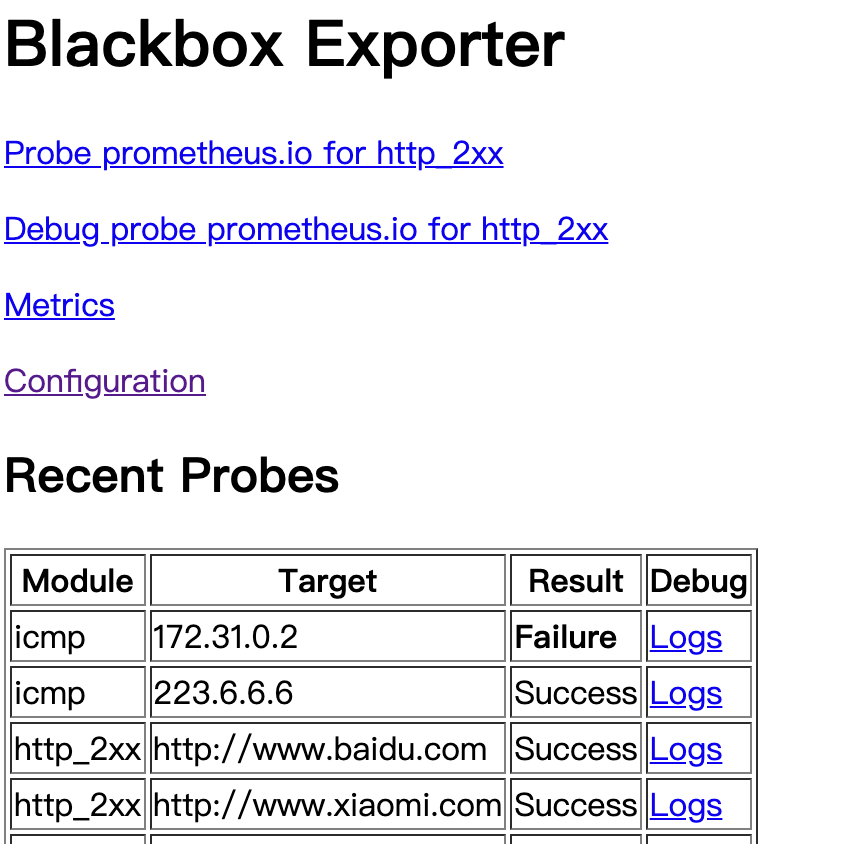
1.2.4.8 implementation of ICMP monitoring by blackbox exporter
# vim /apps/prometheus/prometheus.yml
# icmp detection
  - job_name: 'ping_status'
    metrics_path: /probe
    params:
      module: [icmp]
    static_configs:
      - targets: ['172.31.0.2',"223.6.6.6"]
        labels:
          instance: 'ping_status'
          group: 'icmp'
    relabel_configs:
      - source_labels: [__address__]
        target_label: __param_target
      - source_labels: [__param_target]
        target_label: ip #Connect ip with__ param_target creates a label
      - target_label: __address__
        replacement: 172.16.244.111:9115
# /apps/prometheus/promtool check config /apps/prometheus/prometheus.yml
Checking /apps/prometheus/prometheus.yml
SUCCESS: 0 rule files found
# systemctl restart prometheus.service
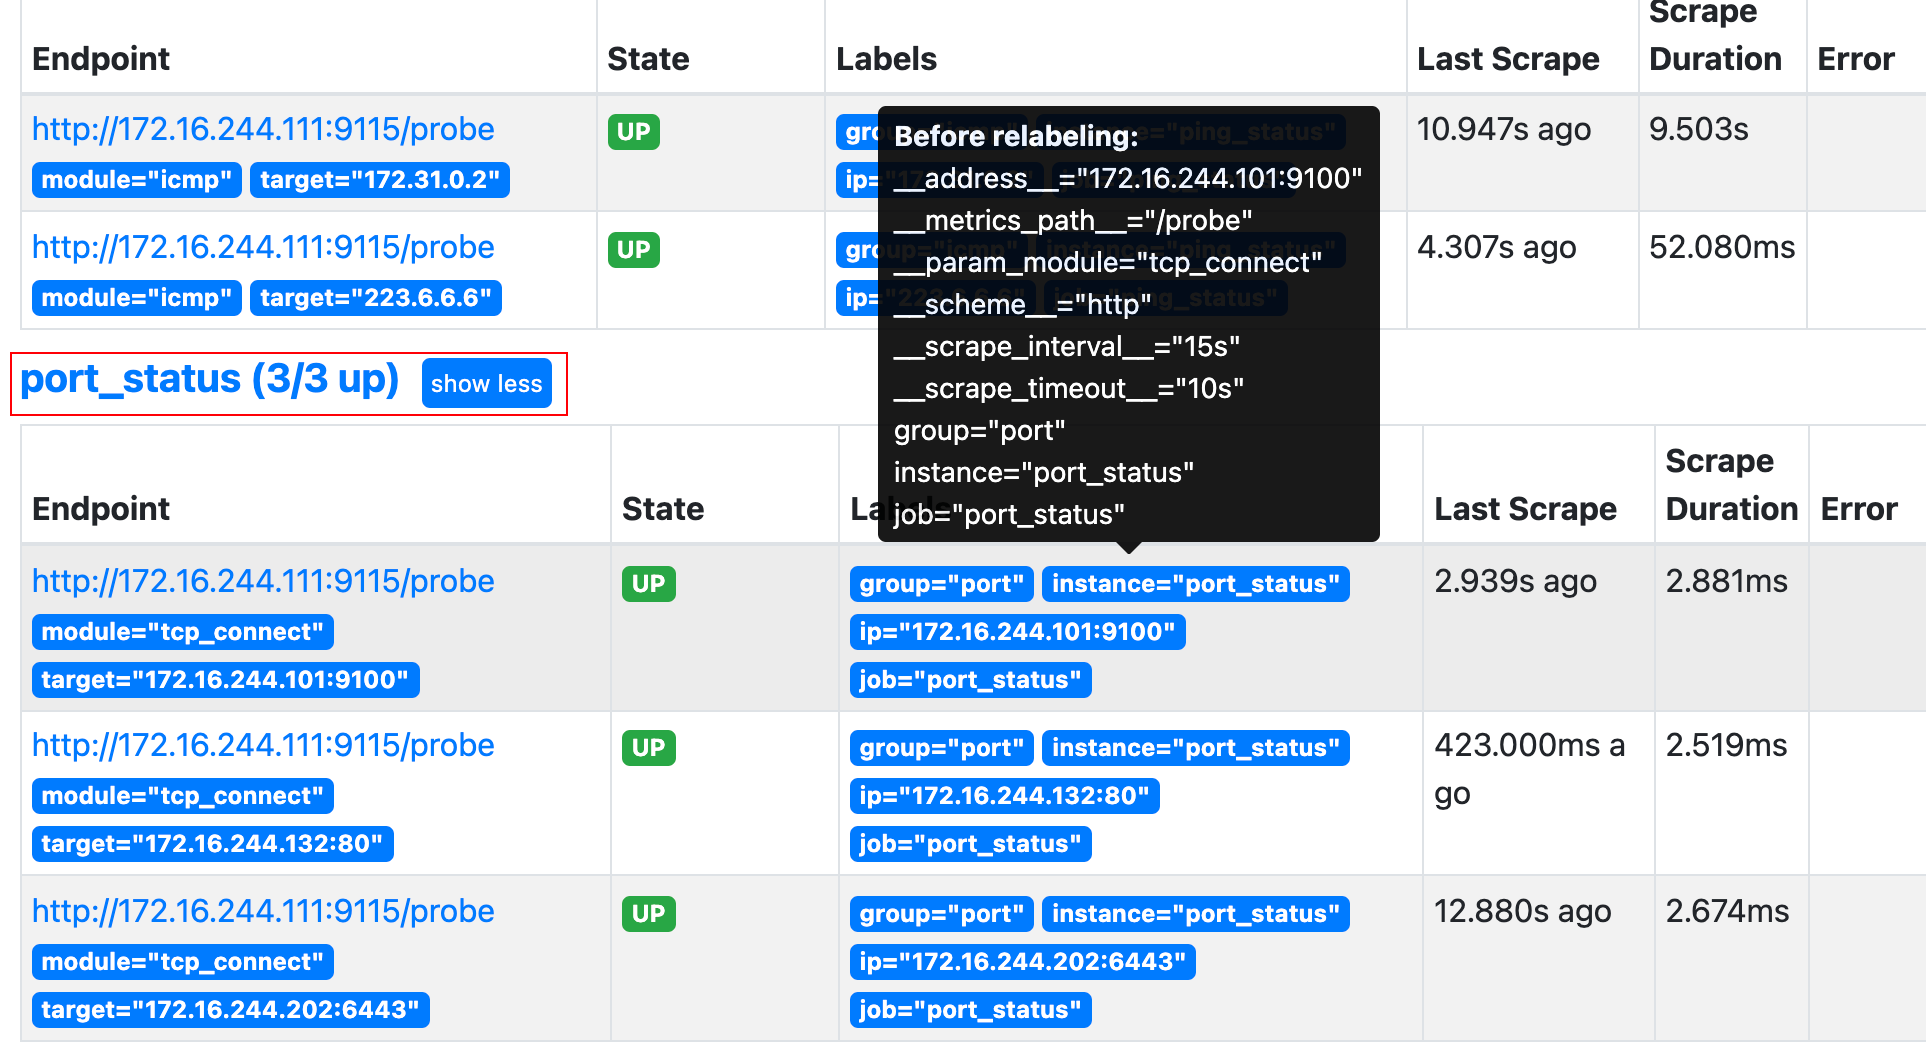
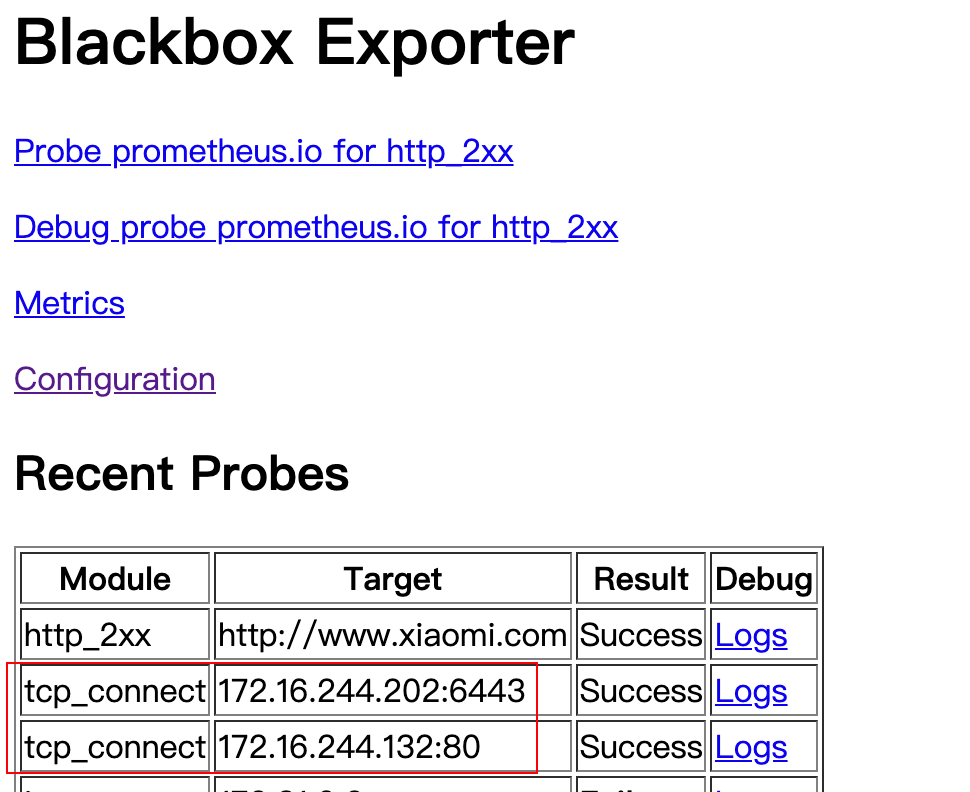
1.2.4.9 blackbox exporter realizes port monitoring
# vim /apps/prometheus/prometheus.yml
# Port monitoring
  - job_name: 'port_status'
    metrics_path: /probe
    params:
      module: [tcp_connect]
    static_configs:
      - targets: ['172.16.244.101:9100','172.16.244.132:80','172.16.244.202:6443']
        labels:
          instance: 'port_status'
          group: 'port'
    relabel_configs:
      - source_labels: [__address__]
        target_label: __param_target
      - source_labels: [__param_target]
        target_label: ip
      - target_label: __address__
        replacement: 172.16.244.111:9115
# /apps/prometheus/promtool check config /apps/prometheus/prometheus.yml
Checking /apps/prometheus/prometheus.yml
SUCCESS: 0 rule files found
# systemctl restart prometheus.service
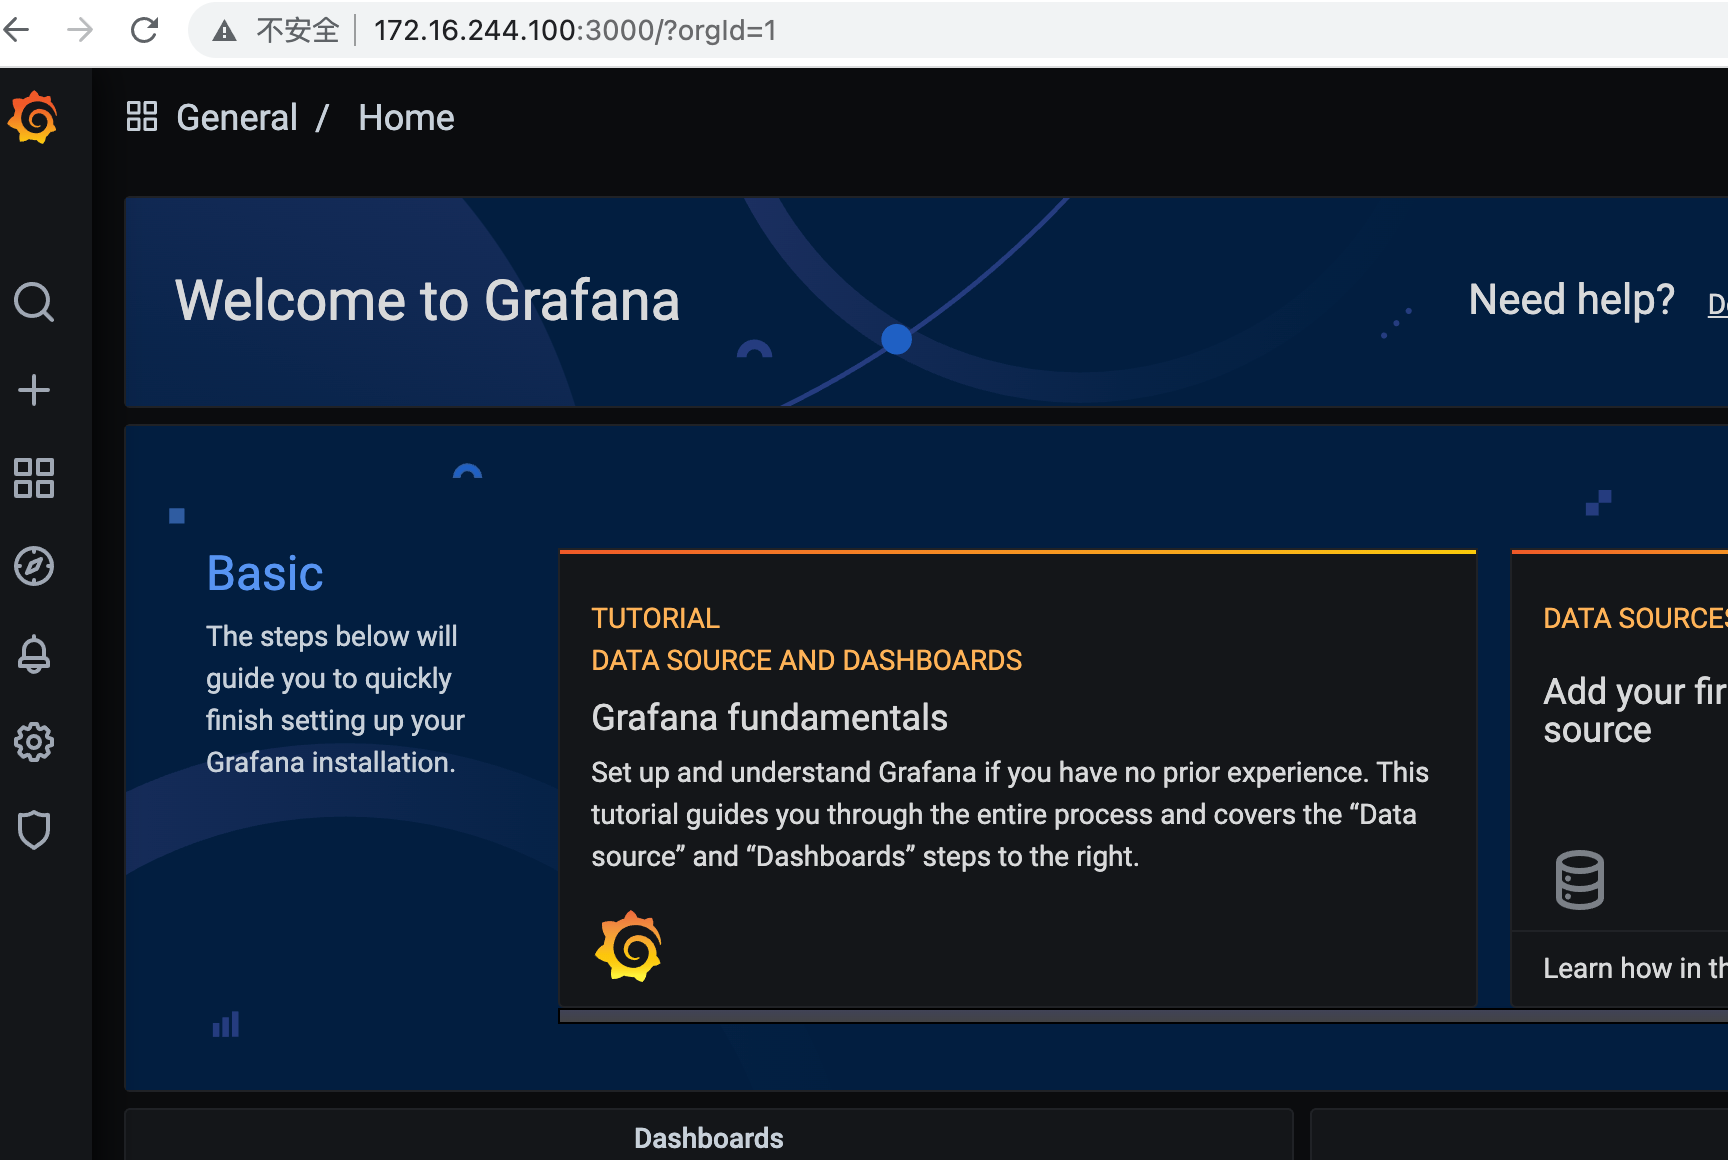
1.2.5 installation of Grafana
https://grafana.com/docs/
grafana is an open source visualization tool, which can call prometheus, mysql and other data sources for more gorgeous front-end visualization.
1.2.5.1 install and start grafana
# sudo apt-get install -y adduser libfontconfig1
# dpkg -i grafana-enterprise_7.5.11_amd64.deb

configuration file:
# vim /etc/grafana/grafana.ini
[server]
# Protocol (http, https, socket)
protocol = http
# The ip address to bind to, empty will bind to all interfaces http_addr = 0.0.0.0
# The http port to use
http_port = 3000

# systemctl restart grafana-server
# systemctl enable grafana-server
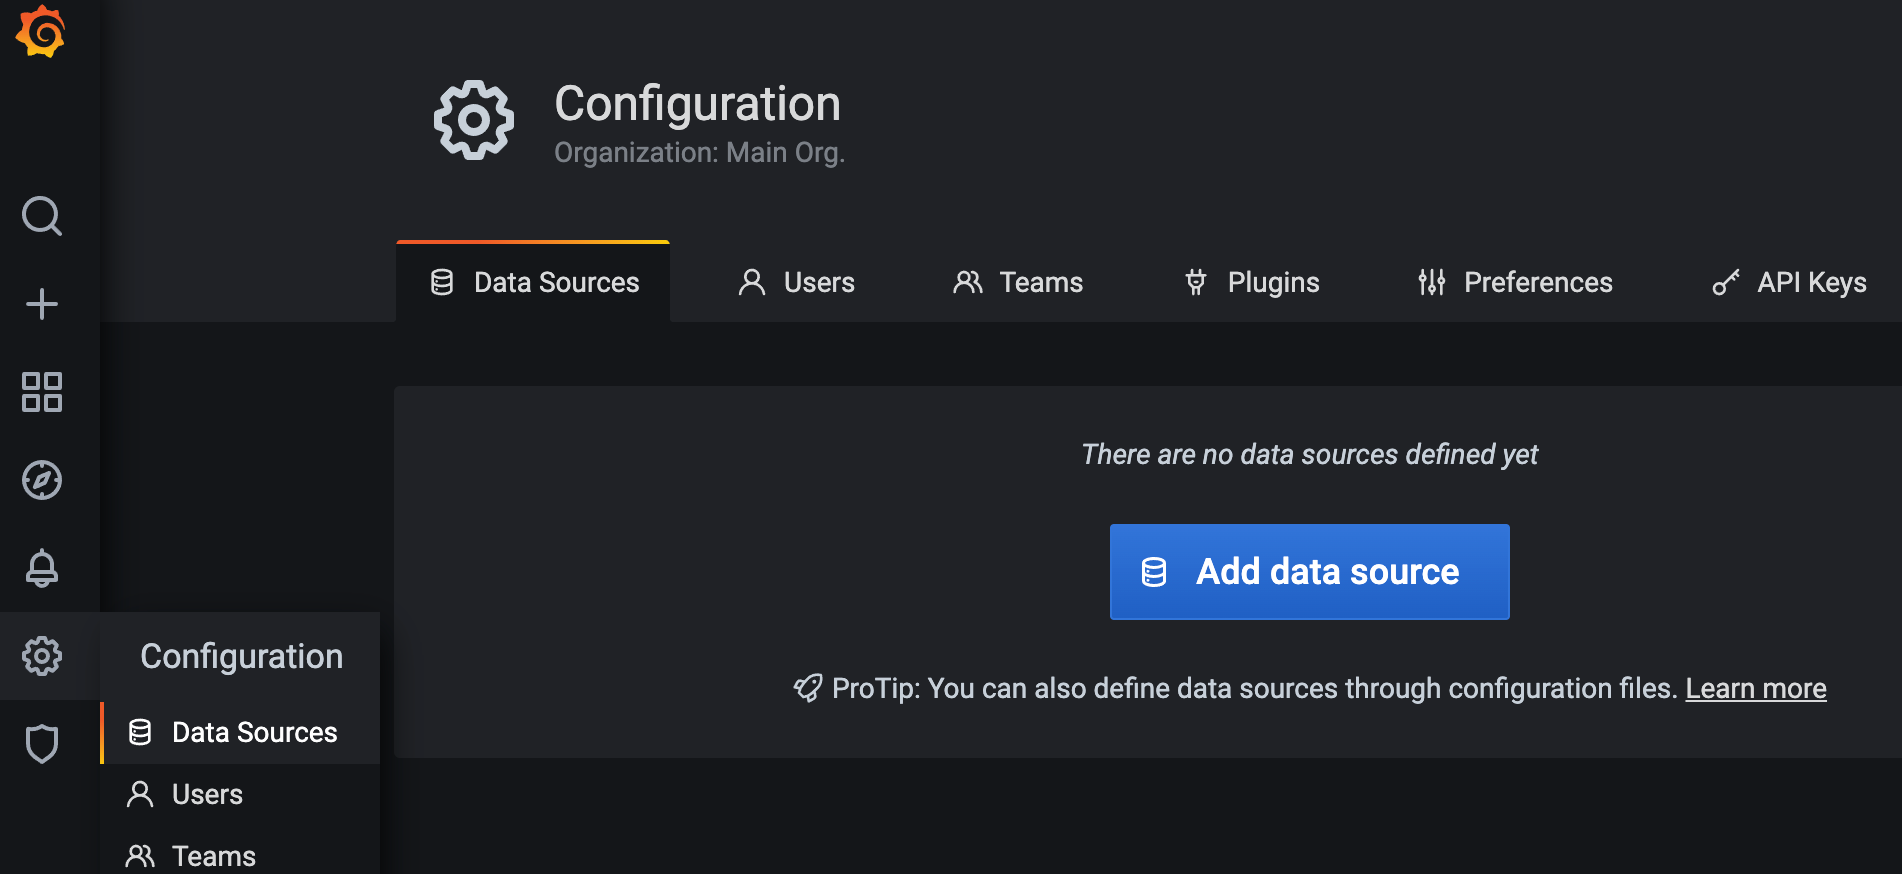
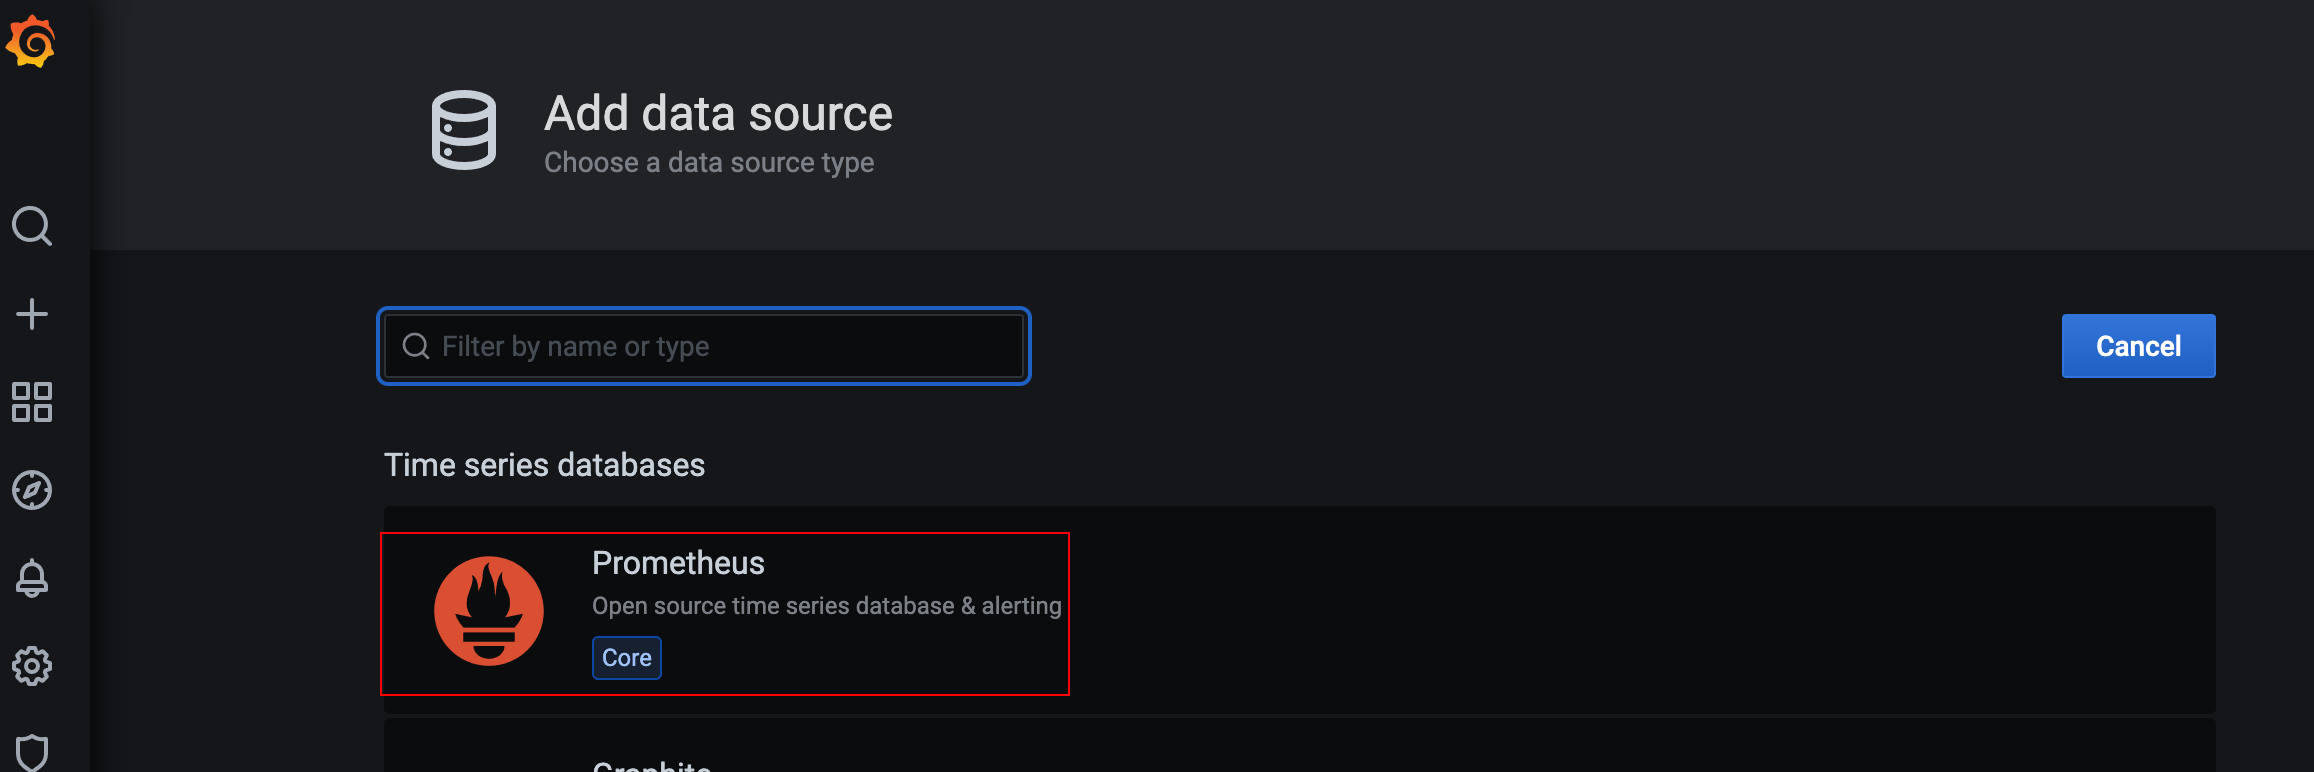
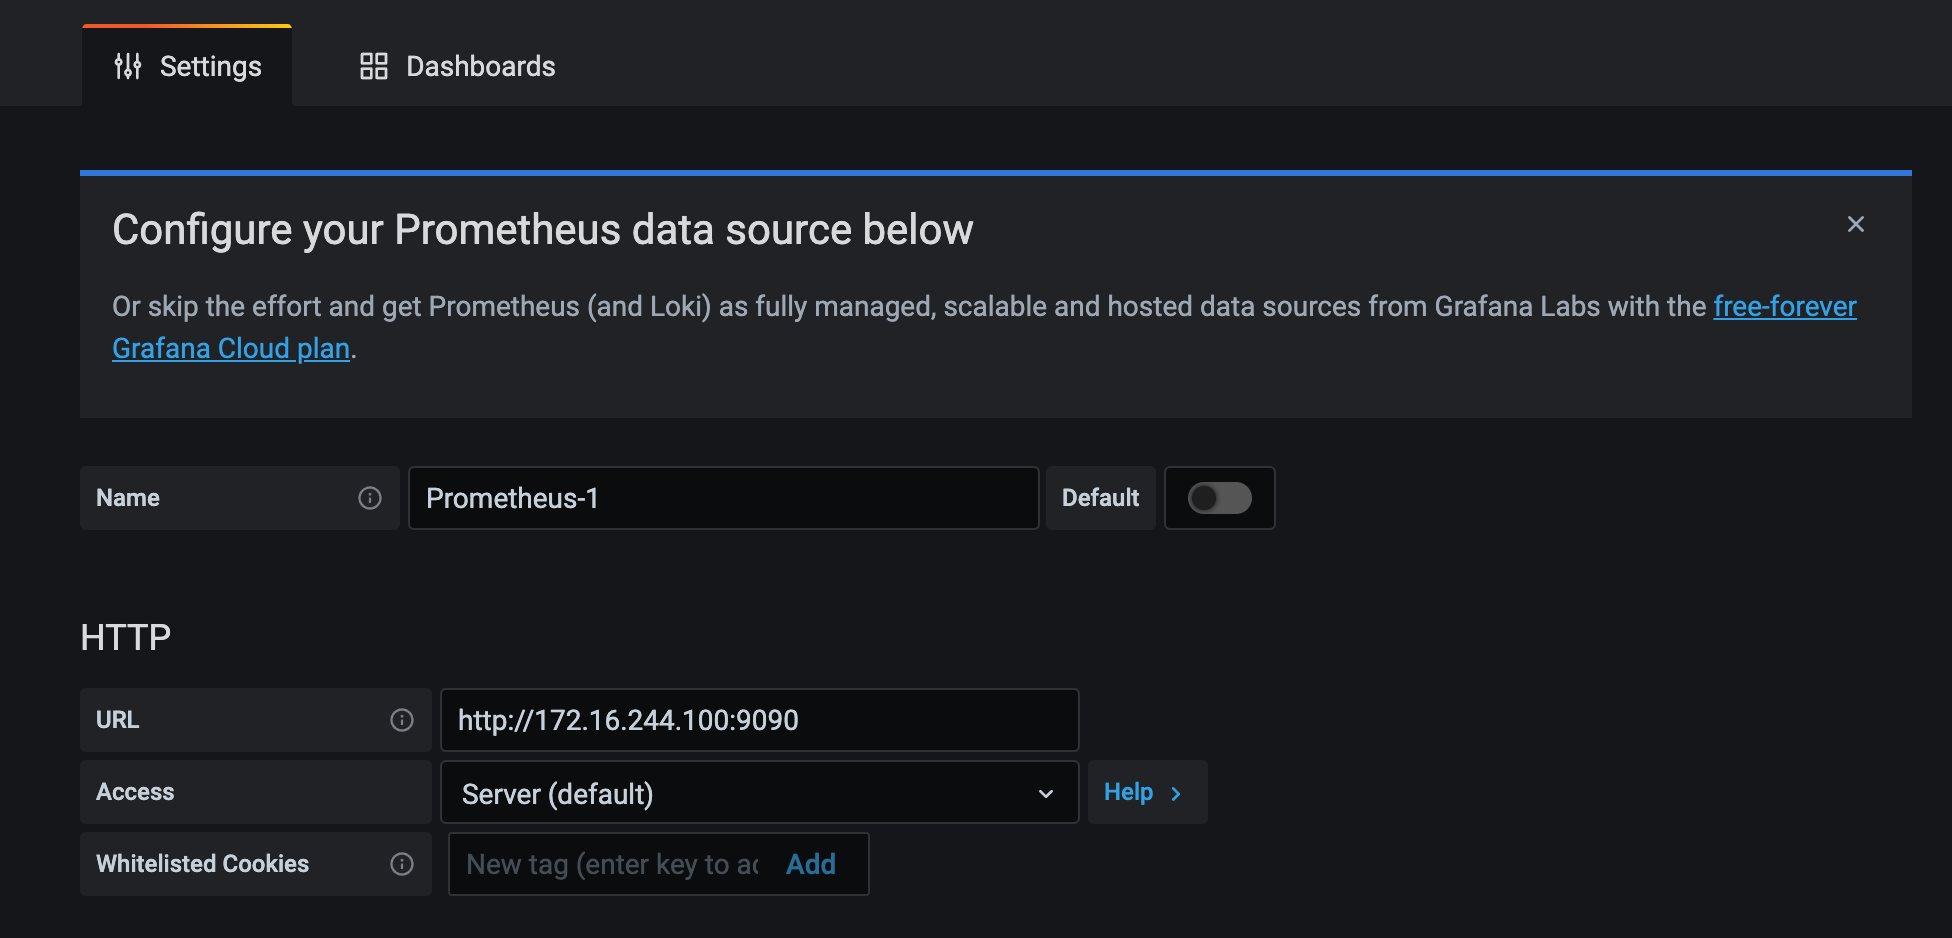
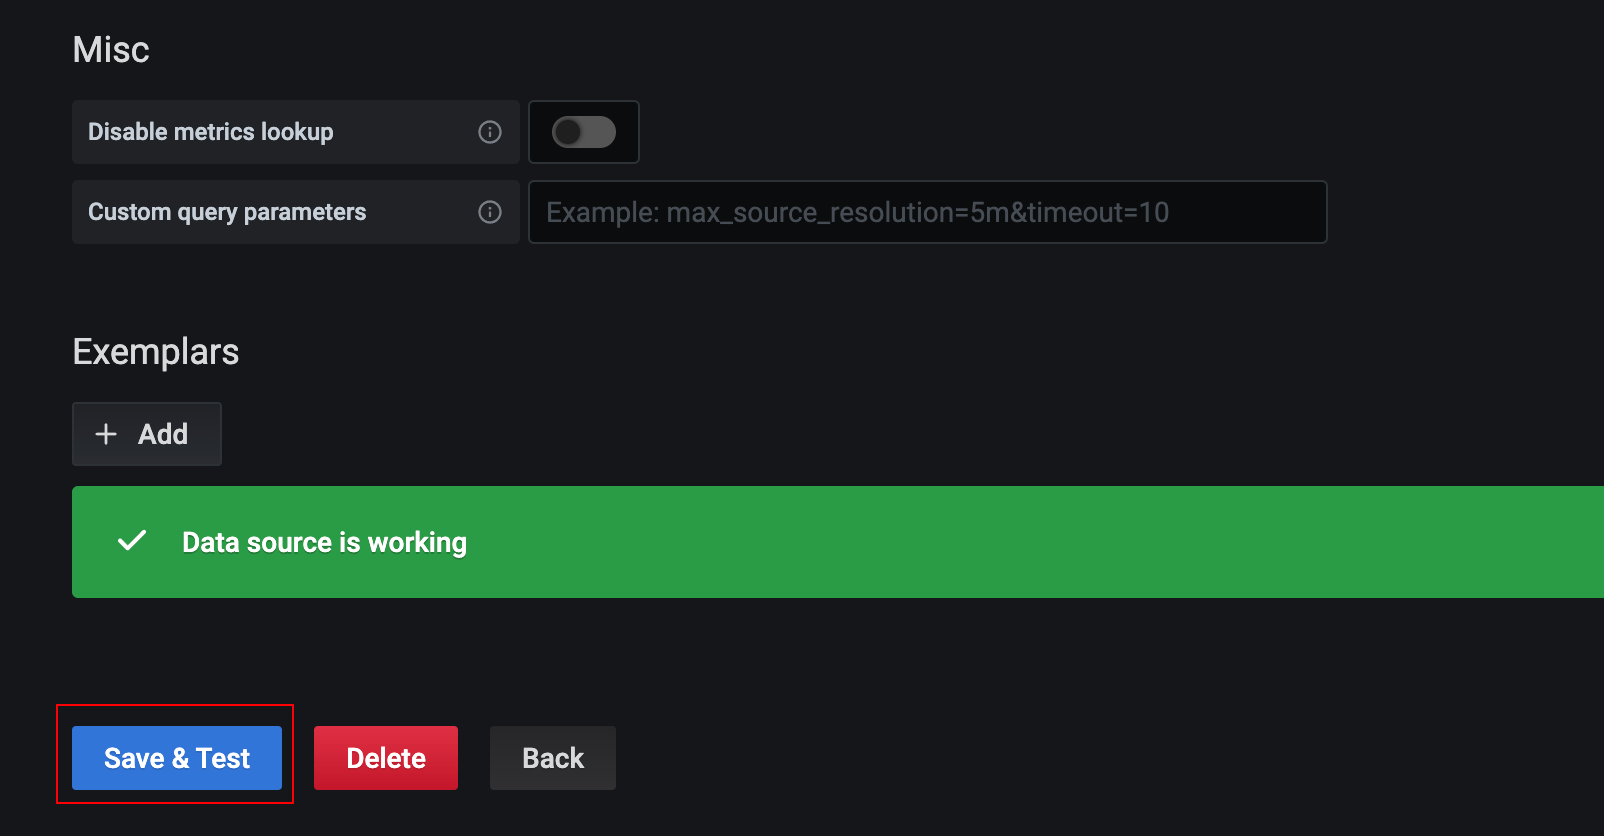
1.2.5.2 add data source
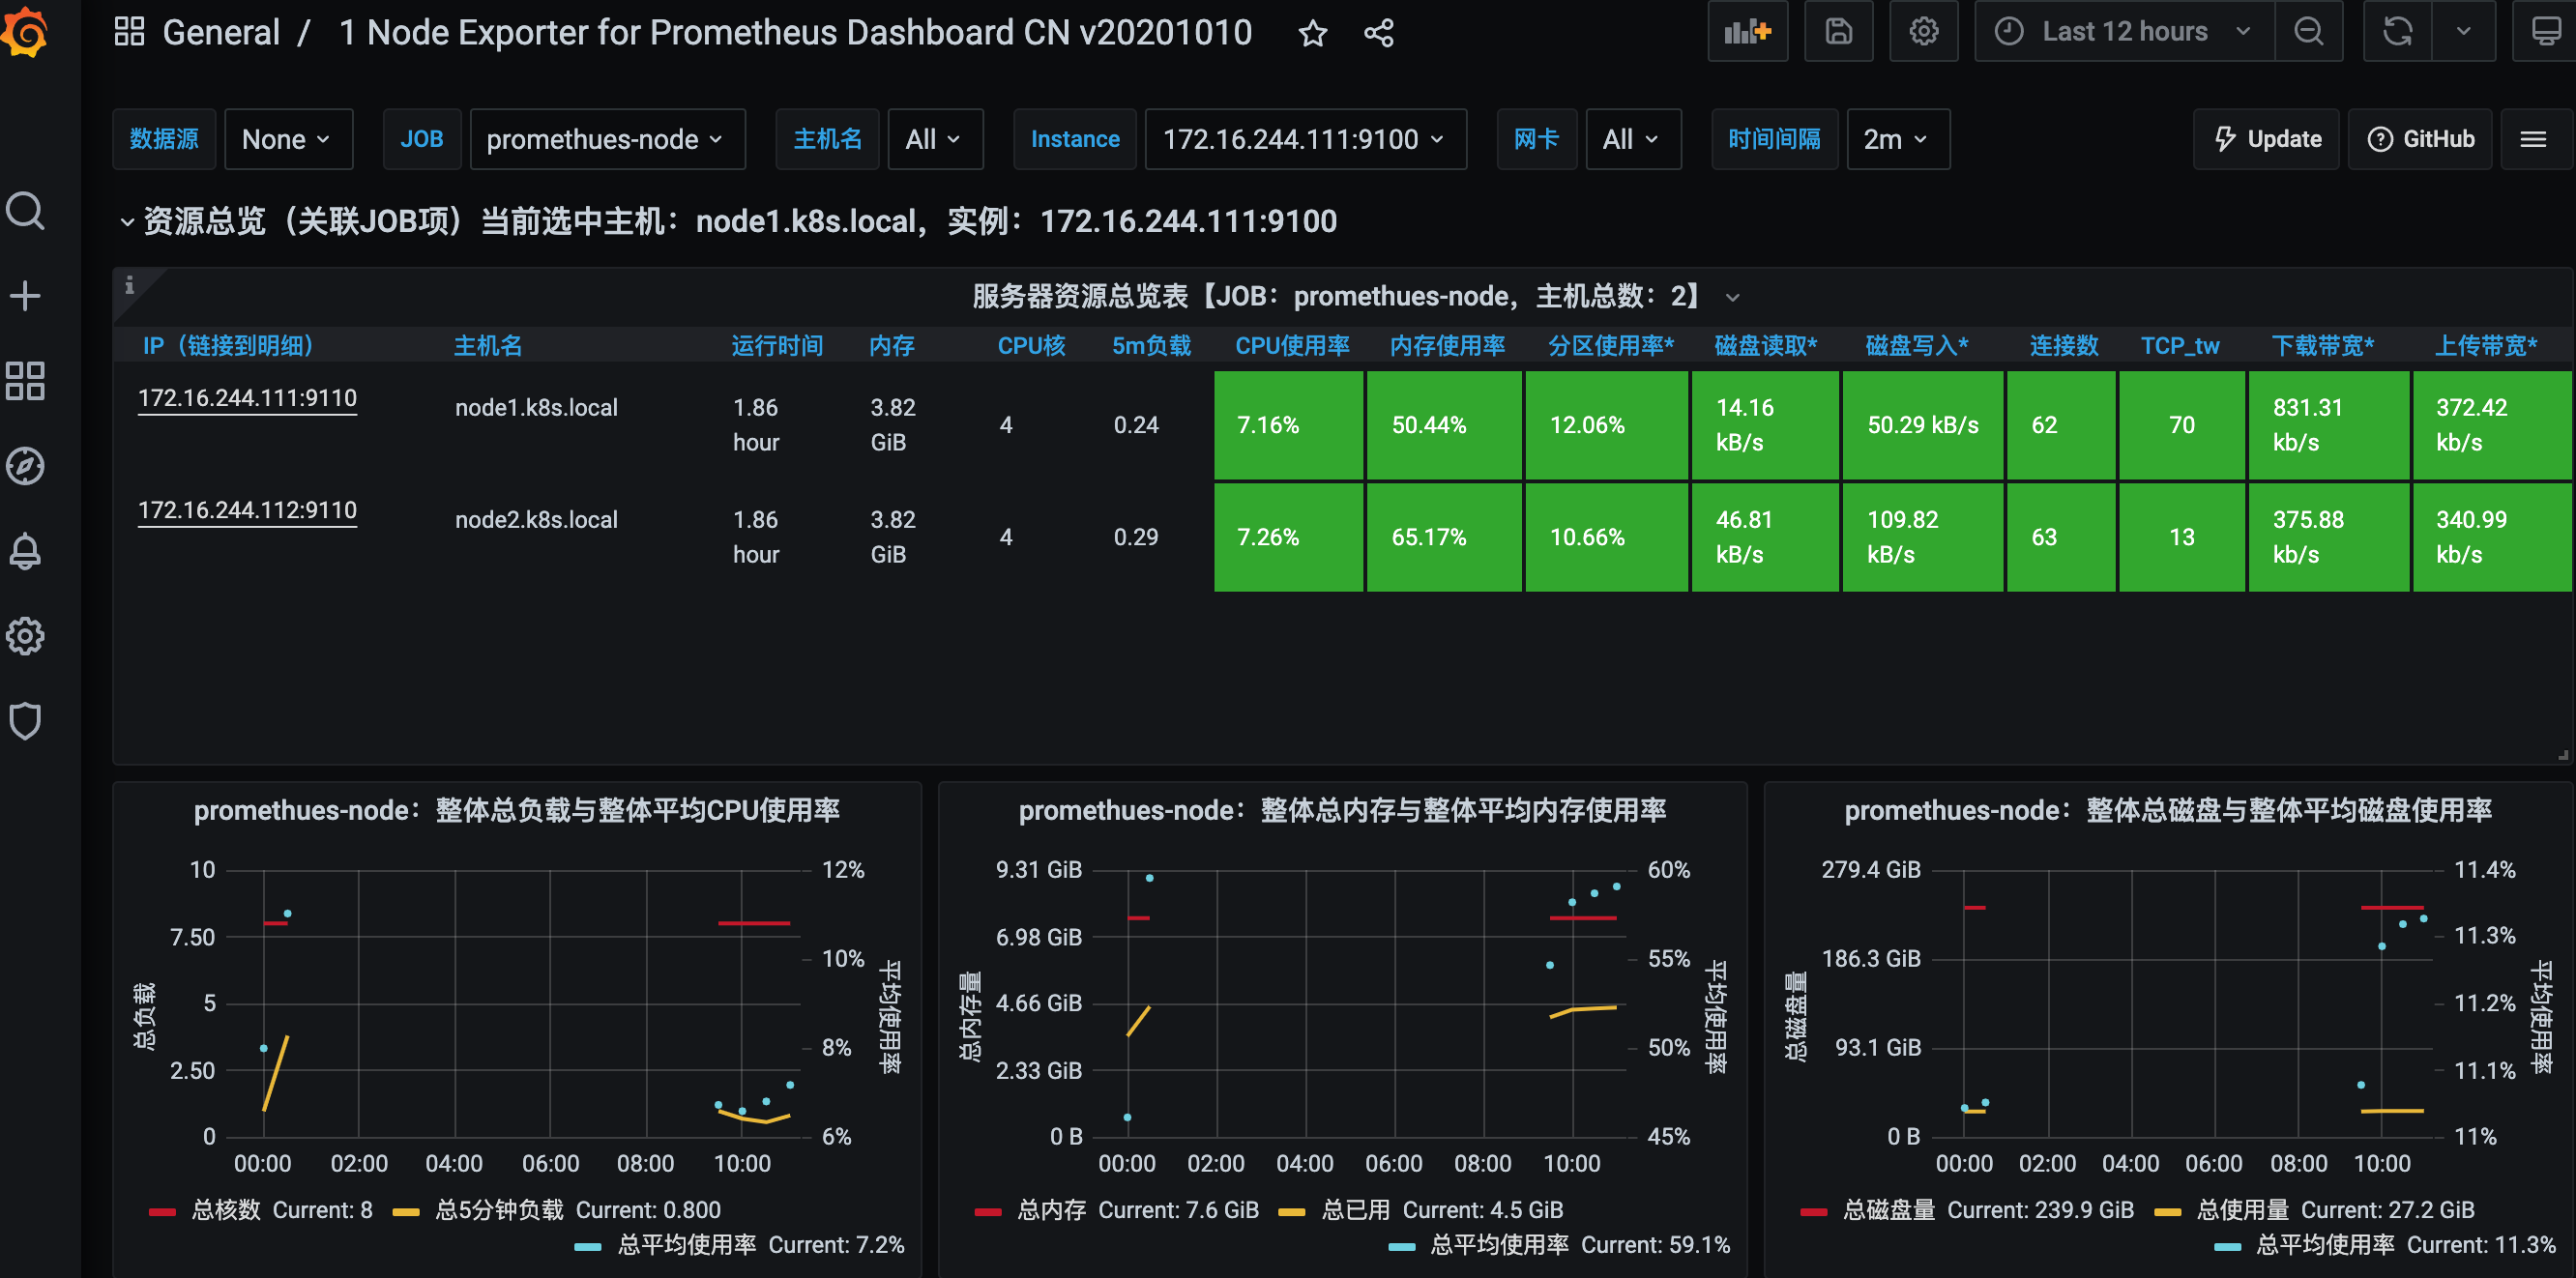
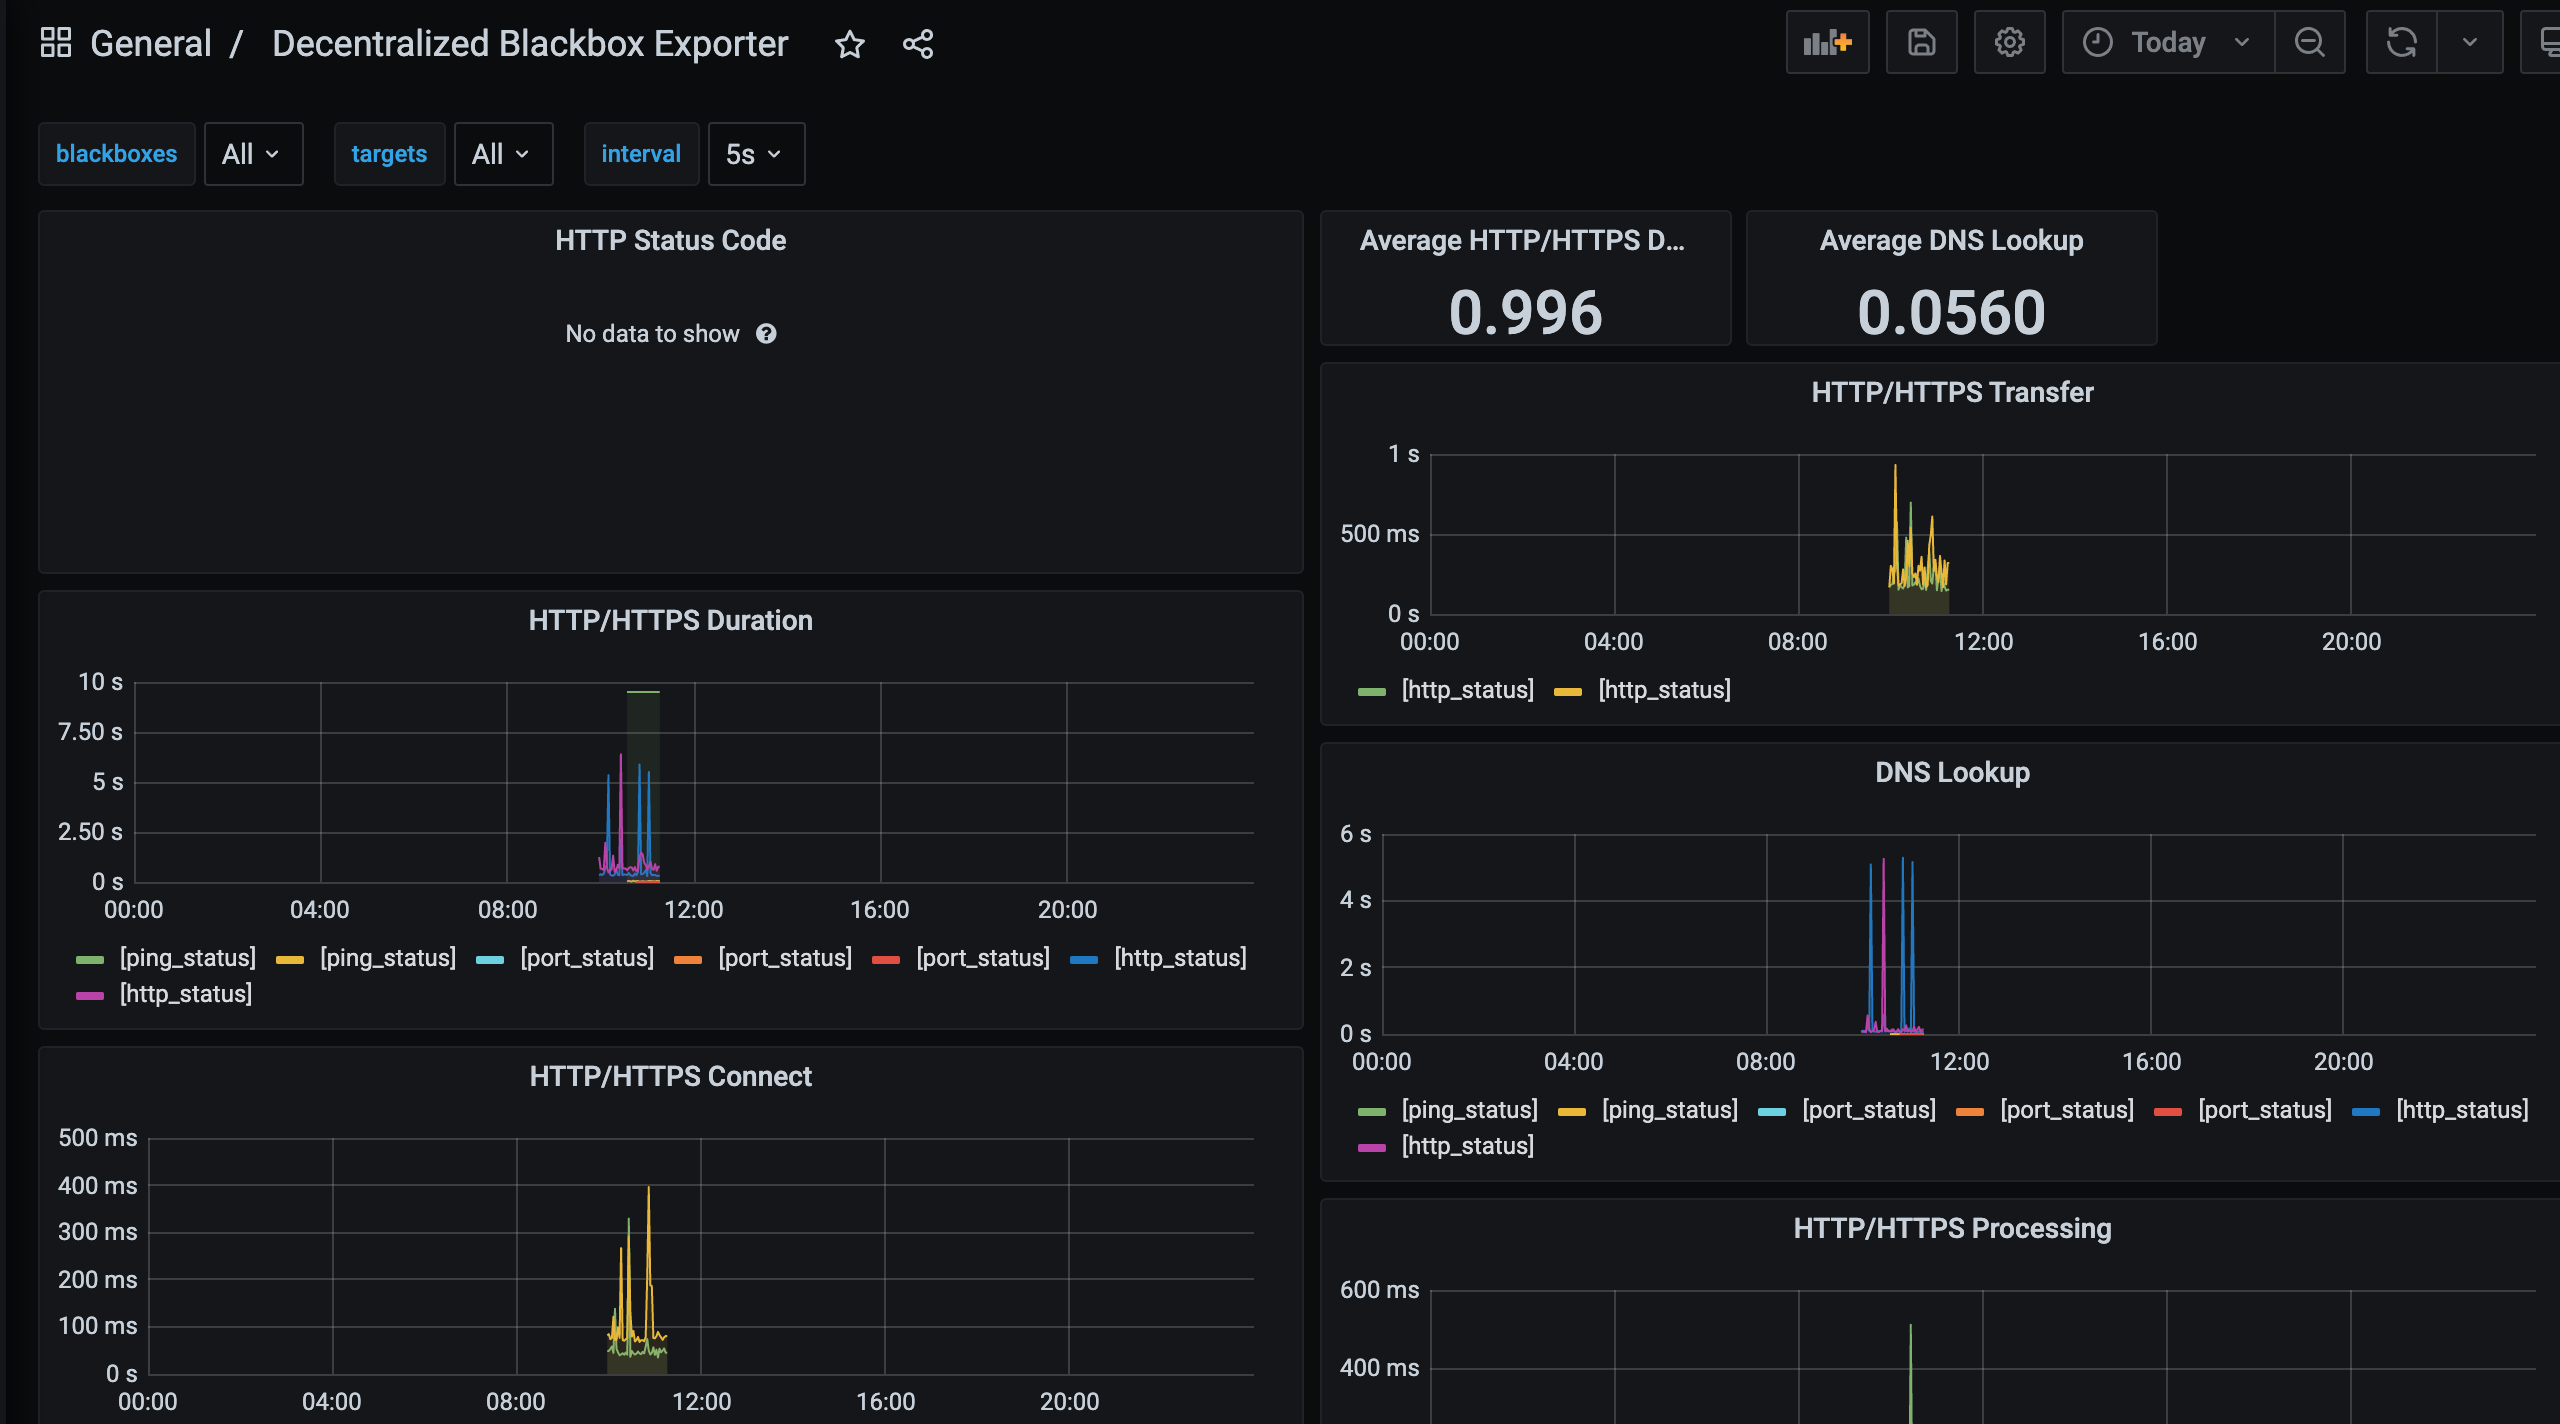
1.2.5.3 import template
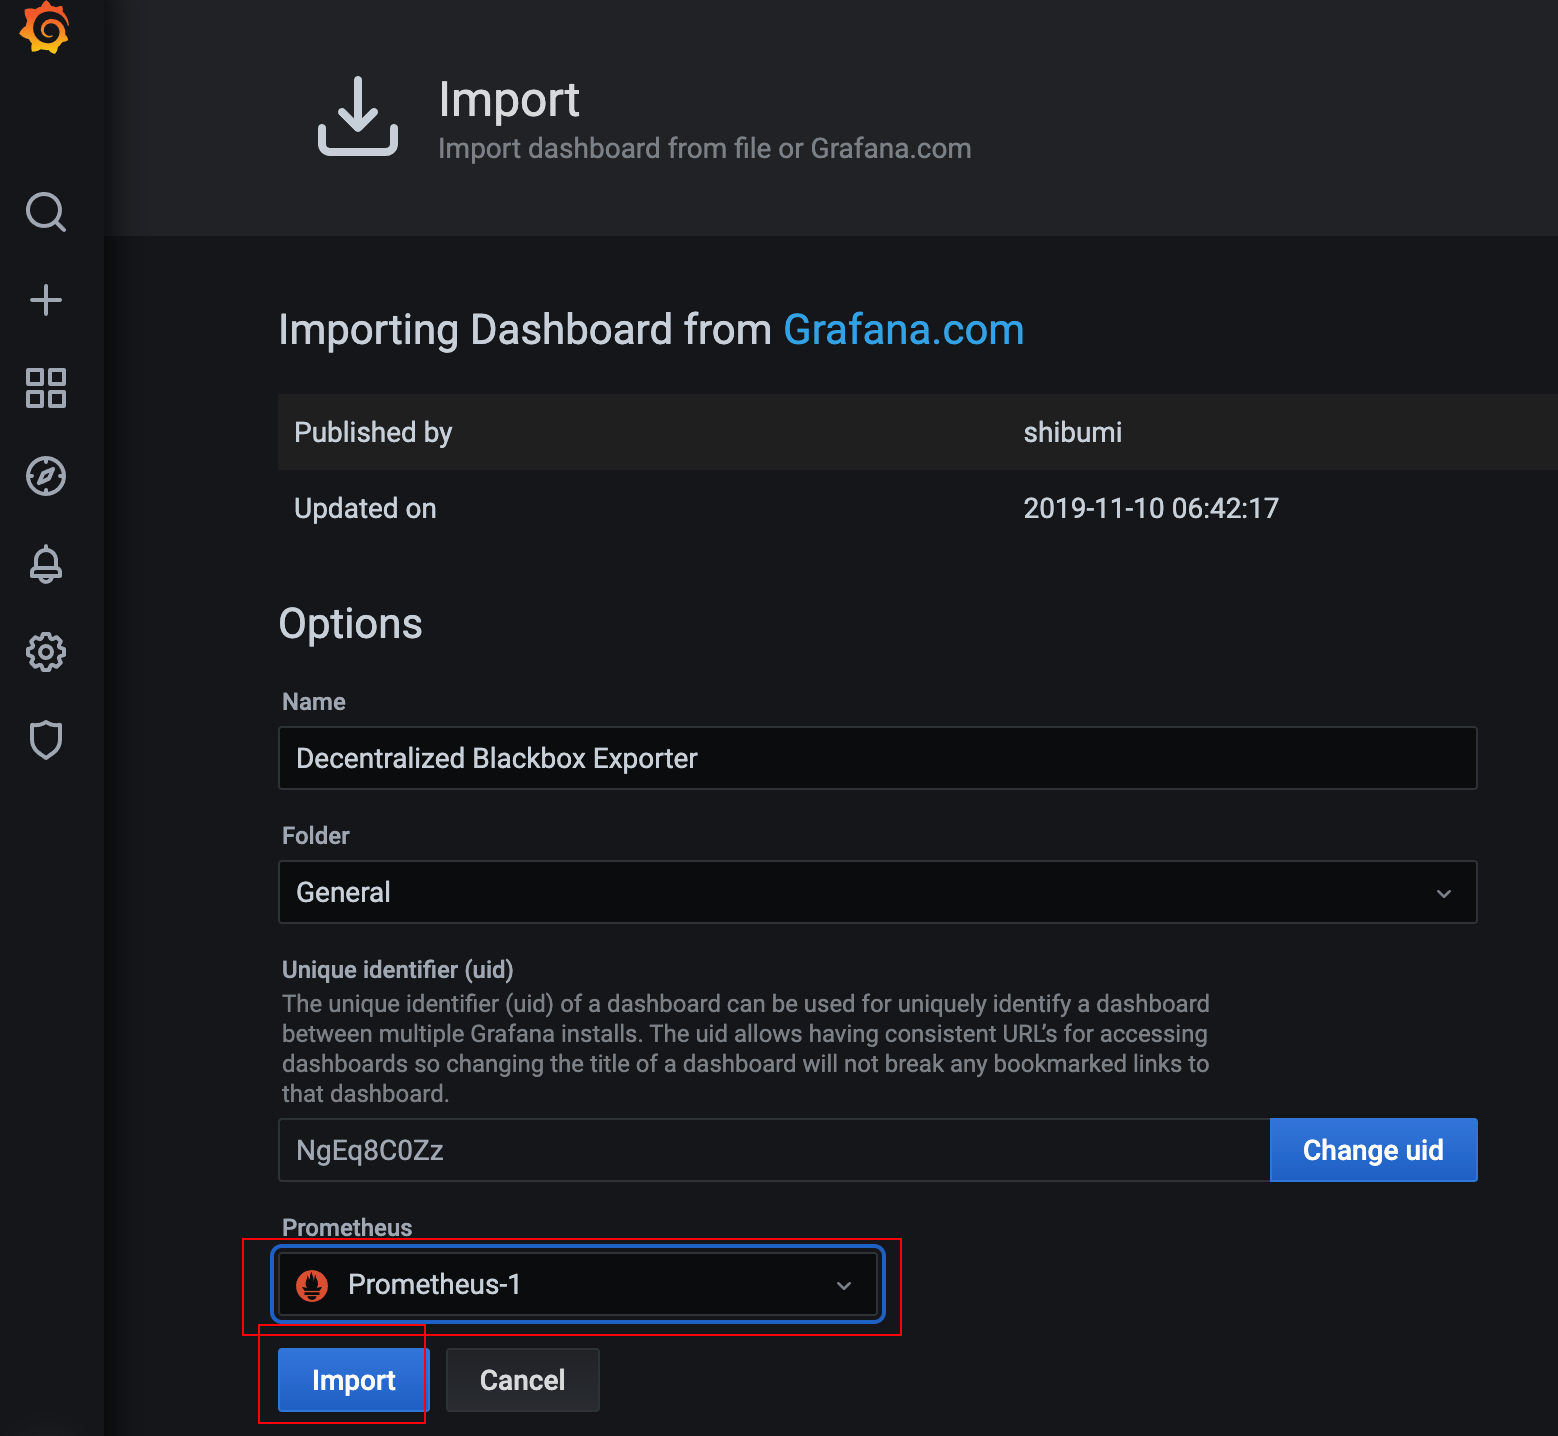
-
node exporter template (ID: 8919)
-
blackbox exporter template (ID: 9719)
2. PromQL statement
Prometheus provides a functional expression language PromQL (Prometheus Query Language), which enables users to find and aggregate time series data in real time. The expression calculation results can be displayed in charts, tables in Prometheus expression browser, or provided to external systems as a data source in the form of HTTP API.
node_memory_MemTotal_bytes # query the total memory size of node
node_memory_MemFree_bytes # query the remaining available memory of node node
node_memory_MemTotal_bytes{instance = "172.31.7.111:9100"} # query the total memory of the specified node
node_memory_MemFree_bytes{instance = "172.31.7.111:9100"} # query the available memory of the specified node
node_disk_io_time_seconds_total{device = "sda"} # queries the disk IO per second of the specified disk
node_filesystem_free_bytes{device="/dev/sda1",fstype = "xfs", mountpoint = "/"} # view the remaining disk space of the specified disk
node_load1 0.1 #CPU 1min load
2.1 data type
- Instantaneous vector: it is a group of time series. Each time series contains a single data sample, such as node_memory_MemTotal_bytes query the current remaining memory is an instantaneous vector. The return value of this expression will only contain the latest sample value in the time series, and the corresponding expression is called an instantaneous vector expression.
- Range vector: refers to all metric data captured in any time range, such as the network card traffic trend chart of the last day.
- Scalar: it is a data value of floating-point number type, using node_load1 gets an instantaneous vector, but you can use the built-in function scalar() to convert the instantaneous vector to a scalar.
- String: data of string type, which is rarely used at present
2.2 matcher
- =: select exactly the same label as the supplied string.
- != : Select a label that is different from the supplied string.
- =~: select the label whose regular expression matches the supplied string (or substring).
- !~ : Select a label whose regular expression does not match the supplied string (or substring).
#Query format {=,...}
node_load1{instance="172.16.244.100:9100"}
node_load1{job="promethues-node"}
node_load1{job="promethues-node",instance="172.16.244.100:9100"}
node_load1{job="promethues-node",instance!="172.16.244.100:9100"}
2.3 time range
s-second
m - minutes
h - hours
d-Day
w-week
y-year
node_memory_MemTotal_bytes {} # instantaneous vector expression, select the current latest data
node_memory_MemTotal_bytes{}[5m]# interval vector expression, select the data within 5 minutes based on the current time
node_memory_MemTotal_bytes{instance="172.31.7.111:9100"}[5m]
2.4 operators
+Addition
-Subtraction
*Multiplication
/Division
%Mold
^Idempotent
node_memory_MemFree_bytes/1024/1024 # convert memory to units
node_disk_read_bytes_total{device=“sda”} + node_disk_written_bytes_total{device = "SDA"} # calculates the amount of data read and written to the disk per second
2.5 aggregation operation
sum
Min (min)
Max (max)
avg (average)
stddev (standard deviation)
stdvar (standard deviation)
count
count_values (count value s)
Bottom K (k elements with the smallest sample value)
topk (k elements with the largest sample value)
quantile (distribution statistics)
max(node_memory_MemFree_bytes) # the maximum value of an indicator data
sum(http_requests_total) # calculate http_ requests_ Total total recent requests
3. Monitoring of Pod
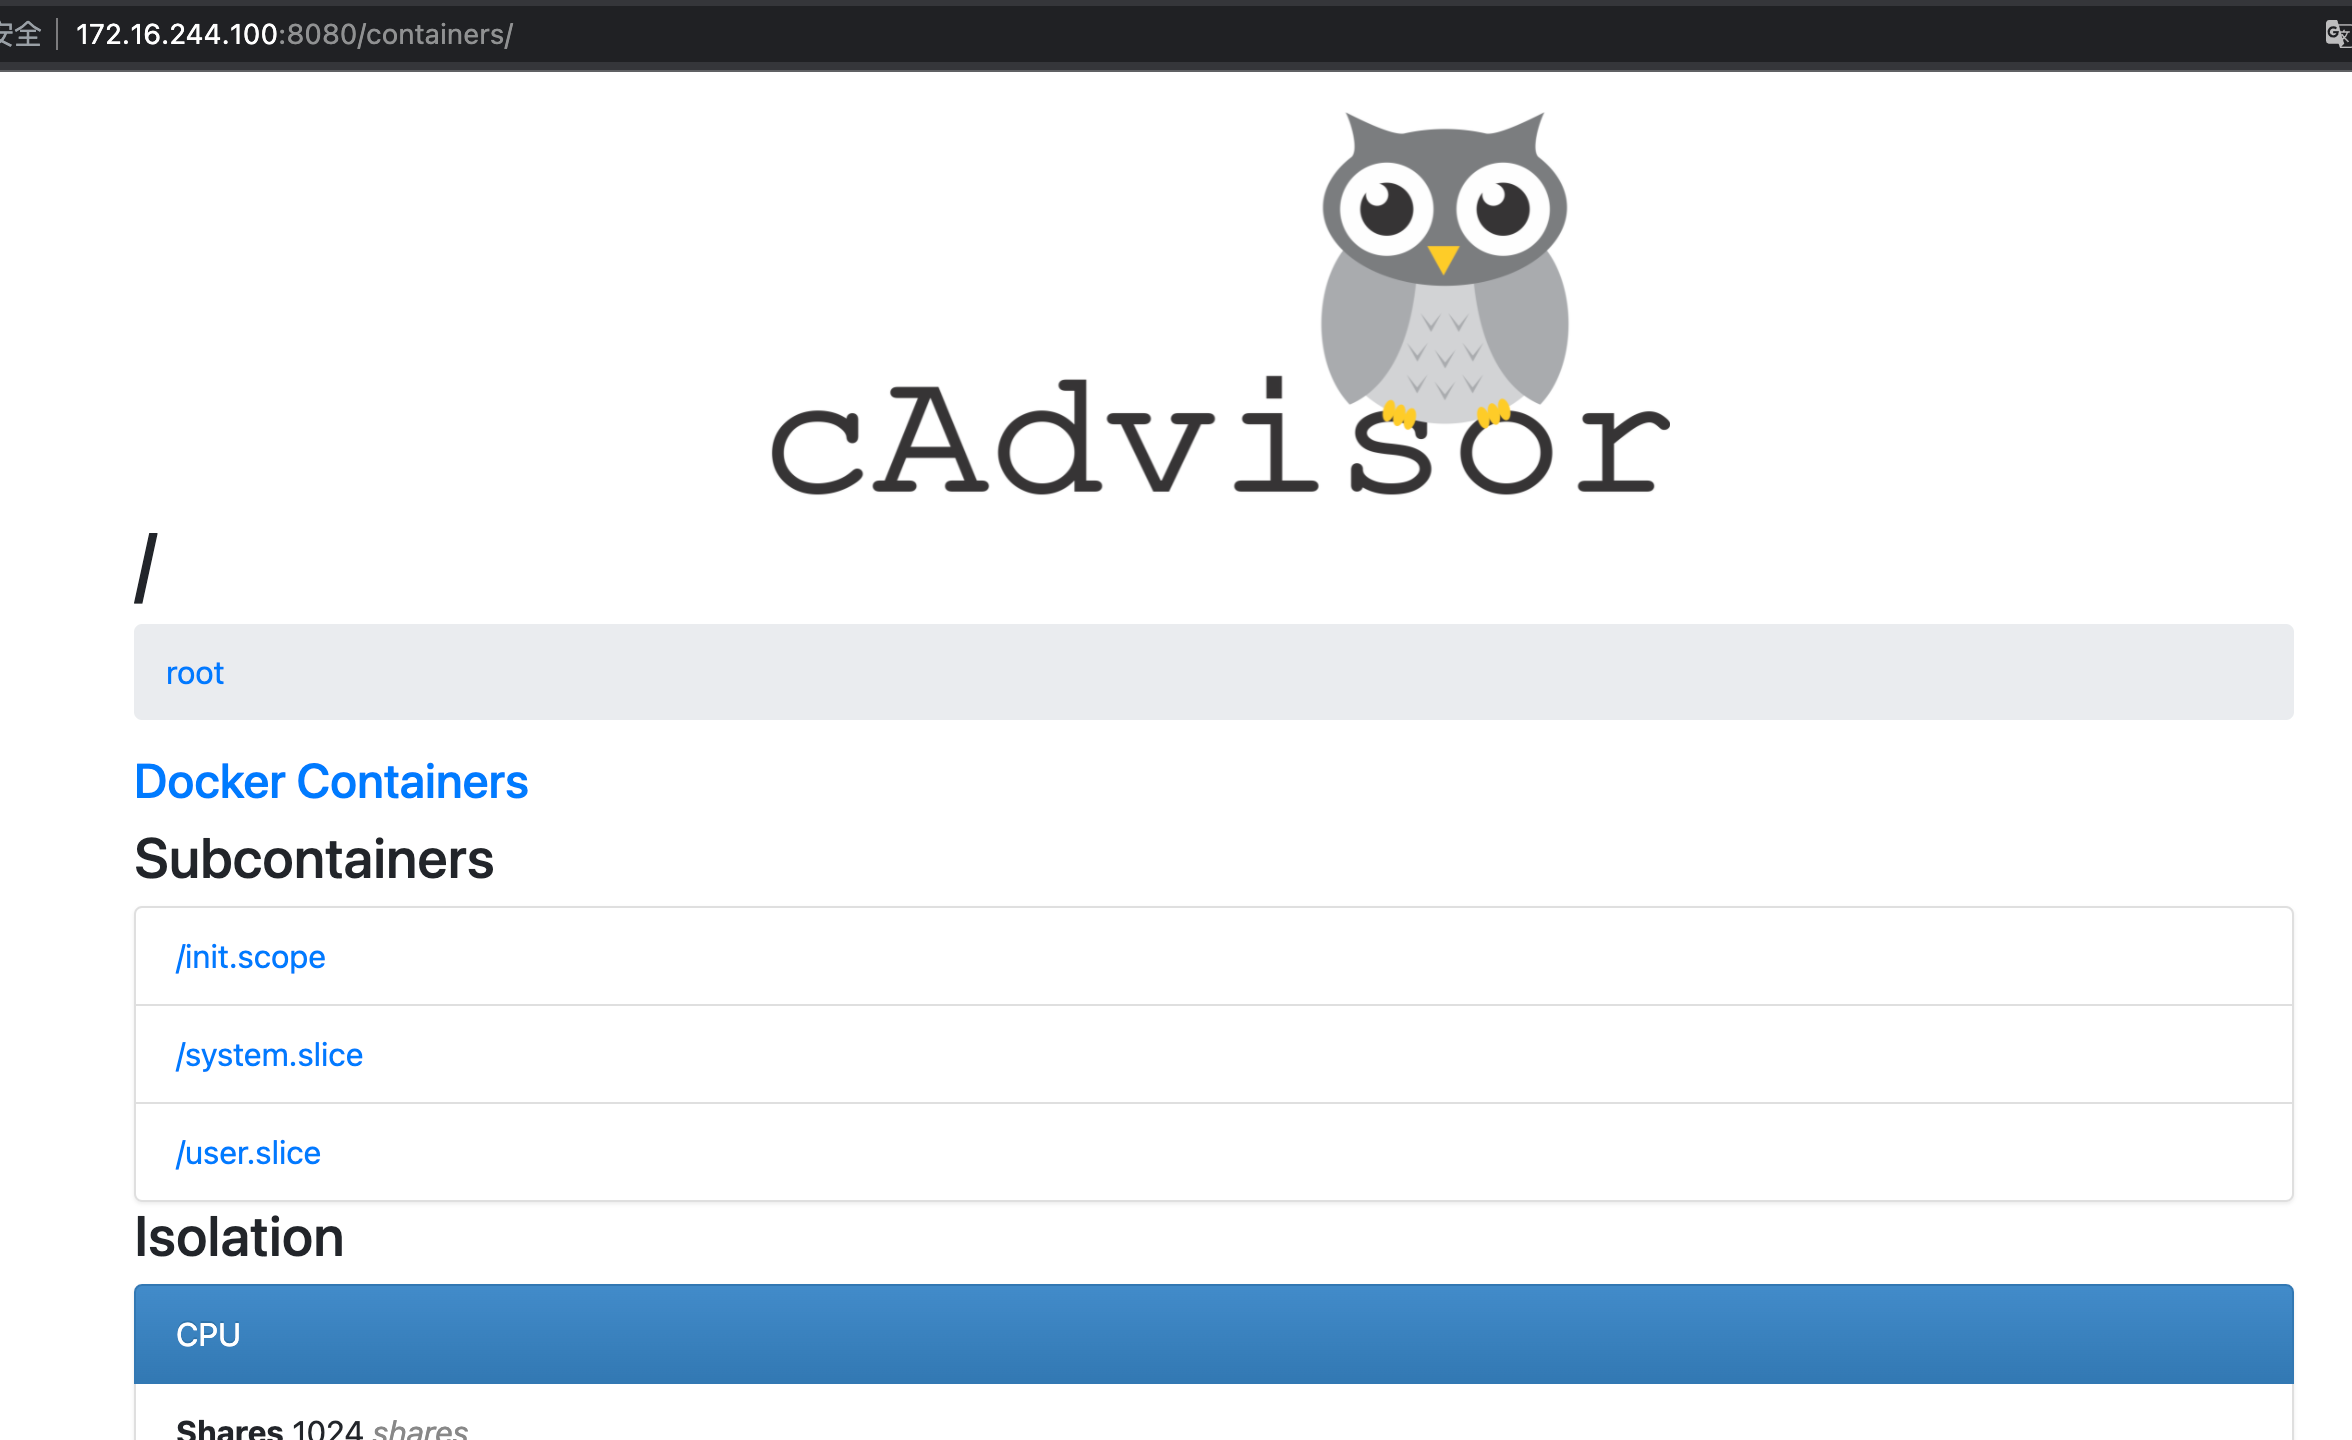
Cadvisor is open source by Google. Cadvisor can not only collect all container information running on a machine, but also provide basic query interface and http interface to facilitate data capture by other components such as Prometheus. Cadvisor can conduct real-time monitoring and performance data collection of resources and containers on node machines, including CPU usage, memory usage Network throughput and file system usage.
K8s before 1.12, the cadvisor was integrated into the kubelet service on the node node. Since 1.12, it has been separated into two components. Therefore, it is necessary to deploy the cadvisor separately on the node node
https://github.com/google/cadvisor
3.1 cdadvisor image preparation
# docker load -i cadvisor-v0.39.2.tar.gz
# docker tag gcr.io/cadvisor/cadvisor:v0.39.2 harbor.k8s.local/k8s/cadvisor:v0.39.2
# docker push harbor.k8s.local/k8s/cadvisor:v0.39.2
3.2 starting the cadadvisor container
docker run -it -d \
--restart=always \
--volume=/:/rootfs:ro \
--volume=/var/run:/var/run:ro \
--volume=/sys:/sys:ro \
--volume=/var/lib/docker/:/var/lib/docker:ro \
--volume=/dev/disk/:/dev/disk:ro \
--publish=8080:8080 \
--detach=true \
--name=cadvisor \
--privileged \
--device=/dev/kmsg \
harbor.k8s.local/k8s/cadvisor:v0.39.2
- kustomize deployment of kubernetes
Official documents: https://github.com/google/cadvisor/tree/master/deploy/kubernetes
3.3 verification page
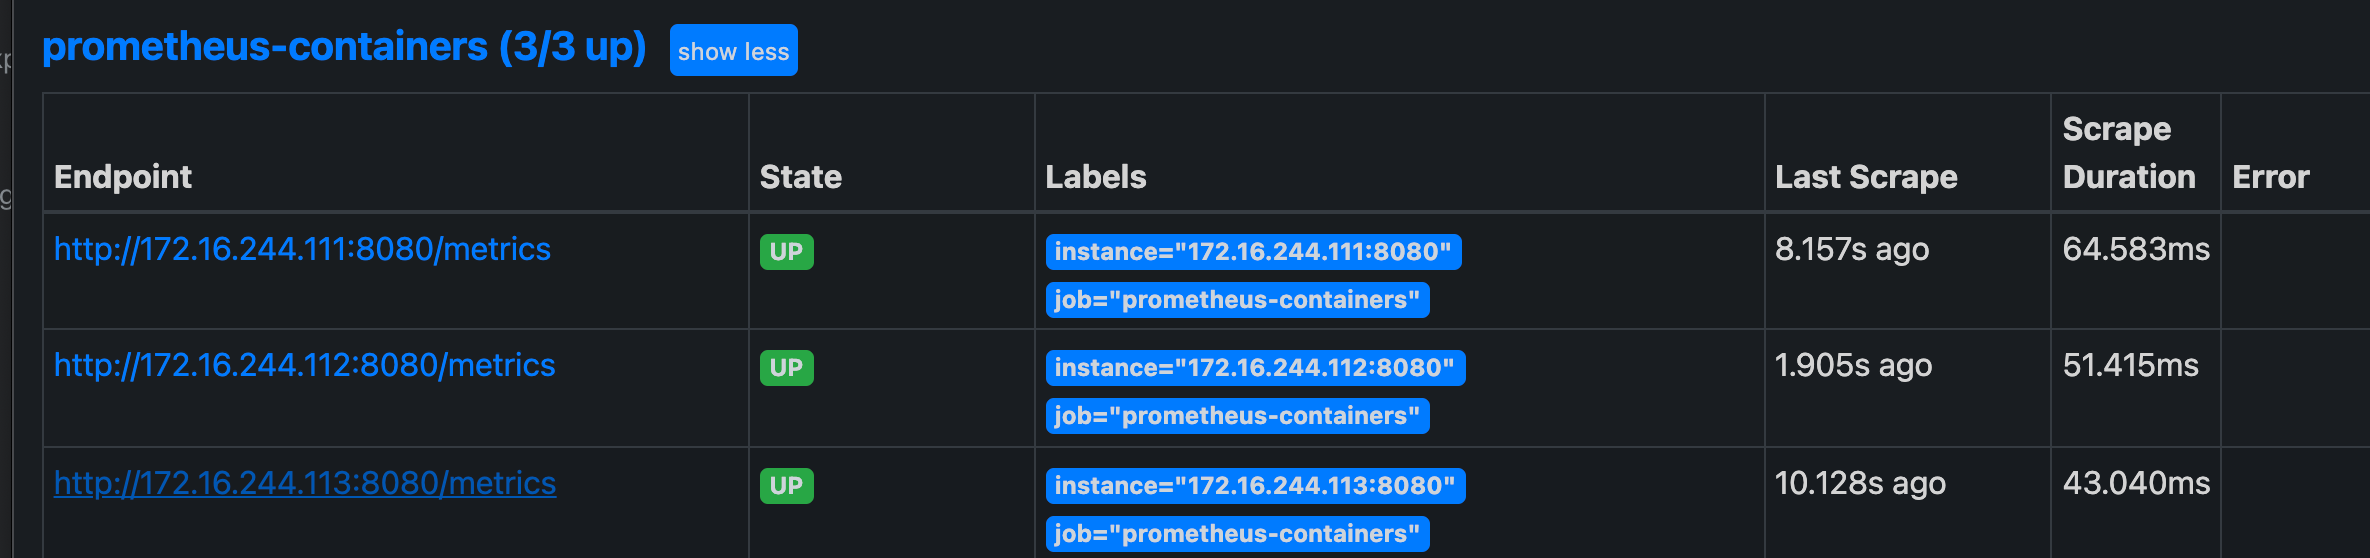
3.4 Prometheus collects cdadvisor data
# vim /apps/prometheus/prometheus.yml
  - job_name: 'prometheus-containers'
    static_configs:
      - targets: ["172.16.244.111:8080","172.16.244.112:8080","172.16.244.113:8080"]
3.5 add Grafana template
Container template ID: 395 893
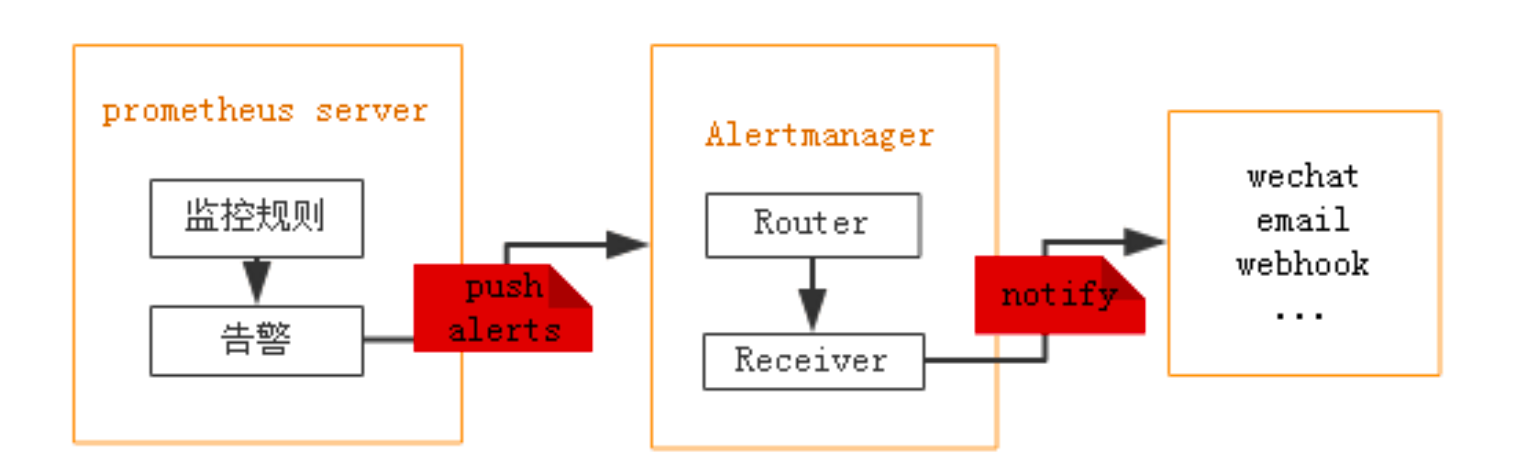
4. Prometheus alarm
prometheus - > trigger threshold - > exceeding duration - > alertmanager - > grouping | suppression | silence - > media type - > mail | nailing | wechat, etc.
- Group: combine alerts of similar nature into a single notification, such as network notification, host notification and service notification.
- Silence: it is a simple silence mechanism for a specific time. For example, to upgrade and maintain the server, you can first set the alarm silence for this time period.
- Inhibition: when the alarm is sent, stop sending other alarms caused by the alarm repeatedly, that is, combine multiple alarm events caused by a fault to eliminate redundant alarms
4.1 download alarm component alertmanager
# tar xf alertmanager-0.23.0.linux-amd64.tar.gz -C /apps
# ln -sv /apps/alertmanager-0.23.0.linux-amd64 /apps/alertmanager
# vim /etc/systemd/system/alertmanager.service
[Unit]
Description=Prometheus Server Documentation=https://prometheus.io/docs/introduction/overview/
After=network.target
[Service]
Restart=on-failure
WorkingDirectory=/apps/alertmanager
ExecStart=/apps/alertmanager/alertmanager
[Install]
WantedBy=multi-user.target
4.2 configuring alertmanager
Official configuration document: https://prometheus.io/docs/alerting/configuration/
global:
  smtp_from: #Sender email address
  smtp_smarthost: #Mailbox smtp address.
  smtp_auth_username: #The login user name of the sender is consistent with the sender's address by default.
  smtp_auth_password: #The sender's login password, sometimes the authorization code.
  smtp_require_tls: #Whether tls protocol is required. The default is true.
  wechat_api_url: #Enterprise wechat API address.
  wechat_api_secret: #Enterprise wechat API secret
  wechat_api_corp_id: #Enterprise wechat corp id information.
  resolve_timeout: #Send a recovery notification if no new event occurs within the specified time
4.2.1 configuration example
# pwd
/apps/alertmanager
# cat alertmanager.yml
global:
  resolve_timeout: 5m #Send a recovery notification if no new event occurs within the specified time
  smtp_smarthost: 'smtp.126.com:465'
  smtp_from: 'xiaoyizi@126.com'
  smtp_auth_username: 'xiaoyizi@126.com'
  smtp_auth_password: 'TJNTDNDFLAKXOFM'
  smtp_hello: '@126.com'
  smtp_require_tls: false
route: #route is used to set the alarm distribution policy
  group_by: ['alertname'] #Which label is used as the basis for grouping
  group_wait: 10s #Group alarm waiting time. That is, wait for 10s after the alarm is generated. If there are alarms in the same group, they will be sent together
  group_interval: 2s #Interval between two groups of alarms
  repeat_interval: 2m #Repeat the alarm interval to reduce the sending frequency of the same mail
  receiver: 'web.hook' #Set recipient
receivers:
- name: 'web.hook'
  #webhook_configs:
  #- url: 'http://127.0.0.1:5001/'
  email_configs:
    - to: 'xiaoyizi@126.com'
inhibit_rules: #Suppressed rules
  - source_match: #The source matching level. When the matching is successful, the notification will be sent, but other notifications will be suppressed
      severity: 'critical'
    target_match:
      severity: 'warning'
    equal: ['alertname', 'dev', 'instance']
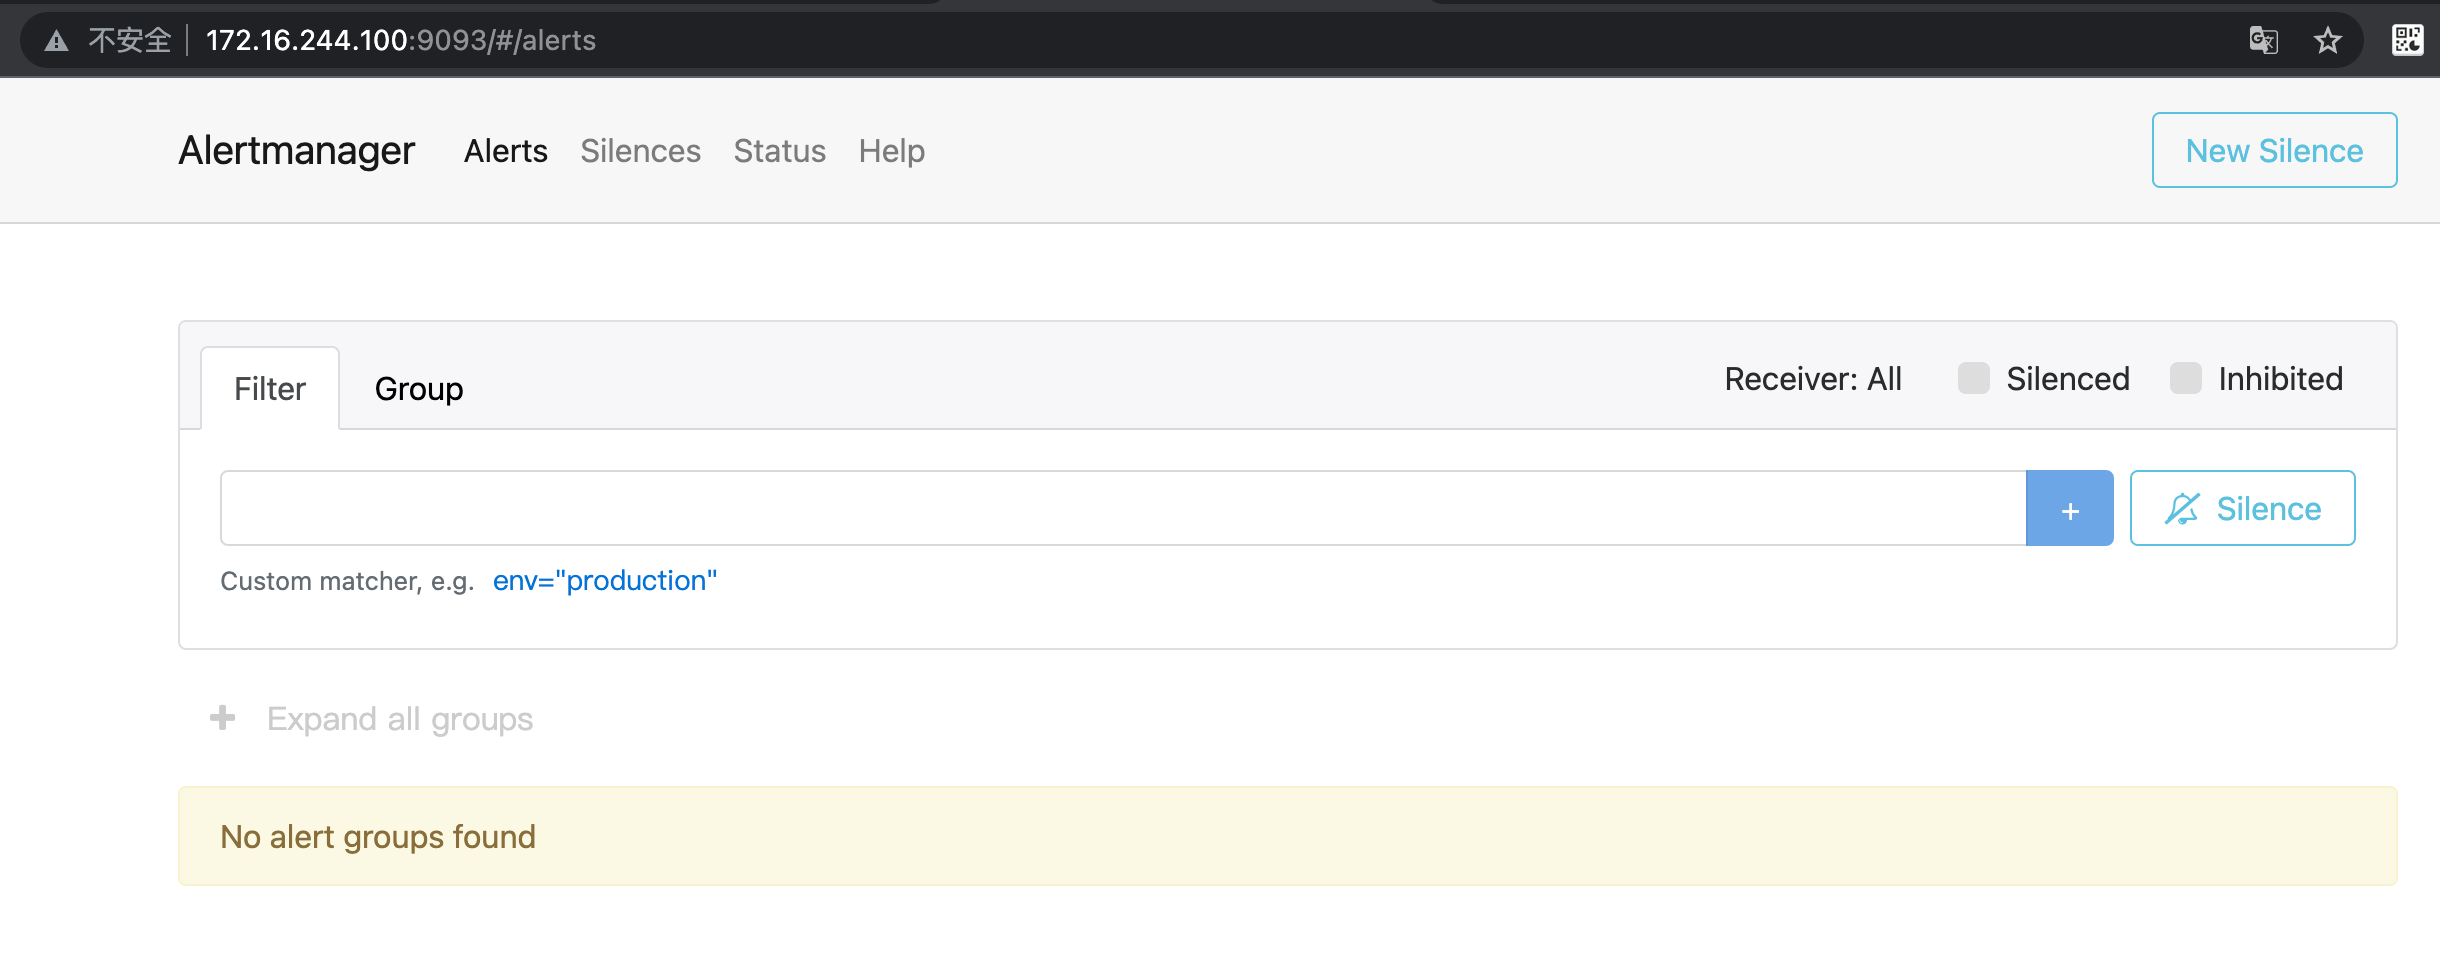
4.3 start up and verification
# systemctl daemon-reload && systemctl restart alertmanager && systemctl enable alertmanager

# lsof -i:9093
COMMAND     PID USER   FD   TYPE DEVICE SIZE/OFF NODE NAME
alertmana 39441 root    8u  IPv6 232407      0t0  TCP *:9093 (LISTEN)

#Check the command line to see if there is any alarm
root@deploy:/apps/alertmanager# ./amtool alert --alertmanager.url=http://172.16.244.100:9093
Alertname  Starts At  Summary  State
4.4 Prometheus alarm configuration
global:
  scrape_interval: 15s # Set the scrape interval to every 15 seconds. Default is every 1 minute.
  evaluation_interval: 15s # Evaluate rules every 15 seconds. The default is every 1 minute.
  # scrape_timeout is set to the global default (10s).

# Alertmanager configuration
alerting:
  alertmanagers:
    - static_configs:
        - targets:
           - 172.16.244.100:9093

# Load rules once and periodically evaluate them according to the global 'evaluation_interval'.
rule_files:
  # - "first_rules.yml"
  # - "second_rules.yml"
  - "rules.yml"
4.5 create alarm rule file
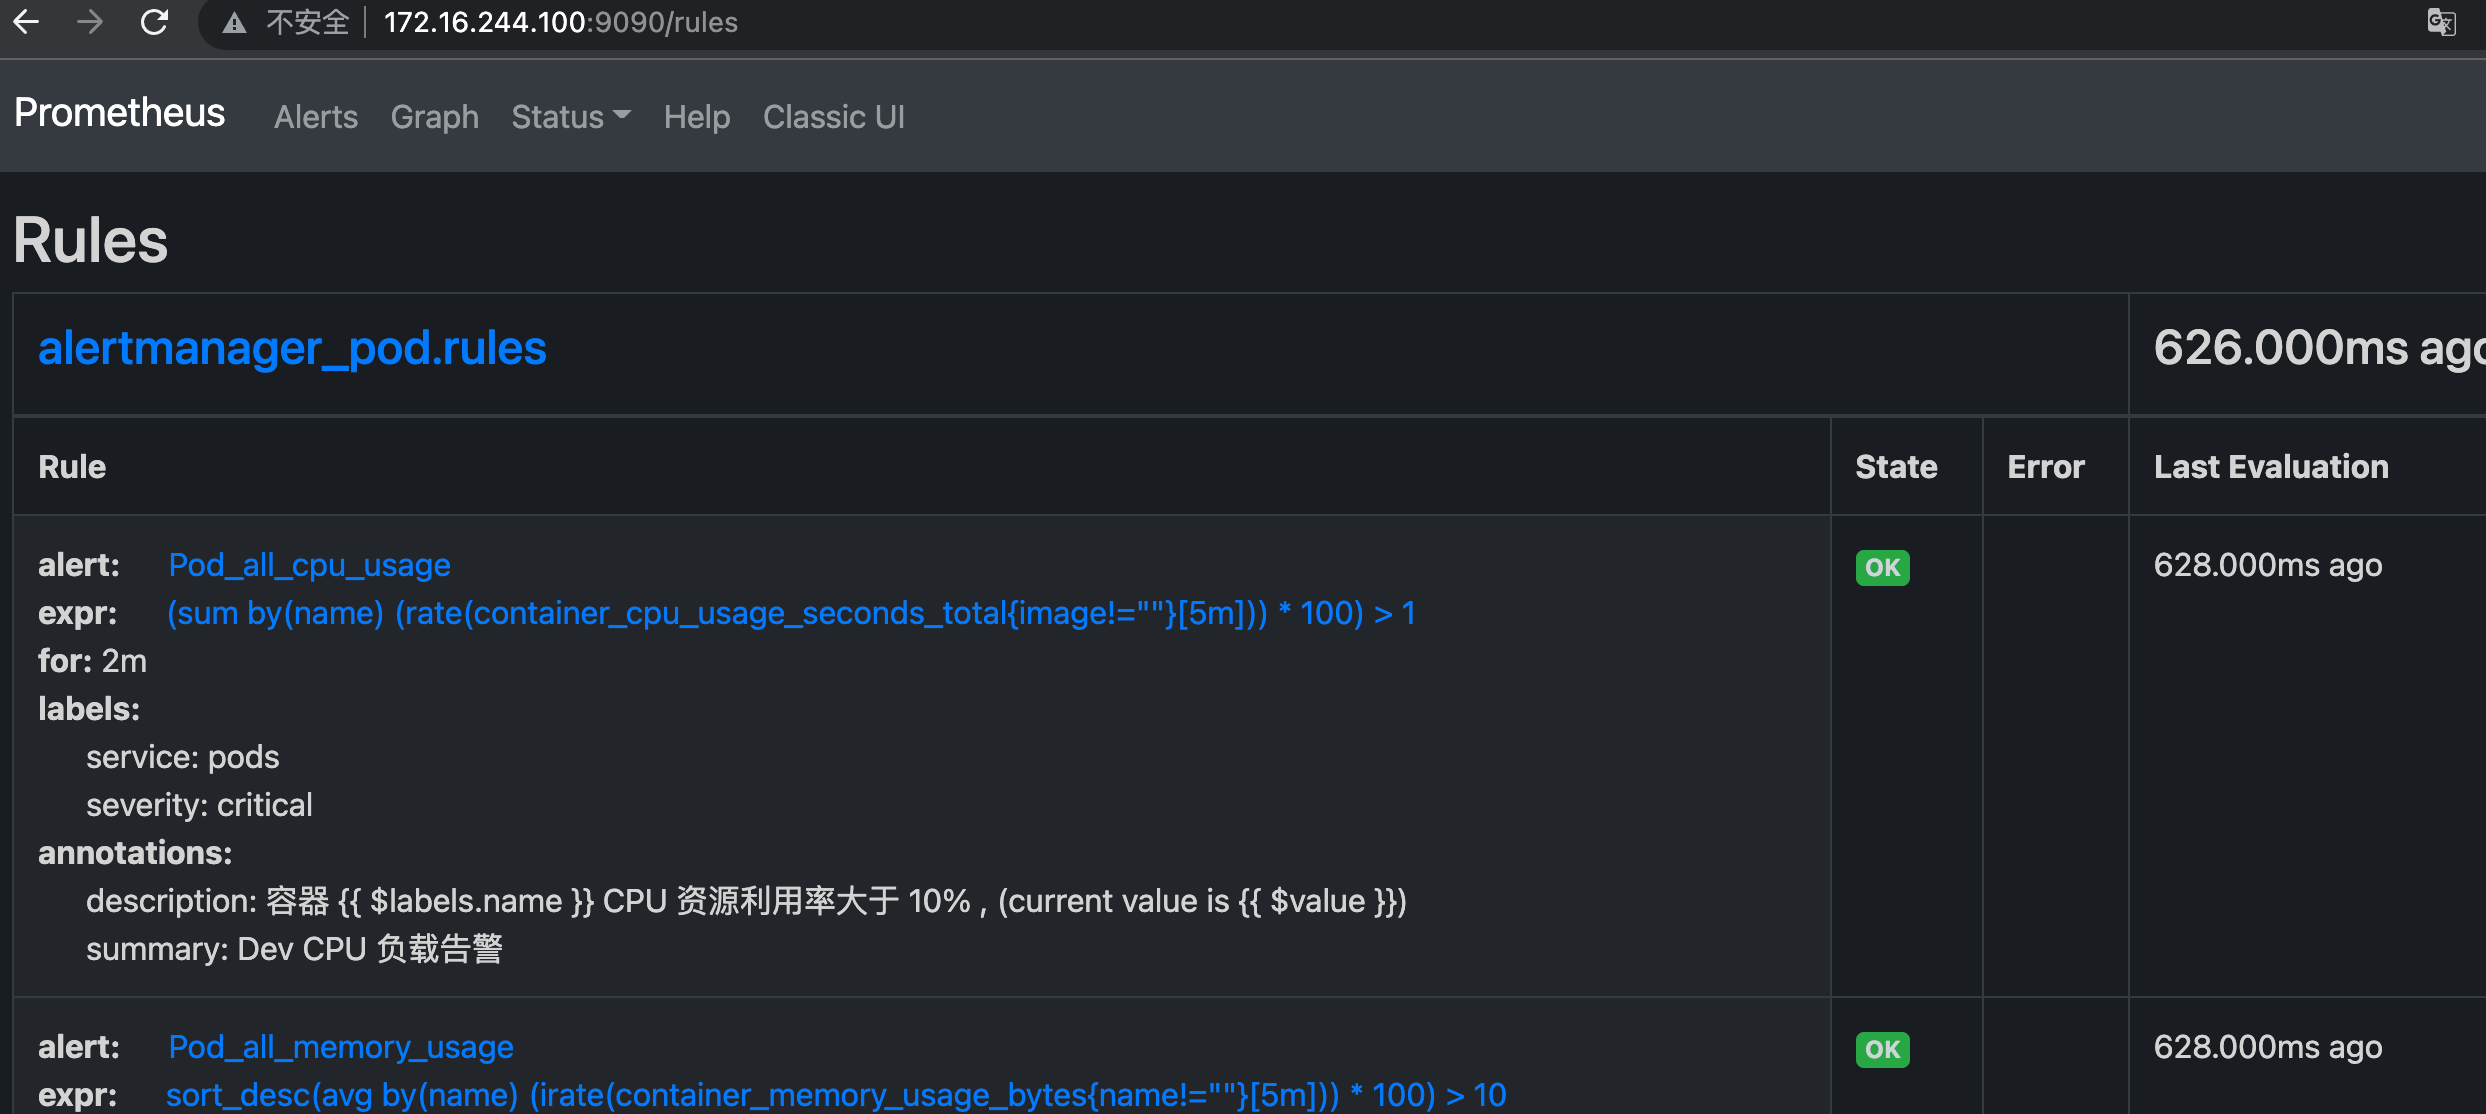
# vim /apps/prometheus/rules.yml
groups:
- name: alertmanager_pod.rules
rules:
- alert: Pod_all_cpu_usage
expr: (sum by(name)(rate(container_cpu_usage_seconds_total{image!=""}[5m]))*100) > 1
for: 2m
labels:
severity: critical
service: pods
annotations:
description: container {{ $labels.name }} CPU Resource utilization rate greater than 10% , (current value is {{ $value }})
summary: Dev CPU Load alarm
- alert: Pod_all_memory_usage
expr: sort_desc(avg by(name)(irate(container_memory_usage_bytes{name!=""}[5m]))*100) > 10 #Memory greater than 10%
#expr: sort_desc(avg by(name)(irate(node_memory_MemFree_bytes {name!=""}[5m]))) > 2 #Memory greater than 2G
for: 2m
labels:
severity: critical
annotations:
description: container {{ $labels.name }} Memory Resource utilization greater than 2 G , (current value is {{ $value }})
summary: Dev Memory Load alarm
- alert: Pod_all_network_receive_usage
expr: sum by(name)(irate(container_network_receive_bytes_total{container_name="POD"}[1m])) > 1
for: 2m
labels:
severity: critical
annotations:
description: container {{ $labels.name }} network_receive Resource utilization rate greater than 50 M ,(current value is {{ $value }})
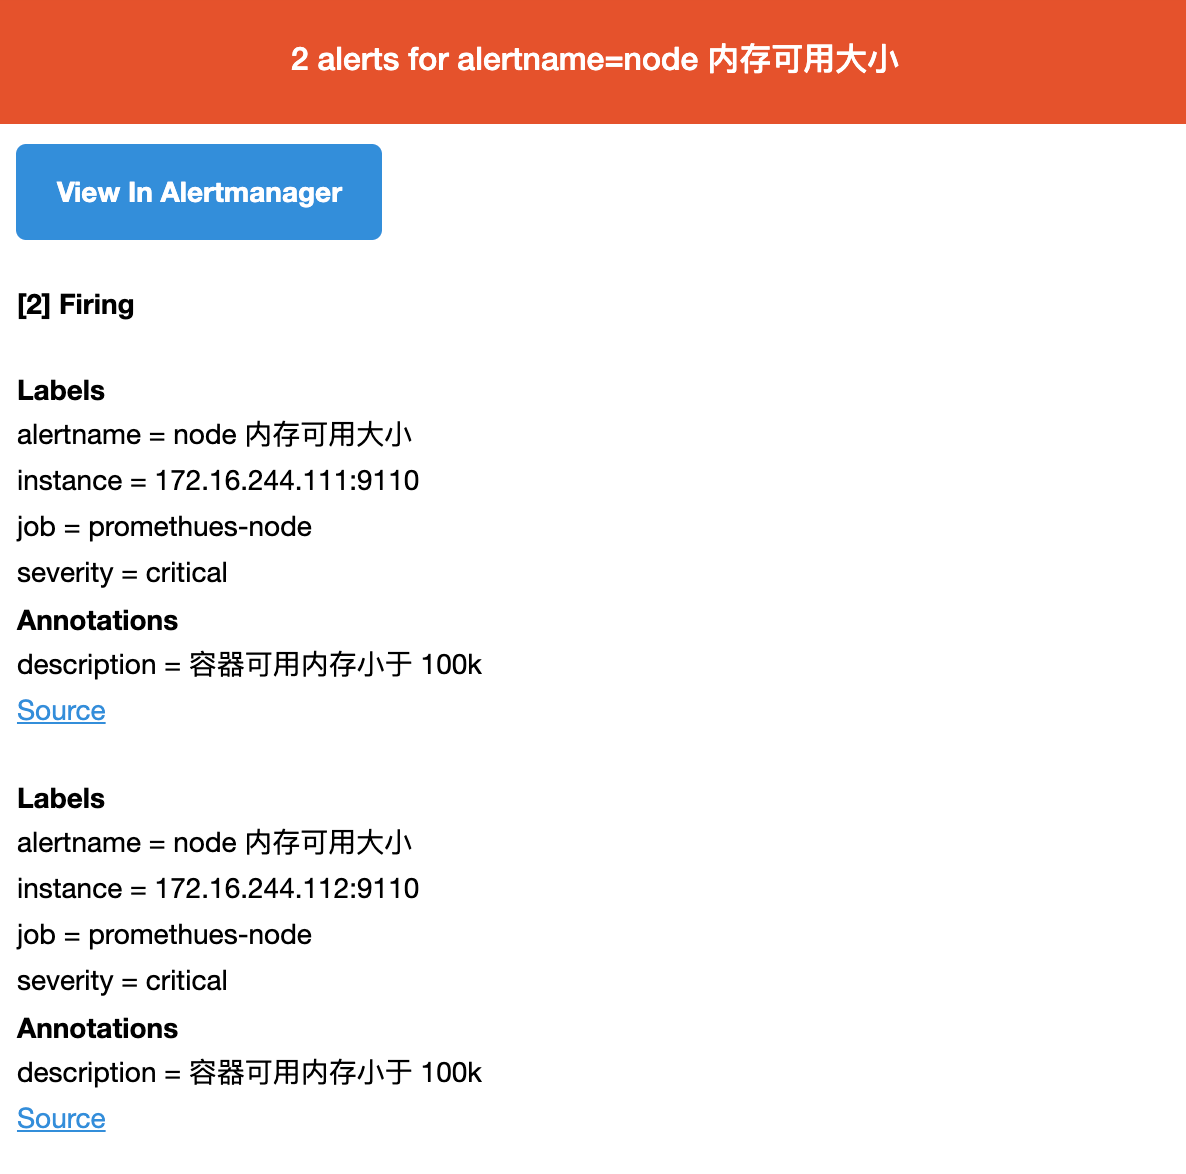
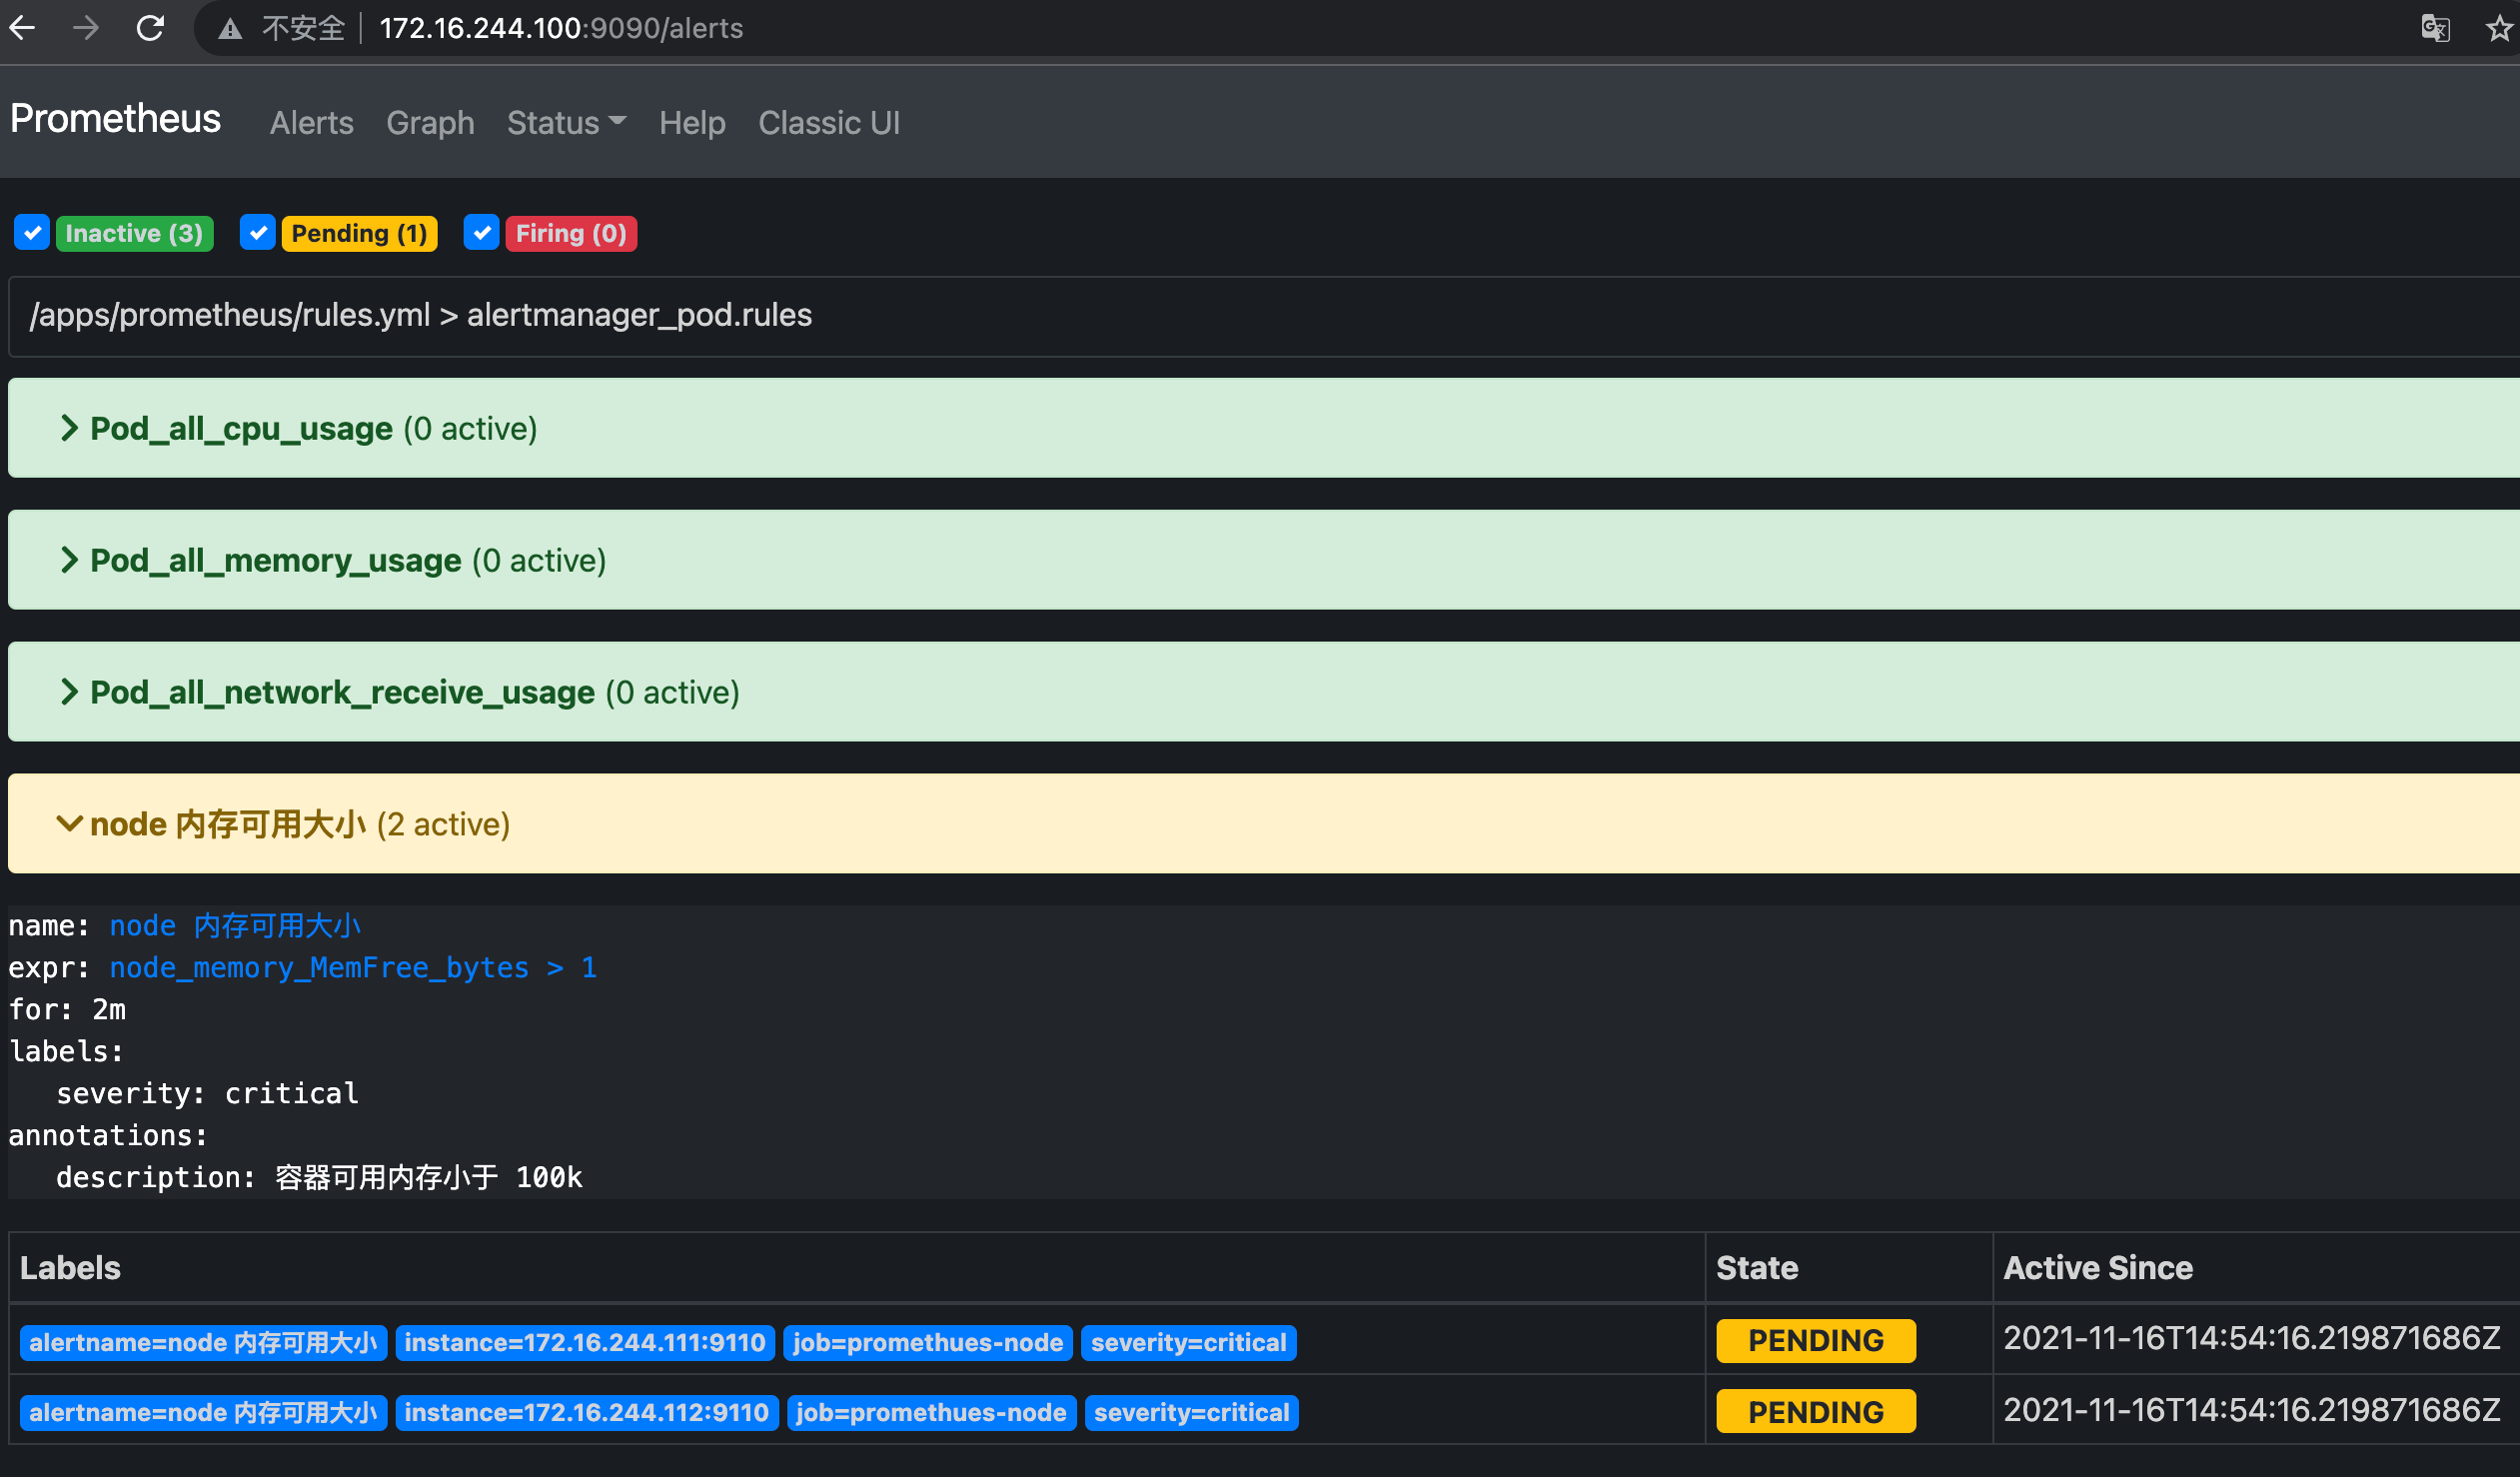
- alert: node Available memory size
expr: node_memory_MemFree_bytes > 1 #Write wrong and test
for: 2m
labels:
severity: critical
annotations:
description: The available memory of the container is less than 100 k
4.6 verification rules
root@deploy:/apps/prometheus# ./promtool check rules rules.yml
Checking rules.yml
  SUCCESS: 4 rules found
4.7 restart Prometheus and verify the rules
# systemctl restart prometheus
4.8 email verification