Industrial pointer meter reading
1 project description
In this project, we mainly introduce how to use target detection and semantic segmentation to realize the reading of pointer meter.
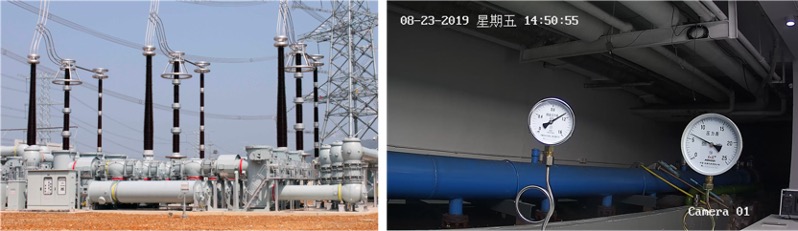
In the power and energy plant, the meter readings need to be monitored regularly to ensure the normal operation of equipment and the safety of the plant. However, the plant area is scattered, the manual patrol inspection takes a long time, the meter cannot be monitored in real time, and some working environments are dangerous, which makes the manual patrol inspection inaccessible. To solve the above problems, we hope to efficiently complete this task by taking photos with the camera - > intelligent reading.
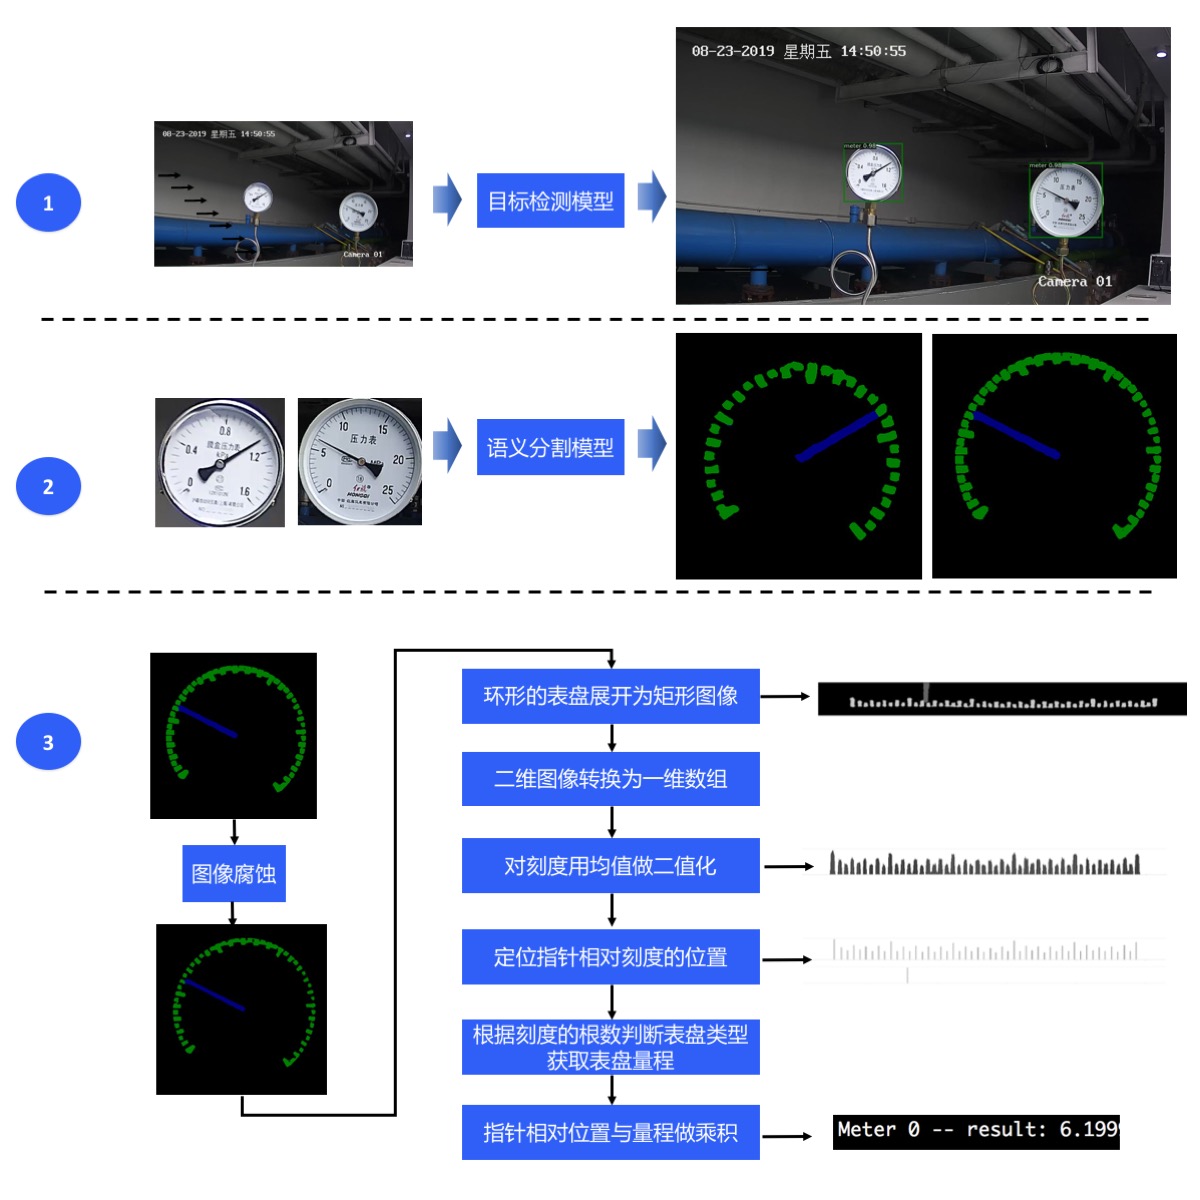
In order to realize intelligent reading, we adopt the scheme of target detection - > semantic segmentation - > reading post-processing:
- In the first step, the target detection model is used to locate the meter in the image;
- In the second step, the pointer and scale of each meter are segmented by using the semantic segmentation model;
- The third step is to calculate the readings of each meter according to the relative position of the pointer and the predicted range.
The process of the whole scheme is as follows:
2 data preparation
This case opens the meter detection data set, pointer and scale segmentation data set, meter test pictures (only pictures without true value annotation). These pictures can be used to complete the training and model prediction of target detection model and semantic segmentation model. Click the link in the table below to download the dataset. It is not necessary to download the dataset in advance, because the training script provided in the next model training section will automatically download the dataset.
| Meter test picture | Meter detection data set | Pointer and scale split dataset |
|---|---|---|
| meter_test | meter_det | meter_seg |
| Meter detection data set | Pointer and scale split dataset |
|---|---|
 |  |
- The folder contents of the unzipped meter detection data set are as follows:
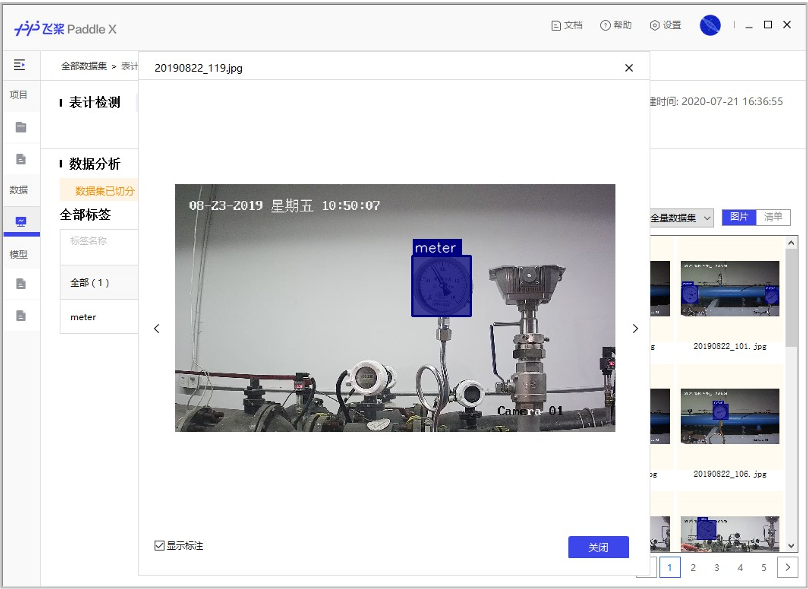
There are 725 pictures in the training set and 58 pictures in the test set.
meter_det/
|-- annotations/ # Label the folder where the file is located
|   |-- instance_train.json # Training set annotation file
|   |-- instance_test.json # Test set annotation file
|-- test/ # Test picture folder
|   |-- 20190822_105.jpg # Test set pictures
|   |-- ... ...
|-- train/ # Folder of training pictures
|   |-- 20190822_101.jpg # Training set pictures
|   |-- ... ...
- The folder contents of the decompressed pointer and scale split dataset are as follows:
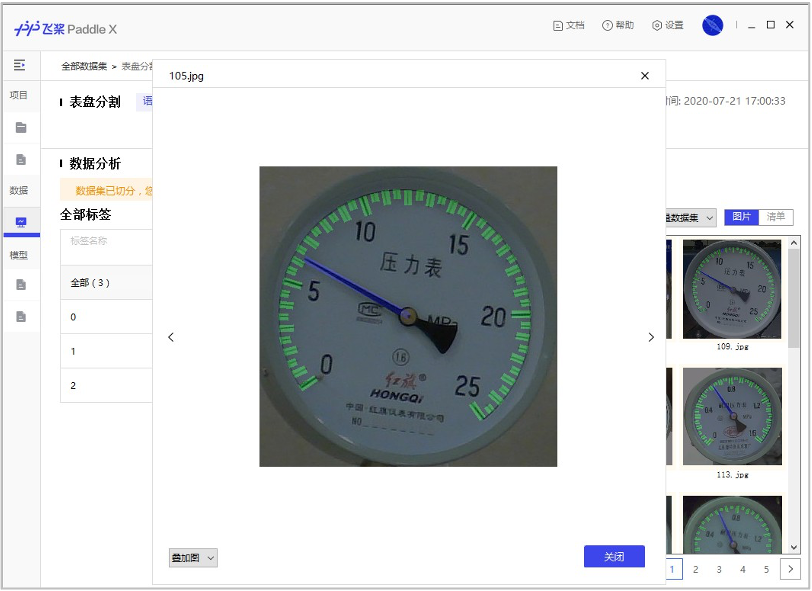
There are 374 pictures in the training set and 40 pictures in the test set.
meter_seg/
|-- annotations/ # Label the folder where the file is located
|   |-- train # Training set label picture folder
|   |   |-- 105.png
|   |   |-- ... ...
|   |-- val # Verify the folder where the collection label pictures are located
|   |   |-- 110.png
|   |   |-- ... ...
|-- images/ # Picture folder
|   |-- train # Training set pictures
|   |   |-- 105.jpg
|   |   |-- ... ...
|   |-- val # Validation set picture
|   |   |-- 110.jpg
|   |   |-- ... ...
|-- labels.txt # Class alias list
|-- train.txt # Training set picture list
|-- val.txt # Validation set picture list
- The folder contents of the unzipped meter test pictures are as follows:
A total of 58 test images.
meter_test/
|-- 20190822_105.jpg
|-- 20190822_142.jpg
|-- ... ...
3 model selection
PaddleX provides rich visual models, RCNN and YOLO series models in target detection, and deep labv3p and BiSeNetV2 models in semantic segmentation.
Because the final deployment scenario is the localized server GPU side with relatively sufficient computing power, PPYOLOV2 with excellent accuracy and prediction performance is used for meter detection in this project.
Considering that the pointer and scale are small areas, we use DeepLabV3P with better accuracy to segment the pointer and scale.
4 meter detection model training
In this project, PPYOLOV2 with accuracy and prediction performance is used for meter detection. Please refer to for specific code train_detection.py.
Run the following code to start training the model:
python train_detection.py
After training, the optimal model accuracy bbox_mmap reached 100%.
Description of training process:
Define data preprocessing - > define data set path - > initialize model - > model training
- Define data preprocessing
train_transforms = T.Compose([
    T.MixupImage(mixup_epoch=250), T.RandomDistort(),
    T.RandomExpand(im_padding_value=[123.675, 116.28, 103.53]), T.RandomCrop(),
    T.RandomHorizontalFlip(), T.BatchRandomResize(
        target_sizes=[320, 352, 384, 416, 448, 480, 512, 544, 576, 608],
        interp='RANDOM'), T.Normalize(
            mean=[0.485, 0.456, 0.406], std=[0.229, 0.224, 0.225])
])

eval_transforms = T.Compose([
    T.Resize(
        608, interp='CUBIC'), T.Normalize(
            mean=[0.485, 0.456, 0.406], std=[0.229, 0.224, 0.225])
])
- Define dataset path
# Download and decompress the meter detection data set. If it has been downloaded in advance, comment out the following two lines
meter_det_dataset = 'https://bj.bcebos.com/paddlex/examples/meter_reader/datasets/meter_det.tar.gz'
pdx.utils.download_and_decompress(meter_det_dataset, path='./')

train_dataset = pdx.datasets.CocoDetection(
    data_dir='meter_det/train/',
    ann_file='meter_det/annotations/instance_train.json',
    transforms=train_transforms,
    shuffle=True)
eval_dataset = pdx.datasets.CocoDetection(
    data_dir='meter_det/test/',
    ann_file='meter_det/annotations/instance_test.json',
    transforms=eval_transforms)
- Initialization model
num_classes = len(train_dataset.labels)
model = pdx.models.PPYOLOv2(
    num_classes=num_classes, backbone='ResNet50_vd_dcn')
- model training
model.train(
    num_epochs=170,
    train_dataset=train_dataset,
    train_batch_size=8,
    eval_dataset=eval_dataset,
    pretrain_weights='COCO',
    learning_rate=0.005 / 12,
    warmup_steps=1000,
    warmup_start_lr=0.0,
    lr_decay_epochs=[105, 135, 150],
    save_interval_epochs=5,
    save_dir='output/ppyolov2_r50vd_dcn',
    use_vdl=True)
5 pointer and scale segmentation model training
In this project, DeepLabV3P with better accuracy is used for pointer and scale segmentation. Please refer to for specific code train_segmentation.py.
Run the following code to start training the model:
python train_segmentation.py
After training, the accuracy miou of the optimal model is 84.09.
Description of training process:
Define data preprocessing - > define data set path - > initialize model - > model training
- Define data preprocessing
train_transforms = T.Compose([
    T.Resize(target_size=512),
    T.RandomHorizontalFlip(),
    T.Normalize(
        mean=[0.5, 0.5, 0.5], std=[0.5, 0.5, 0.5]),
])

eval_transforms = T.Compose([
    T.Resize(target_size=512),
    T.Normalize(
        mean=[0.5, 0.5, 0.5], std=[0.5, 0.5, 0.5]),
])
- Define dataset path
# Download and decompress the pointer scale split dataset. If it has been downloaded in advance, comment out the following two lines
meter_seg_dataset = 'https://bj.bcebos.com/paddlex/examples/meter_reader/datasets/meter_seg.tar.gz'
pdx.utils.download_and_decompress(meter_seg_dataset, path='./')

train_dataset = pdx.datasets.SegDataset(
    data_dir='meter_seg',
    file_list='meter_seg/train.txt',
    label_list='meter_seg/labels.txt',
    transforms=train_transforms,
    shuffle=True)

eval_dataset = pdx.datasets.SegDataset(
    data_dir='meter_seg',
    file_list='meter_seg/val.txt',
    label_list='meter_seg/labels.txt',
    transforms=eval_transforms,
    shuffle=False)
- Initialization model
num_classes = len(train_dataset.labels)
model = pdx.models.DeepLabV3P(num_classes=num_classes, backbone='ResNet50_vd', use_mixed_loss=True)
- model training
model.train(
    num_epochs=20,
    train_dataset=train_dataset,
    train_batch_size=4,
    pretrain_weights='IMAGENET',
    eval_dataset=eval_dataset,
    learning_rate=0.1,
    save_dir='output/deeplabv3p_r50vd')
6 model prediction
Run the following code:
python reader_infer.py --det_model_dir output/ppyolov2_r50vd_dcn/best_model --seg_model_dir output/deeplabv3p_r50vd/best_model/ --image meter_det/test/20190822_105.jpg
Then the information will be output on the terminal:
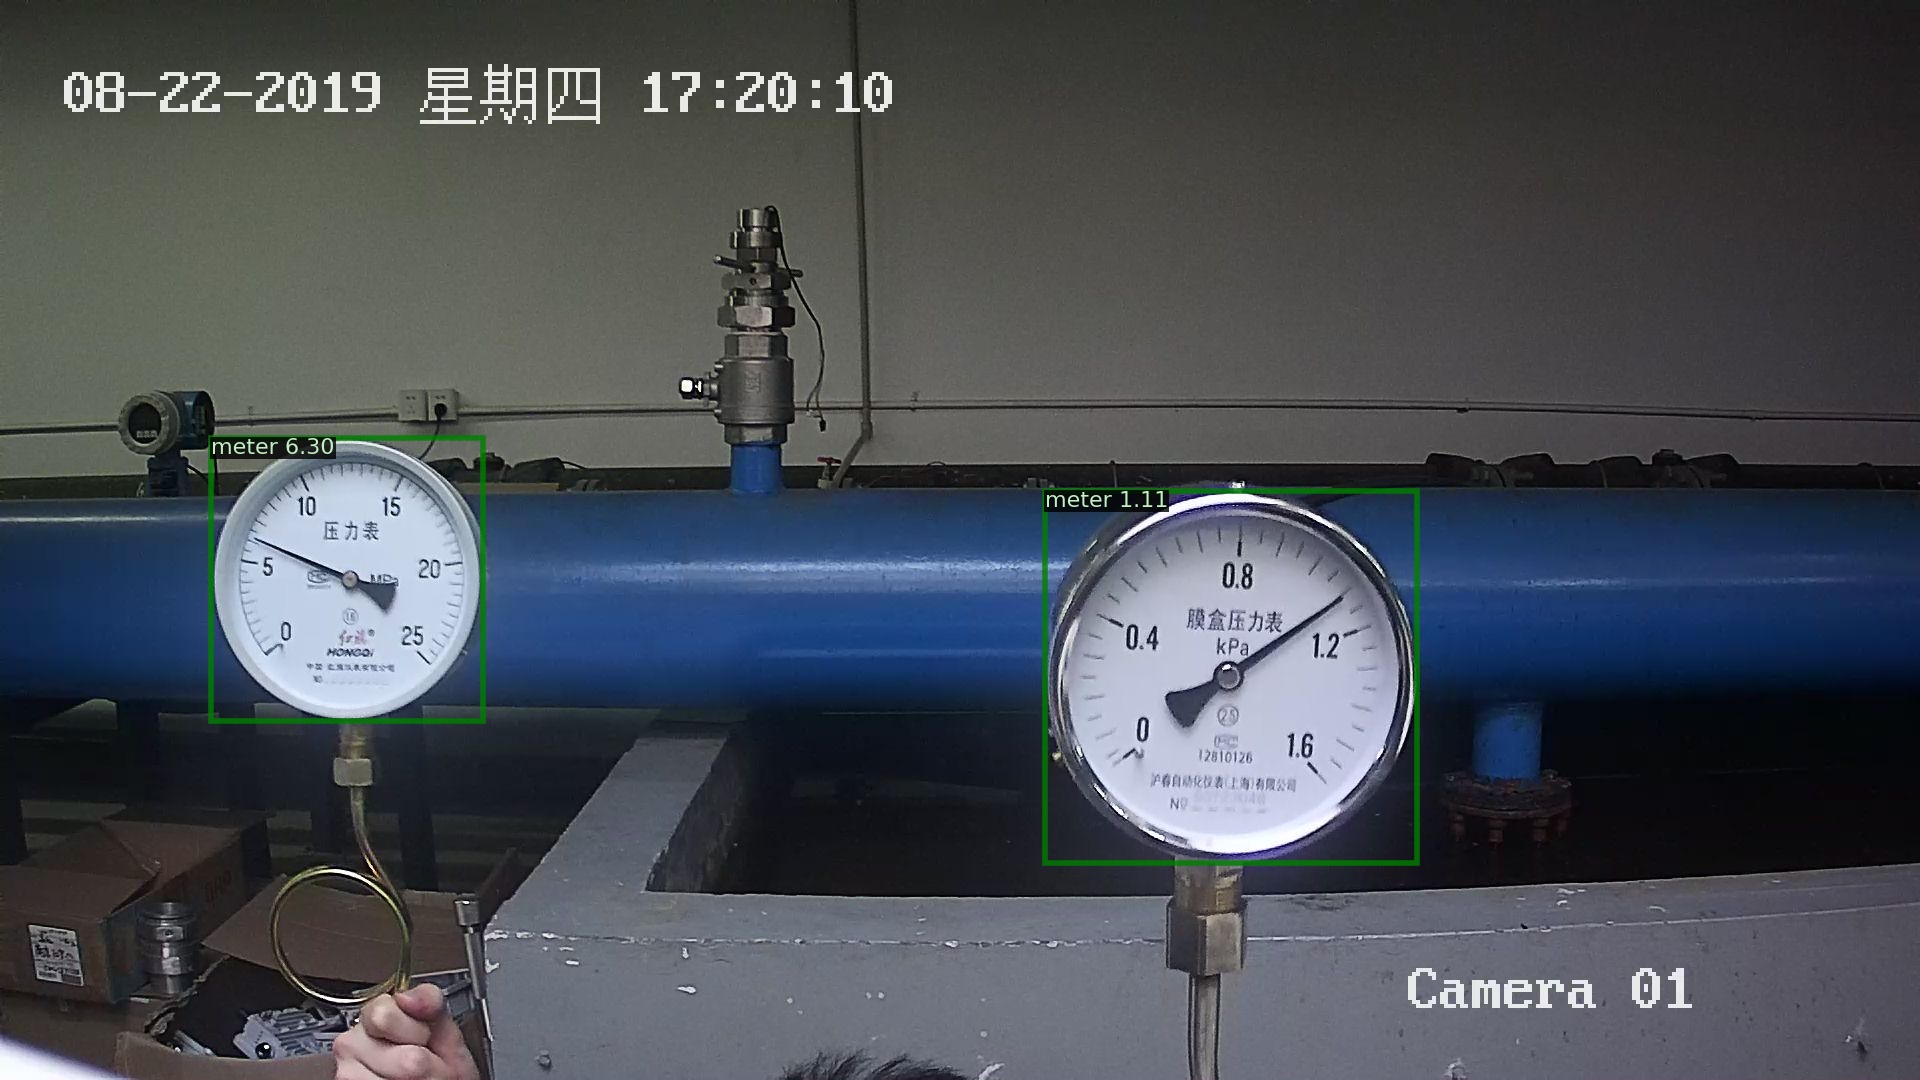
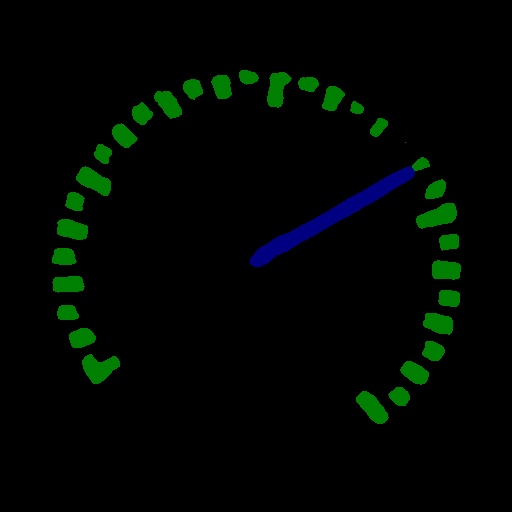
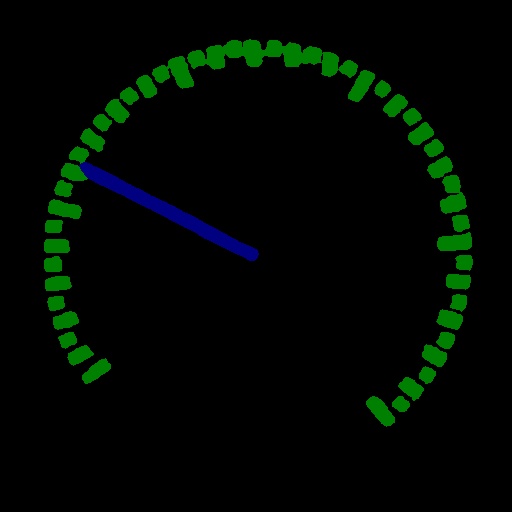
Meter 1: 6.299999866666726
Meter 2: 1.1057142840816332
2021-06-26 12:17:14 [INFO]  The visualized result is saved at ./output/result/visualize_1624709834720.jpg
The predicted results are as follows:
Let's look at the prediction process in the prediction code:
Image decoding - > detection meter - > filter detection frame - > extract the image area where the detection frame is located - > image scaling - > pointer and scale segmentation - > post-processing of reading - > Print Reading - > visual prediction results
def predict(self,
            img_file,
            save_dir='./',
            use_erode=True,
            erode_kernel=4,
            score_threshold=0.5,
            seg_batch_size=2):
    """The dial in the image is detected, and then the pointer and scale in each dial are segmented. The reading of each dial is obtained after reading and post-processing the segmentation results.

        Parameters:
            img_file (str): The path of the picture to be predicted.
            save_dir (str): Save path of visualization results.
            use_erode (bool, optional): Whether image corrosion is performed on the segmentation prediction results. Default: True.
            erode_kernel (int, optional): The convolution kernel size of image corrosion. Default value: 4.
            score_threshold (float, optional): The confidence threshold used to filter out the detection box. Default: 0.5.
            seg_batch_size (int, optional): The batch size of the input dial image when the segmentation model forward reasoning once. The default value is: 2.
    """

    img = self.decode(img_file)
    det_results = self.detector.predict(img)
    filtered_results = self.filter_bboxes(det_results, score_threshold)
    sub_imgs = self.roi_crop(img, filtered_results)
    sub_imgs = self.resize(sub_imgs, METER_SHAPE)
    seg_results = self.seg_predict(self.segmenter, sub_imgs, seg_batch_size)
    seg_results = self.erode(seg_results, erode_kernel)
    meter_readings = self.get_meter_reading(seg_results)
    self.print_meter_readings(meter_readings)
    self.visualize(img, filtered_results, meter_readings, save_dir)
7 model export
During the training process, the model is saved in the output folder. At this time, the model format is still dynamic graph format, and it needs to be exported to static graph format for further deployment.
Run the following command to export the meter detection model, which will be automatically displayed in meter_ det_ Create an information under the model folder_ Model folder, which is used to store the detection model in static graph format.
paddlex --export_inference --model_dir=output/ppyolov2_r50vd_dcn/best_model --save_dir=meter_det_model
Run the following command to export the scale and pointer segmentation model, which will be automatically displayed in meter_ seg_ Create an information under the model folder_ The folder of model is used to store the segmentation model in static graph format.
paddlex --export_inference --model_dir=output/deeplabv3p_r50vd/best_model --save_dir=meter_seg_model
If TensorRT needs to be used during deployment, the input size of the model needs to be fixed when exporting the model. Refer to the specific export process Deployment model export.
8 model deployment in Windows Environment
In the previous step, we have exported the model to static graph format, and now we can start deployment. If you don't want to run the previous training steps, you can also download the model we have trained and exported to static diagram format for the following deployment process:
| Meter detection pre training model | Scale and pointer segmentation pre training model |
|---|---|
| meter_det_model | meter_seg_model |
Here we are based on PaddleX Manufature SDK Deploy.
Environmental dependence
- Visual Studio 2019
- CUDA 10.2, CUDNN 7.6
- CMake 3.0+
Compilation steps
All the following examples are demonstrated with the working directory D:\projects.
Step 1: Download industrial meter reading deployment code
d:
mkdir projects
cd projects
git clone https://github.com/PaddlePaddle/PaddleX.git
cd PaddleX
git checkout release/2.0.0
Step 2: download the paddlex manufacture SDK
Click the link to download CUDA 10.2/CUDNN 7.6 for Windows 10 platform PaddleXManufature.tar.
After extracting the SDK, its directory (e.g. D: \ projects \ paddlexfeature \) mainly contains the following contents:
├── \include\ # paddlex deploy core libraries and header files
|
├── \lib\ #
|
├── \share\ #
|
├── \third_party\ # Third party dependent libraries and header files
|
└── \version.txt # Version and compilation information
Step3: installing and configuring OpenCV
- Download version 3.4.6 for Windows platform on OpenCV official website Download address
- Run the downloaded executable file and extract OpenCV to the specified directory, such as D:\projects\opencv
- Configure environment variables, as shown in the following process
- My computer - > properties - > advanced system settings - > environment variables
- Find Path in the system variable (if not, create it yourself), and double-click to edit it
- New, fill in and save the opencv path, such as D:\projects\opencv\build\x64\vc15\bin
- There will be relevant prompts during cmake construction. Please pay attention to the output of vs2019
Step4: Download TensorRT
- Download TensorRT-7.0.0.11 for CUDA 10.2 and cudnn 7 on NVIDIA's official website
- Unzip TensorRT to the specified directory, for example, D:\projects\TensorRT-7.0.0.11
Step5: directly compile CMake using Visual Studio 2019
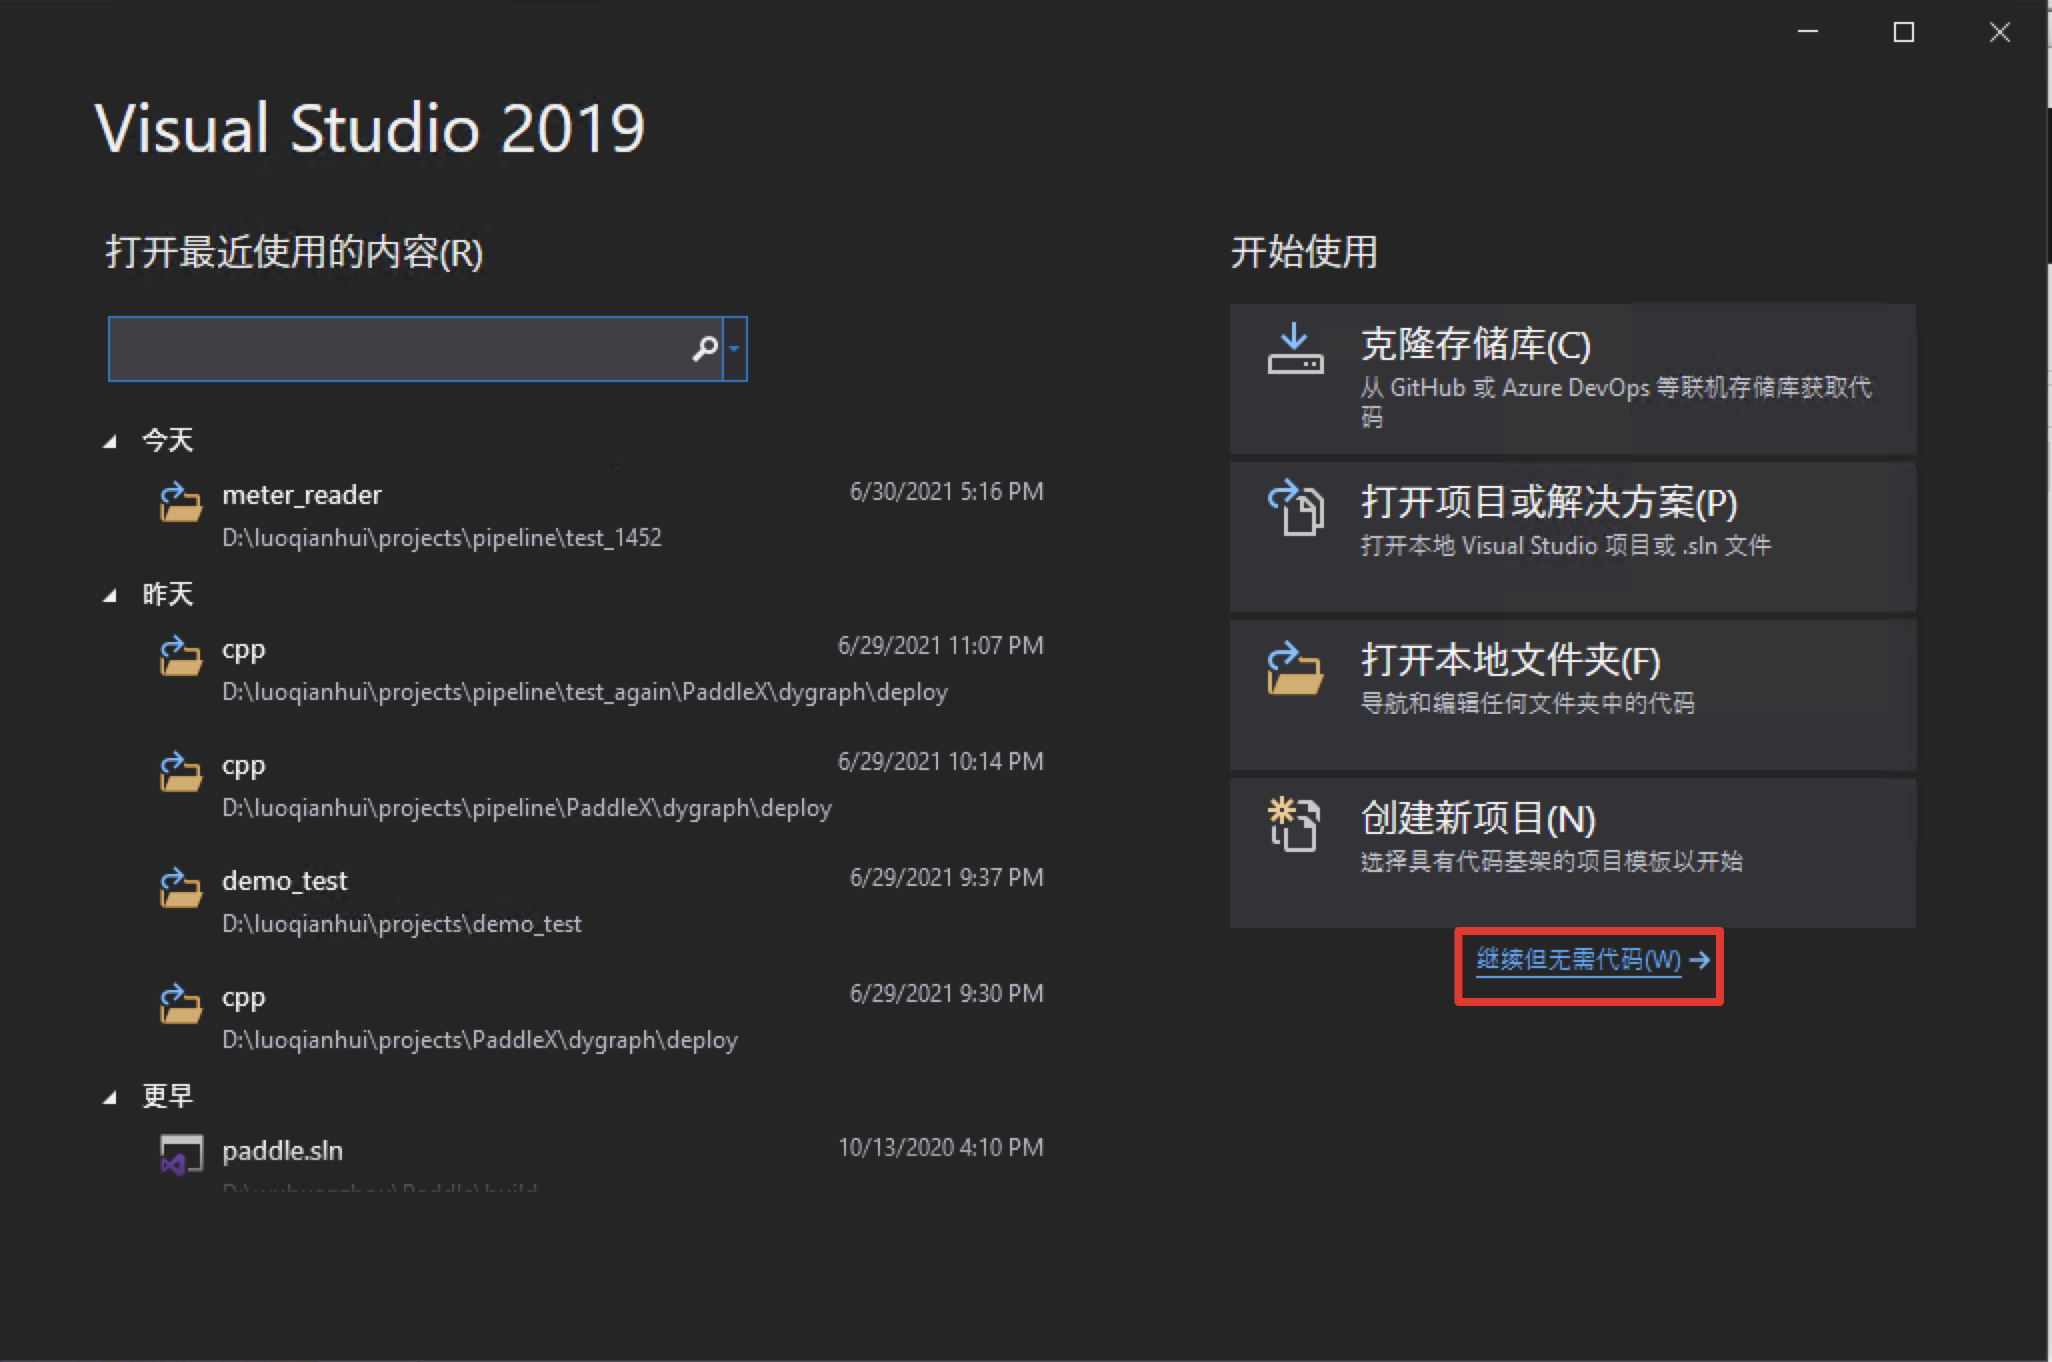
-
Open Visual Studio 2019 Community and click continue without code
-
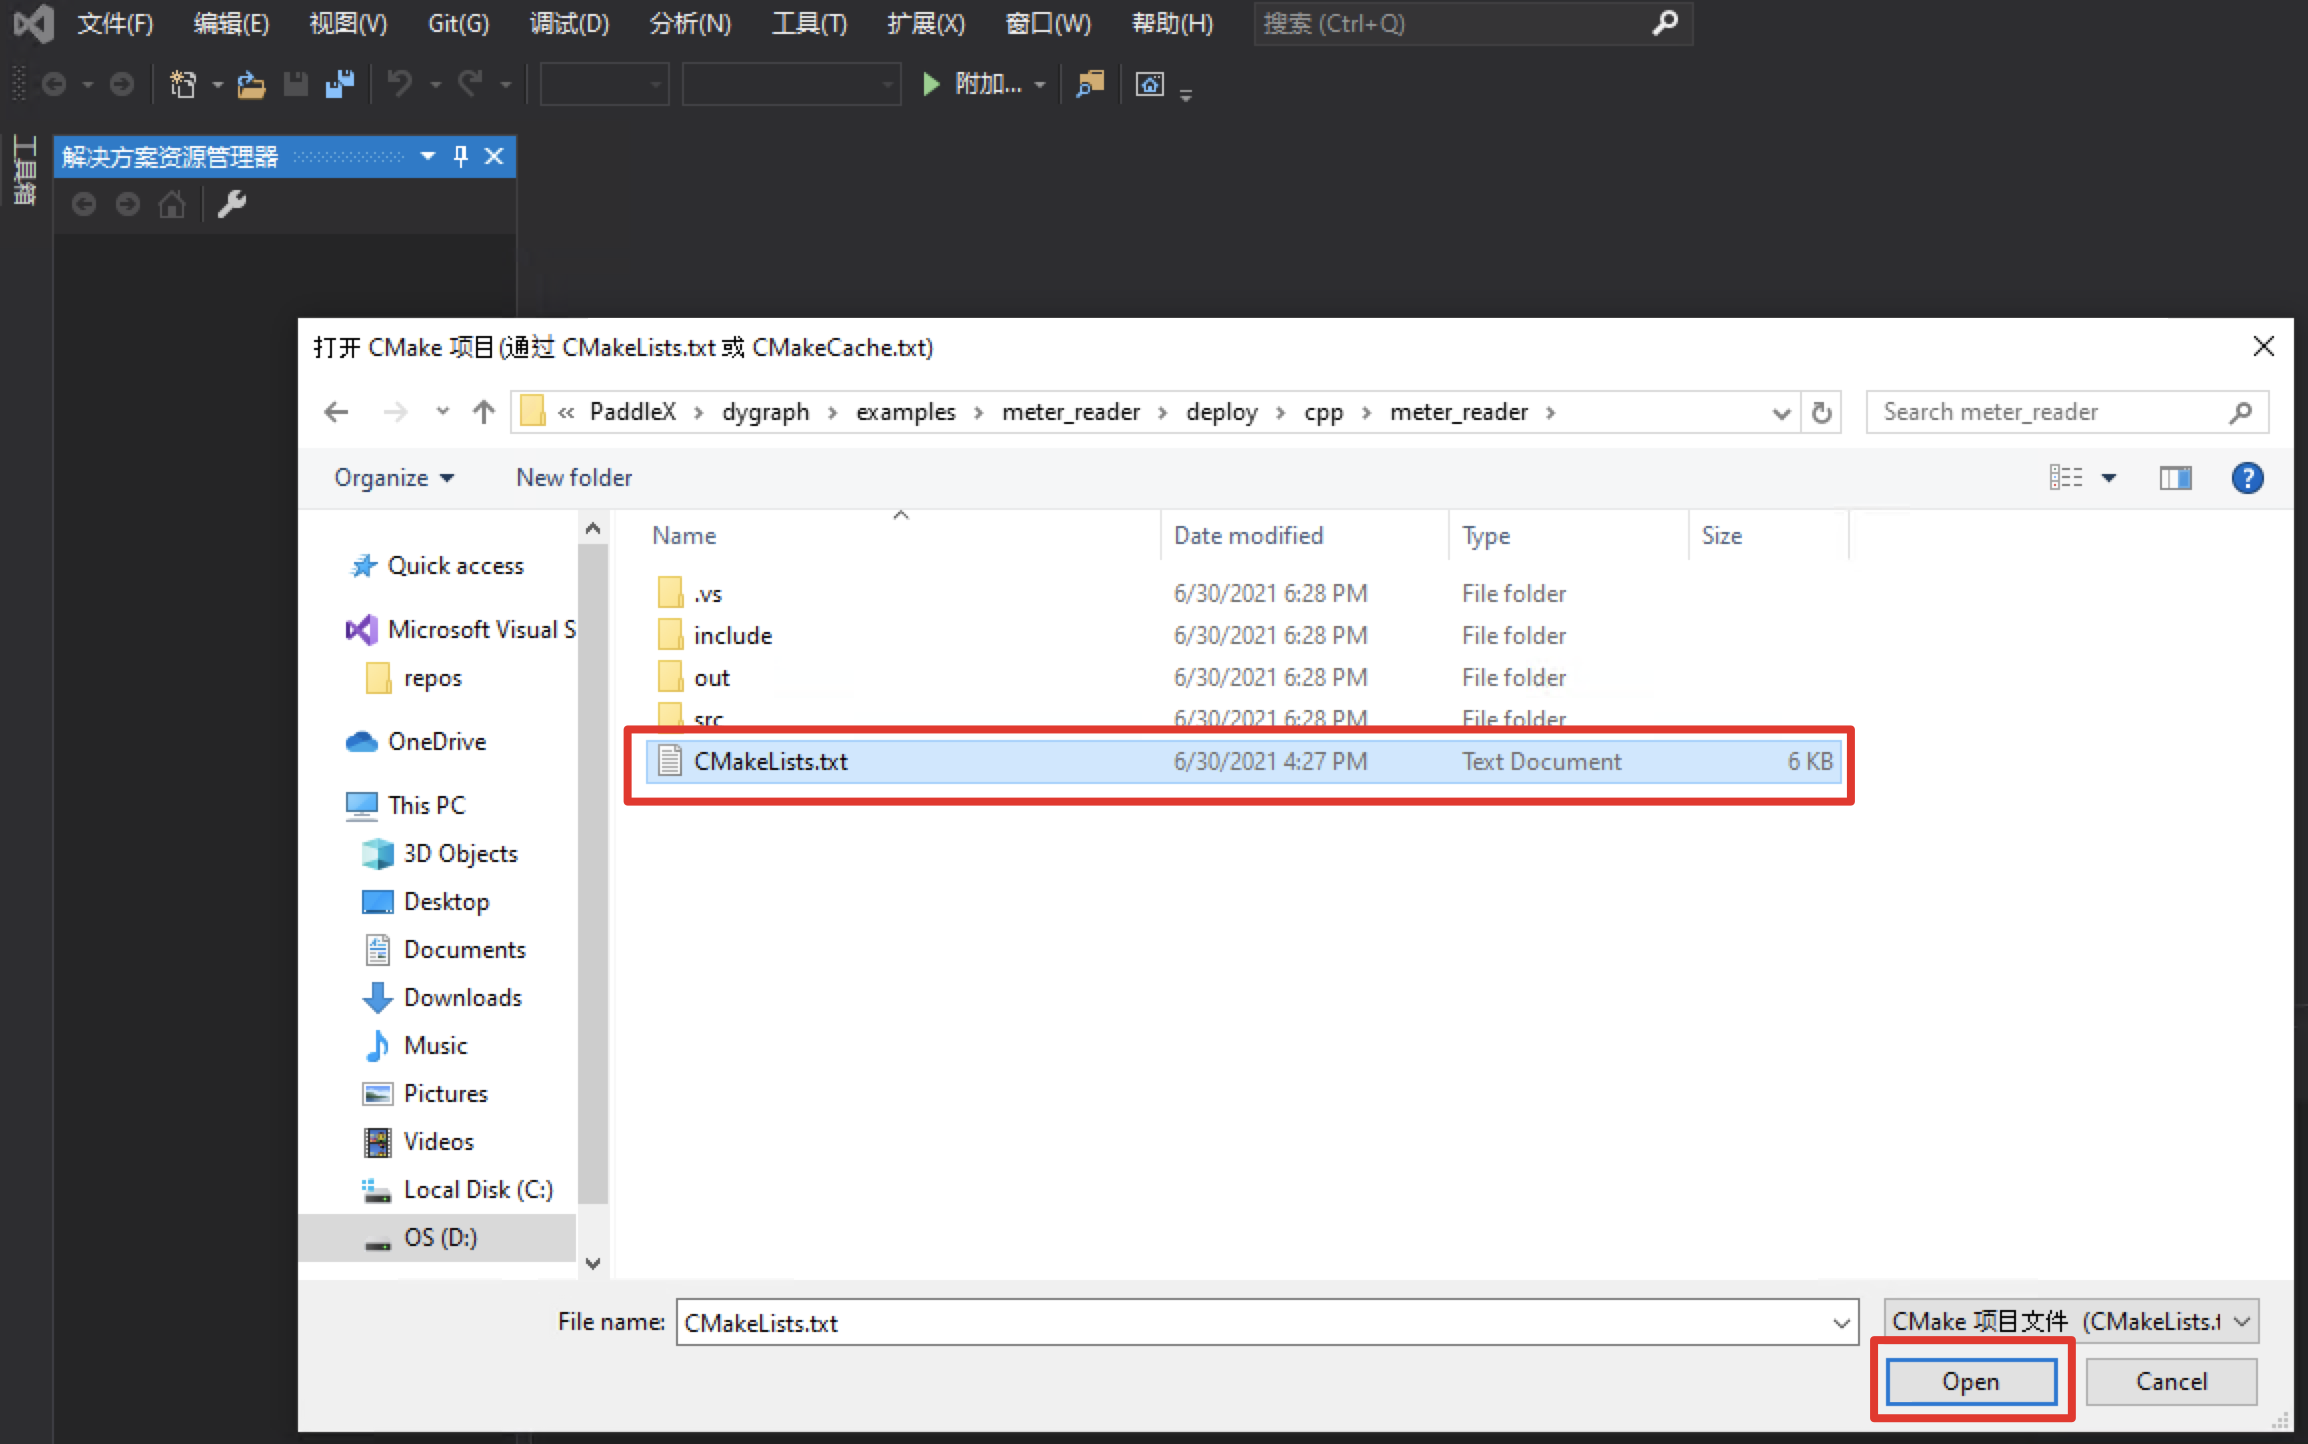
Click: File - > Open - > cmake
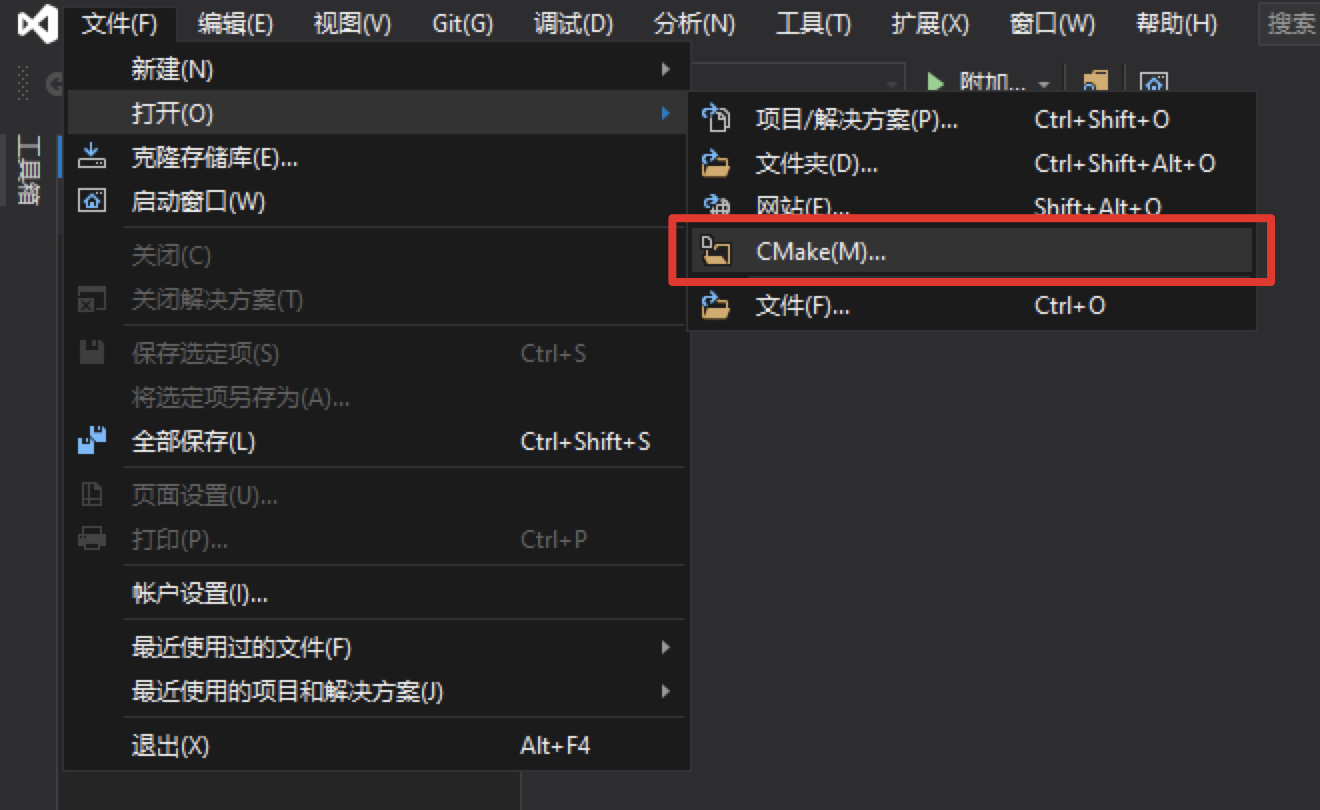
Select the path where the meter reading C + + prediction code is located (for example, D:\projects\PaddleX\examples/meter_reader/deploy/cpp/meter_reader), and open CMakeList.txt:
- When you open a project, it may be built automatically. Because the following dependent path settings are not performed, an error will be reported, which can be ignored first.
Click: Project - > cmake settings
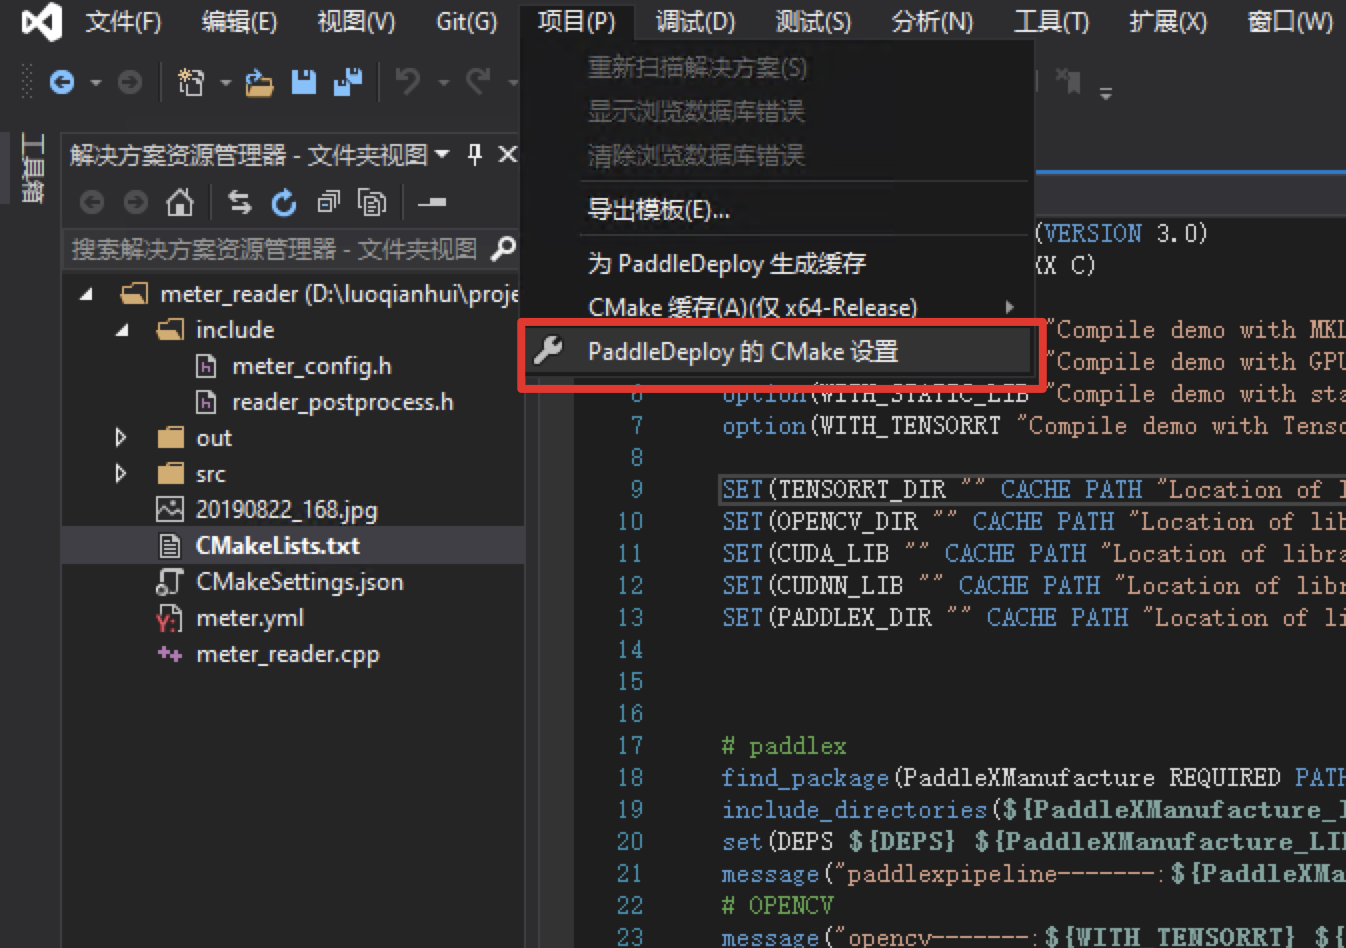
-
Click Browse to set compilation options and specify CUDA and opencv respectively_ DIR,PADDLEX_DIR,PaddleXManufacture_DIR and TensorRT paths (you can also click "Edit json" in the upper right corner, directly modify the json file, and then save the point project - > generate cache)
The meaning of the dependent library path is described as follows (a * indicates that it is only specified when using the GPU version prediction library, where the CUDA library version is aligned with the paddexmanufacture. For example, if the paddexmanufacture is compiled with versions 9.0 and 10.0, the CUDA libraries of versions 9.2 and 10.1 are not used when compiling the paddex prediction code):
| Parameter name | meaning |
|---|---|
| CUDA_LIB | The library path of CUDA. Note: please copy the cudnn.lib file of CUDNN to CUDA_LIB path. For example, C:\Program Files\NVIDIA GPU Computing Toolkit\CUDA\v10.2\lib\x64 |
| OPENCV_DIR | The installation path of OpenCV, such as D:\projects\opencv |
| PADDLEX_DIR | The path to the PaddleXManufacture, for example, D:\projects\PaddleXManufacture |
| PaddleXManufacture_DIR | The path of config.cmake of PaddleXManufacture, such as D:\projects\PaddleXManufacture\share\PaddleXManufacture |
| TENSORRT_DIR | Path to PaddleXManufacture, for example, D:\projects\TensorRT-7.0.0.11 |
- If the CPU version prediction library is used, please set with_ Remove the tick from the GPU value
- WITH_ The value of tensorrt must be checked
- Save and generate CMake cache
After setting, CTRL+C saves. Then we can see that the output of vs will print the process of CMake generation. If CMake generation is completed and no error is reported, it means that the generation is completed.
- Click Project - > generate all to generate meter_ Executable file in reader.
Step6: compilation results
After compilation, it will be displayed in D: \ projects \ paddlex \ examples \ meter_ Generate meter in reader \ out \ build \ x64 release directory_ Reader.exe binary.
The process configuration files required to use the PaddleXManufacture are located in PaddleX\examples\meter_reader\meter_pipeline.yml, open the configuration file and modify the path where the detection model and segmentation model are located:
| Modify the path where the detection model is located and set use_gpu and use_trt is true | Modify the path where the split model is located and set use_gpu and use_trt is true |
|---|---|
 |  |
The path of the model is the path of the model we exported in the previous step
Open the CMD terminal, run the executable file of meter reading, and conduct reasoning and prediction:
cd PaddleX\examples\meter_reader\deploy\cpp\meter_reader\
.\out\build\x64-Release\meter_reader.exe --pipeline_cfg meter_pipeline.yml --image 20190822_168.jpg
After execution, the terminal will output the prediction results:
save_dir: ./output_det does not exists. This path will be created automatically.
save_dir: ./output_seg does not exists. This path will be created automatically.
Box(0   meter   0.98431444      656.26440430    451.94650269    224.40563965    230.18161011)
Box(0   meter   0.98169208      1374.56347656   529.34149170    284.29077148    291.98461914)
ScoreMask(mean: 13.08305625     std:    44.50118578)    LabelMask(mean: 0.10153198      std:    0.18212054)
Meter 1: 1.05576932
Meter 2: 6.21739101
The visual prediction results of the detection model are saved in PaddleX\examples\meter_reader\deploy\cpp\meter_reader\out\build\x64-Release\output_det, you can click to view:
[the external chain picture transfer fails. The source station may have an anti-theft chain mechanism. It is recommended to save the picture and upload it directly (IMG xyoctbuq-1638232719939) (. / images / 20190822_168. JPG)]
The prediction results visualized in the segmentation model are saved in PaddleX\examples\meter_reader\deploy\cpp\meter_reader\out\build\x64-Release\output_seg, you can click to view:
| Table 1 visual segmentation results | Table 2 visual segmentation results |
|---|
|  |
|  |
|