How to use Matplotlib Foundation (preliminary notes)
Before drawing, you need to matplotlib.pyplot Import
The method is as follows:
from matplotlib import pyplot as plt
1. Line chart
plt.plot The default is a 2D polyline, and a line object is returned when drawing
Direct use requires the following:
plot([x], y, [fmt], *, data=None, **kwargs)
plot([x], y, [fmt], [x2], y2, [fmt2], ..., **kwargs)
Let the picture show
plt.show()
Examples are:
x_age = [20,21,22,23,24,25,26,27,28,29]
y_salary = [10000,20000,30000,40000,50000,60000,70000,80000,90000,100000]
plt.plot(x_age,y_salary)
plt.show()
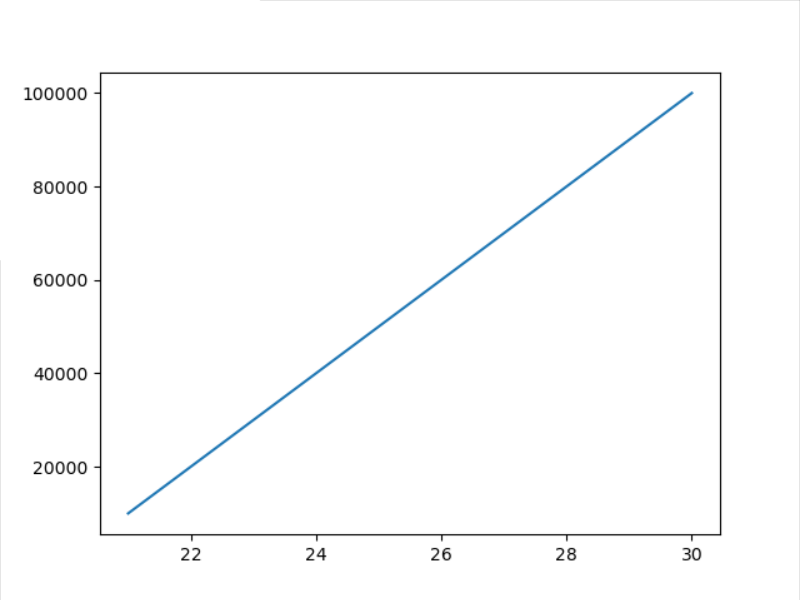
The above is the most basic use. If you just plot the data without considering the color, line form, etc., then you can do so. But if you want the picture to have different shapes, you can change some of the plot parameters:
Axis:
plt.axis()
If it is not suitable for the above coordinate axis, you can use the plt.axis() method, the format of the input parameters is as follows:
[xmin, xmax, ymin, ymax]
x_age = [20,21,22,23,24,25,26,27,28,29]
y_salary = [10000,20000,30000,40000,50000,60000,70000,80000,90000,100000]
plt.plot(x_age,y_salary)
plt.axis([10,50,5000,200000])
plt.show()

In this way, after changing the coefficient of the coordinate axis, the whole presentation of the picture changes, but in essence, it does not change.
The form of a polyline (such as color, point, and line)
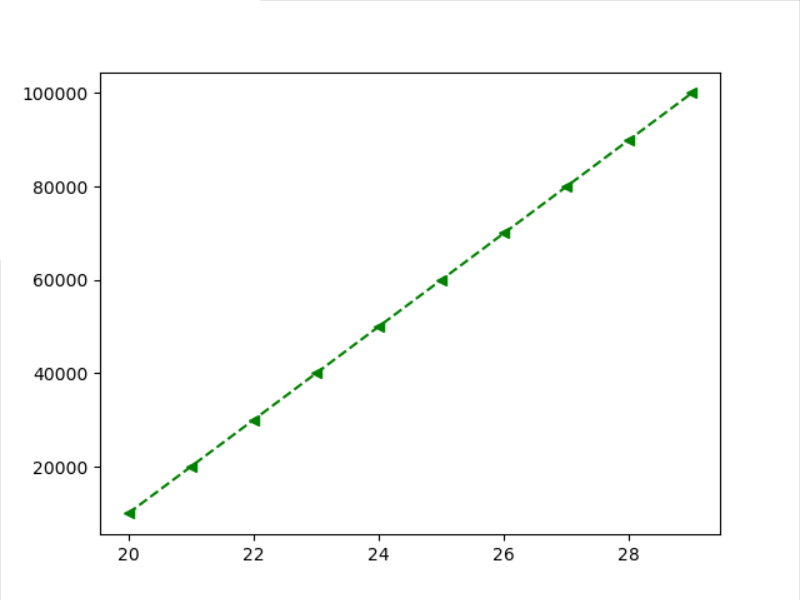
According to the official documents of matplotlib, to change the marker form of line2D object, only when drawing:
x_age = [20,21,22,23,24,25,26,27,28,29]
y_salary = [10000,20000,30000,40000,50000,60000,70000,80000,90000,100000]
plt.plot(x_age,y_salary,linestyle="--",color="g",marker="<")
plt.show()

So it takes the form of the above,
linestyle represents line type, color represents line color, marker represents point display,
More detailed parameters can be obtained from matplotlib official address Library Found
When more skilled, it can be concentrated
x_age = [20,21,22,23,24,25,26,27,28,29]
y_salary = [10000,20000,30000,40000,50000,60000,70000,80000,90000,100000]
plt.plot(x_age,y_salary,"<g--")
plt.show()
The effect is the same as before. The input format of parameters is
[marker][color][linestyle]
Add legend
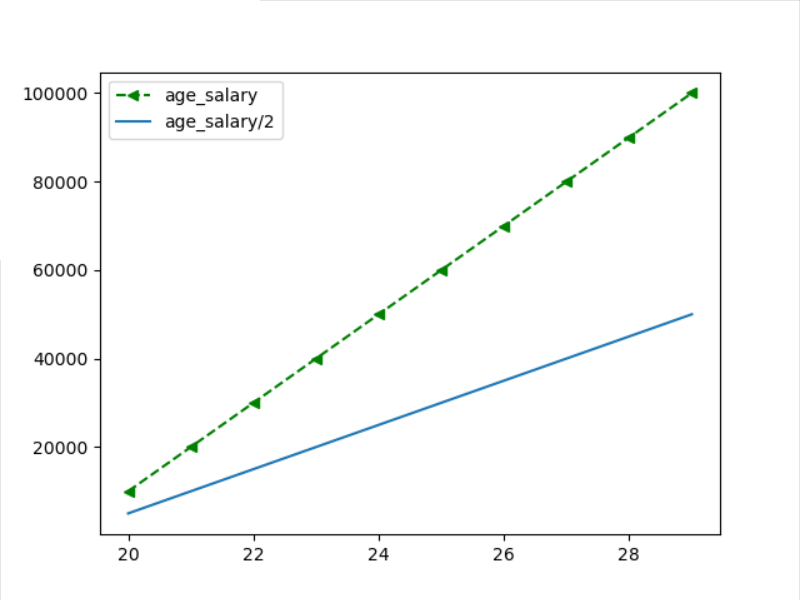
Like changing linetypes, colors, and points, there are two methods that are suitable for identification when multiple lines are put together.
x_age = [20,21,22,23,24,25,26,27,28,29]
y_salary = [10000,20000,30000,40000,50000,60000,70000,80000,90000,100000]
plt.plot(x_age,y_salary,"<g--",label ="age_salary")
plt.legend()
plt.show()

You can see that there is another legend in the upper left corner`
x_age = [20,21,22,23,24,25,26,27,28,29]
y_salary = [10000,20000,30000,40000,50000,60000,70000,80000,90000,100000]
y_salary_2 = [i/2 for i in y_salary]
plt.plot(x_age,y_salary,"<g--",label ="age_salary")
plt.plot(x_age,y_salary_2 ,label="age_salary/2")
plt.legend()
plt.show()
The second way is,
x_age = [20,21,22,23,24,25,26,27,28,29]
y_salary = [10000,20000,30000,40000,50000,60000,70000,80000,90000,100000]
y_salary_2 = [i/2 for i in y_salary]
plt.plot(x_age,y_salary,"<g--")
plt.plot(x_age,y_salary_2 )
plt.legend(["age_salary","age_salary/2"])
plt.show()

Consistent results