Story Background: These days, I met a customer who took minutes of the meeting. During each meeting, a special device would record the position of the speaker and display it in an angle value. He gave me the angle value, and let me make a chart for him to show everyone's approximate position.
Customers think of using Echarts charts to do it, I first thought of using Echarts, but after thinking about his requirements, I found that it is not a big waste to use Echarts for a simple box chart, but also to import so many useless codes.
So I thought of using canvas canvas canvas to imitate it, but I also considered that canvas is not easy to operate; can we use common css combined with javascript to make it? This thinking proves that: anything must be more brainy, in order to encounter a simpler way to solve the problem.
Considering that it might be useful one day, it was released. Note: With portability, can be moved to any location on the page, the effect will not change.
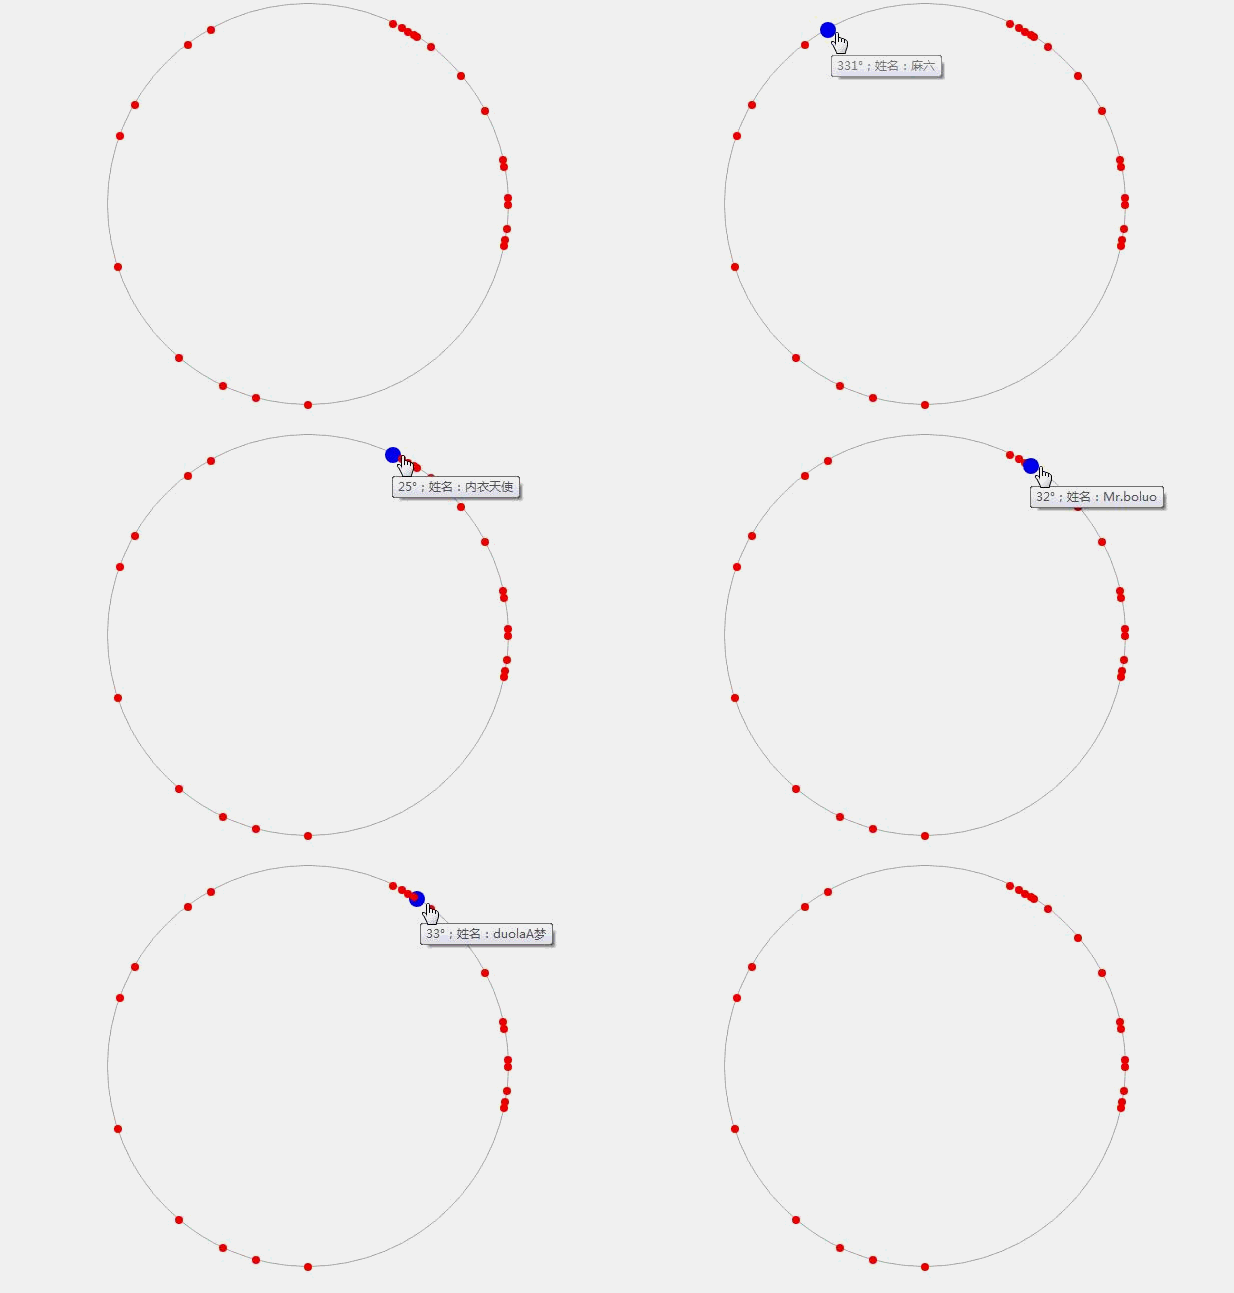
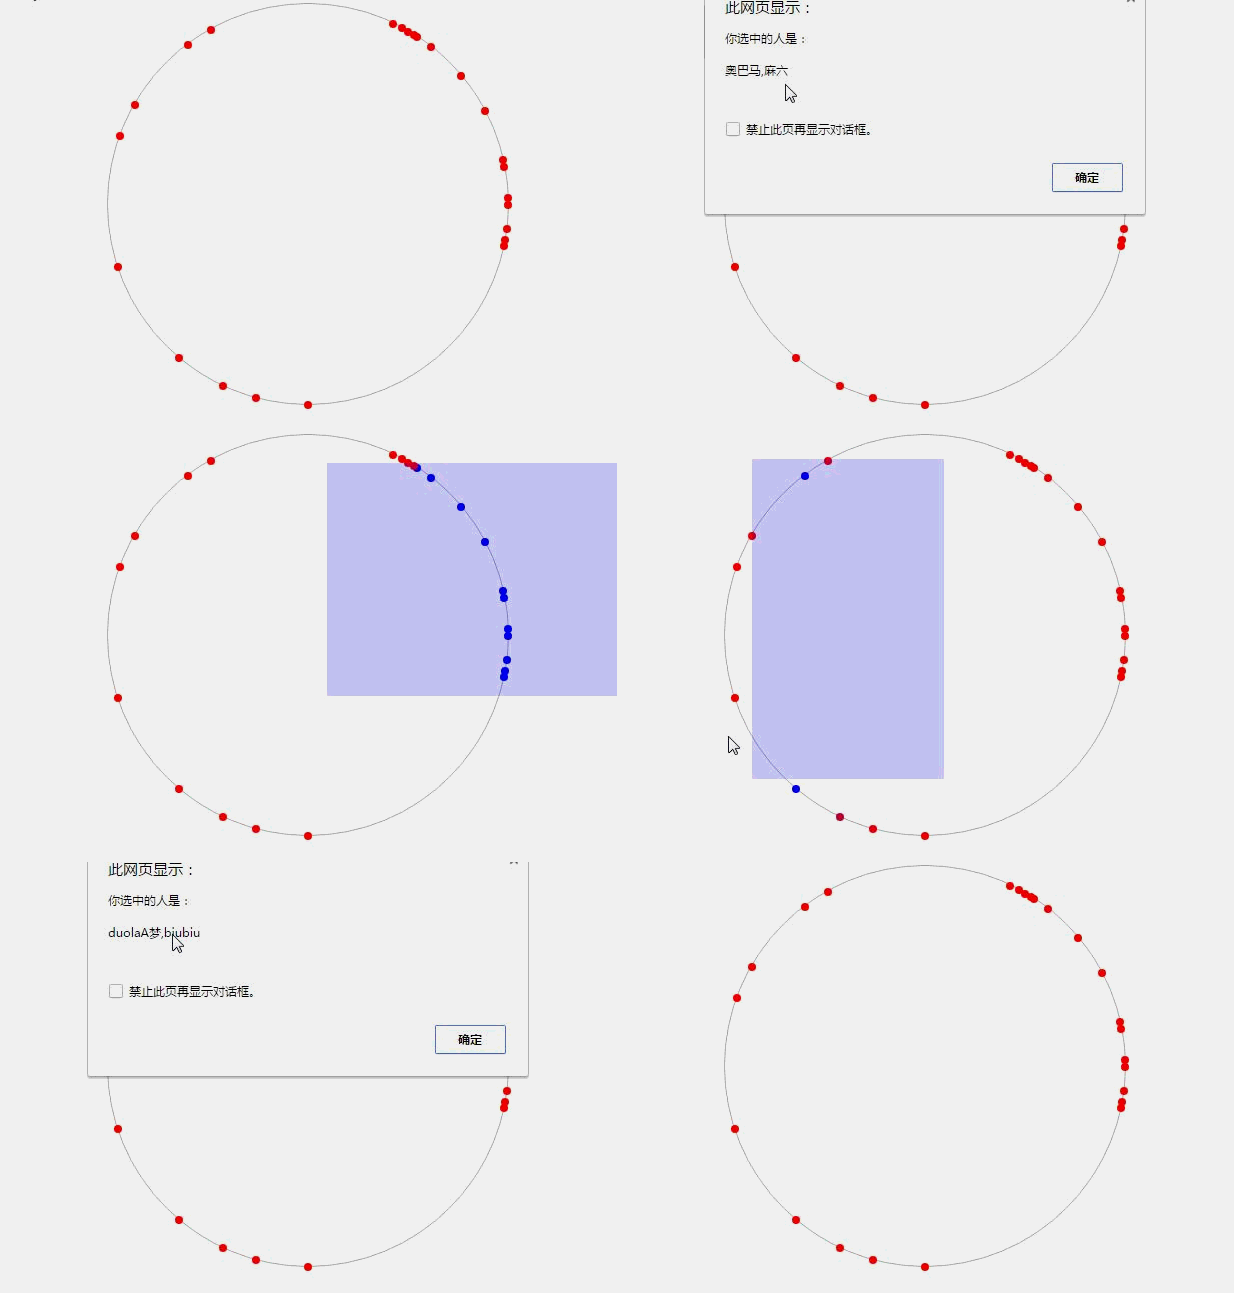
Let's see the final result first.
Figure 1:
Figure II:
This little thing will involve little knowledge points, summed up: js triangular function, CSS3 transform, the calculation of the coordinate axis XY of the mouse... Aha, almost all of these three aspects of knowledge, if you have only known, it doesn't matter, because they only use fur, so don't worry. But if you haven't heard of it at all, please go and learn more about it.
Code area
<!doctype html>
<html>
<head>
    <meta charset="utf-8" />
    <title>Imitation Echarts Chart</title>
    <style>
        * {
            padding:0;
            margin:0;
        }
        #getcharts {
            position:relative;
            width:510px;
            height:510px;

        }
        #wrapcharts {
            list-style:none;
            height:500px;
            width:500px;
            border:2px solid #aaa;
            border-radius:50%;
            position:relative;
            margin:20px auto;
        }
        #wrapcharts li {
            height:10px;
            width:10px;
            diaplay:block;
            position:absolute;
            cursor:pointer;
            left:247px;
            top:2px;
            height:10px;
            width:10px;
            transition:0.2s;
            background:red;
            border-radius:50%;
        }
        #boxshadow {
            position:absolute;
            background:blue;
            opacity:0.2;
            height:0;
            width:0;
            left:0;
            top:0;
        }
    </style>
</head>
<body>

    <ul id="wrapcharts"></ul>
    <div id="boxshadow"></div>

<script>
    /*
     **Simulate the [angle] and the corresponding [name] array from the back end
     **/
    var degArr = [25,88,252,323,33,28,30,90,290,100,300,50,180,205,220,331,195,97,102,77,62,38,32,79];
    var nameArr = ['Underwear Angel','Little Devil','Kim Jong-un','Obama','duolaA dream','Midnight Passion','Liang Jingru','Liu Yifei','Gigi','Big bear','Xiaojing','A baby boy','Zhang San','Li Si','Wang Wu','Ma six','Xiao Ming','Xiao Zhang','Lily','Much','Jin Jin','biubiu','Mr.boluo','Hanson'];
    /*
     **Declare getPos(param) function: Use trigonometric function theorem to get the x, y values of opposite and adjacent edges according to the angle values passed in
     **/
    function getPos(deg)
    {
        var X = Math.sin(deg*Math.PI/180)*250 + 245;
        var Y = -Math.cos(deg*Math.PI/180)*250 + 245;
        return {x:X,y:Y};
    }
    /*
     **Needless to say, get the UL in the page, the li object in ul, and the small box object of any size when the box is selected.
     **/
    var oWrap = document.getElementById('wrapcharts');
    var aLi = oWrap.getElementsByTagName('li');
    var oBox =document.getElementById('boxshadow');
    var allLi = '';
    var posArr = [];
    /*
     **for In the loop, getPos(param) is called to obtain the x and y values corresponding to all angles in the degArr array (that is, the x and y coordinates corresponding to each angle), and then passed into an array to save for easy access.
     **/
    for(var i=0;i<degArr.length; i++)
    {
        posArr.push(getPos(degArr[i]));
    }
    /*
     **for The loop inserts li dots into ul according to the length of the degree array degArr, and inserts the left side of X and Y corresponding to each previous point into the in-line style.
     **/
    for(var i=0; i<degArr.length; i++)
    {
        allLi += '<li style="left:'+posArr[i].x+'px;top:'+posArr[i].y+'px;" title="'+degArr[i]+'°;Full name:'+nameArr[i]+'"></li>';
    }
    oWrap.innerHTML = allLi;
    /*
     **Traversing the li in ul
     **/
    for(var i=0; i<aLi.length; i++)
    {
        aLi[i].index = i;
        /*
         **Encapsulating enlarged events when the mouse moves into each small dot, we use matrix matrix matrix to make things compatible with browsers below ie9, but something seems to be wrong
         */
        function focusOn(_this,color, size)
        {
            _this.style.background = color;
            _this.style.WebkitTransform = 'matrix('+size+', 0, 0, '+size+', 0, 0)';
            _this.style.MozTransform = 'matrix('+size+', 0, 0, '+size+', 0, 0)';
            _this.style.transform = 'matrix('+size+', 0, 0, '+size+', 0, 0)';
            _this.style.filter="progid:DXImageTransform.Microsoft.Matrix( M11= "+size+", M12= 0, M21= 0 , M22="+size+",SizingMethod='auto expend')";
        }
        aLi[i].onmouseover = function()
        {
            //alert(this.offsetLeft);
            _this = this;
            focusOn(_this,'blue', 2);
        }
        aLi[i].onmouseout = function()
        {
            //alert(this.offsetLeft);
            _this = this;
            focusOn(_this,'red', 1);

        }
    }
    /***Box Selection***/
    /*
     **Drag and drop the box to select the code area, which I will not explain, understand what people know at a glance, it is like a formula.
     */
    var allSelect = {};
    document.onmousedown = function(ev)
    {
        var ev = ev || window.event;
        var disX = ev.clientX;
        var disY = ev.clientY;
        var H = W = clientleft = clienttop =  clientright = clientbottom = 0;
        oBox.style.cssText = 'left:'+disX+'px;top:'+disY+'px;';
        //console.log(disX+';'+disY);
        function again(f)
        {
            for(var i=0; i<posArr.length; i++)
            {
                if(posArr[i].x > clientleft && posArr[i].y > clienttop  && (posArr[i].x + 10) < clientright && (posArr[i].y +10) < clientbottom)
                {
                    //console.log(clientleft+';'+ clienttop +';'+ clientright +';' +  clientbottom);
                    if(f){allSelect[i] = i;}else{
                        aLi[i].style.background = 'blue';
                    }
                } else
                {
                    aLi[i].style.background = 'red';
                }
            }

        }

        document.onmousemove = function(ev)
        {
            var ev = ev || window.event;
            /*
             **When the mouse drags in four directions, the direction is judged and the left, top and width, height of the small box are changed accordingly.
             **In fact, I have a problem here, that is, the code repeats a little, I was thinking of merging, but the author is a bit lazy, hey hey, you can also try it.
             **The author won't mind if you take the revision as your release.
             */
            if(ev.clientX > disX && ev.clientY > disY)
            {
                W = ev.clientX - disX;
                H = ev.clientY - disY;

                oBox.style.width = W + 'px';
                oBox.style.height = H + 'px';

                clienttop  = disY-oWrap.offsetTop;
                clientleft = disX-oWrap.offsetLeft;

            }else if(ev.clientX < disX && ev.clientY < disY)
            {
                W = disX - ev.clientX;
                H = disY - ev.clientY;

                oBox.style.top  = ev.clientY + 'px';
                oBox.style.left = ev.clientX + 'px';

                oBox.style.width  = W + 'px';
                oBox.style.height = H + 'px';

                clienttop  = ev.clientY - oWrap.offsetTop;
                clientleft = ev.clientX - oWrap.offsetLeft;

            }else if(ev.clientX > disX && ev.clientY < disY)
            {
                W = ev.clientX - disX;
                H = disY - ev.clientY;

                oBox.style.top  = ev.clientY + 'px';

                oBox.style.width = W + 'px';
                oBox.style.height = H + 'px';

                clienttop  = ev.clientY - oWrap.offsetTop;
                clientleft = disX - oWrap.offsetLeft;

            }else if(ev.clientX < disX && ev.clientY > disY)
            {
                W = disX - ev.clientX;
                H = ev.clientY - disY;

                oBox.style.left = ev.clientX + 'px';

                oBox.style.width  = W + 'px';
                oBox.style.height = H + 'px';

                clienttop  = disY-oWrap.offsetTop;
                clientleft = ev.clientX - oWrap.offsetLeft;
            }


            clientright  = clientleft+ W;
            clientbottom = clienttop + H;

            W = '';
            H = '';

            again();

        }
        document.onmouseup = function()
        {
            again(1);

            document.onmouseup = document.onmousemove = null;
            oBox.style.cssText = 'height:0;width:0;';
            if(JSON.stringify(allSelect) == '{}'){return;}
            console.log(allSelect);

            var lastSelect = [];
            for(var attr in allSelect){
                lastSelect.push(nameArr[attr]);
            }
            allSelect = {};

            console.log(lastSelect);
            alert('The person you choose is:\n\n'+lastSelect+'\n\n');

            for(var i=0; i<aLi.length; i++)
            {
                aLi[i].style.background = 'red';
            }
        }
        return false;
    }
</script>
</body>
</html>
Some Knowledge Points Expansion Will Be Used
Note: When I set up Transform in js, I did not use the scale() method, because I wanted to be compatible with versions below ie9, so I used matrix changes. Of course, you can also change it to scale(), which has no effect.
Matrix function matix(a,b,c,d,e,f) under standard browser and matrix function progid: DXImageTransform. Microsoft. Matrix under ie (M11 = 1, M12 = 0, M21 = 0, M22 = 1, SizingMethod='auto expend')
What they have in common: M11 = a; M12 = c; M21 = b; M22 = D
The difference is that the matrix function under IE has no e and f parameters. In the matrix function, E and F are used for displacement, that is to say, the matrix function can not be used to achieve displacement under ie. [But we don't need displacement here, hey]The initial values of matrix functions a,b,c,d,e,f in standard browsers are matix(1,0,0,1,0,0)
Scaling by matrix:
X-axis zoom: a = XA C = XC e = x*e
Y-axis zoom: B = Yb d = YD f = y*fDisplacement is realized by matrix: [ie no displacement]
x-axis displacement: e = e+x
Y-axis displacement: f = f+yTilt by matrix:
x-axis tilt: c = Math.tan(xDeg/180*Math.PI)
y-axis tilt: b = Math.tan(yDeg/180*Math.PI)Rotation is achieved by matrix:
a = Math.cos(deg/180*Math.PI);
b = Math.sin(deg/180*Math.PI);
c = -Math.sin(deg/180*Math.PI);
d = Math.cos(deg/180*Math.PI);As for trigonometric functions, I will not introduce them. Baidu has a large number of them:
trigonometric function