Graphical K-Means algorithm
This paper introduces a common unsupervised learning algorithm, called K-Means algorithm: K-Means algorithm.
K-Means algorithm is the most basic and important algorithm in unsupervised learning, especially clustering algorithm. It is very simple to implement. Clustering effect is also very good, so it is widely used.
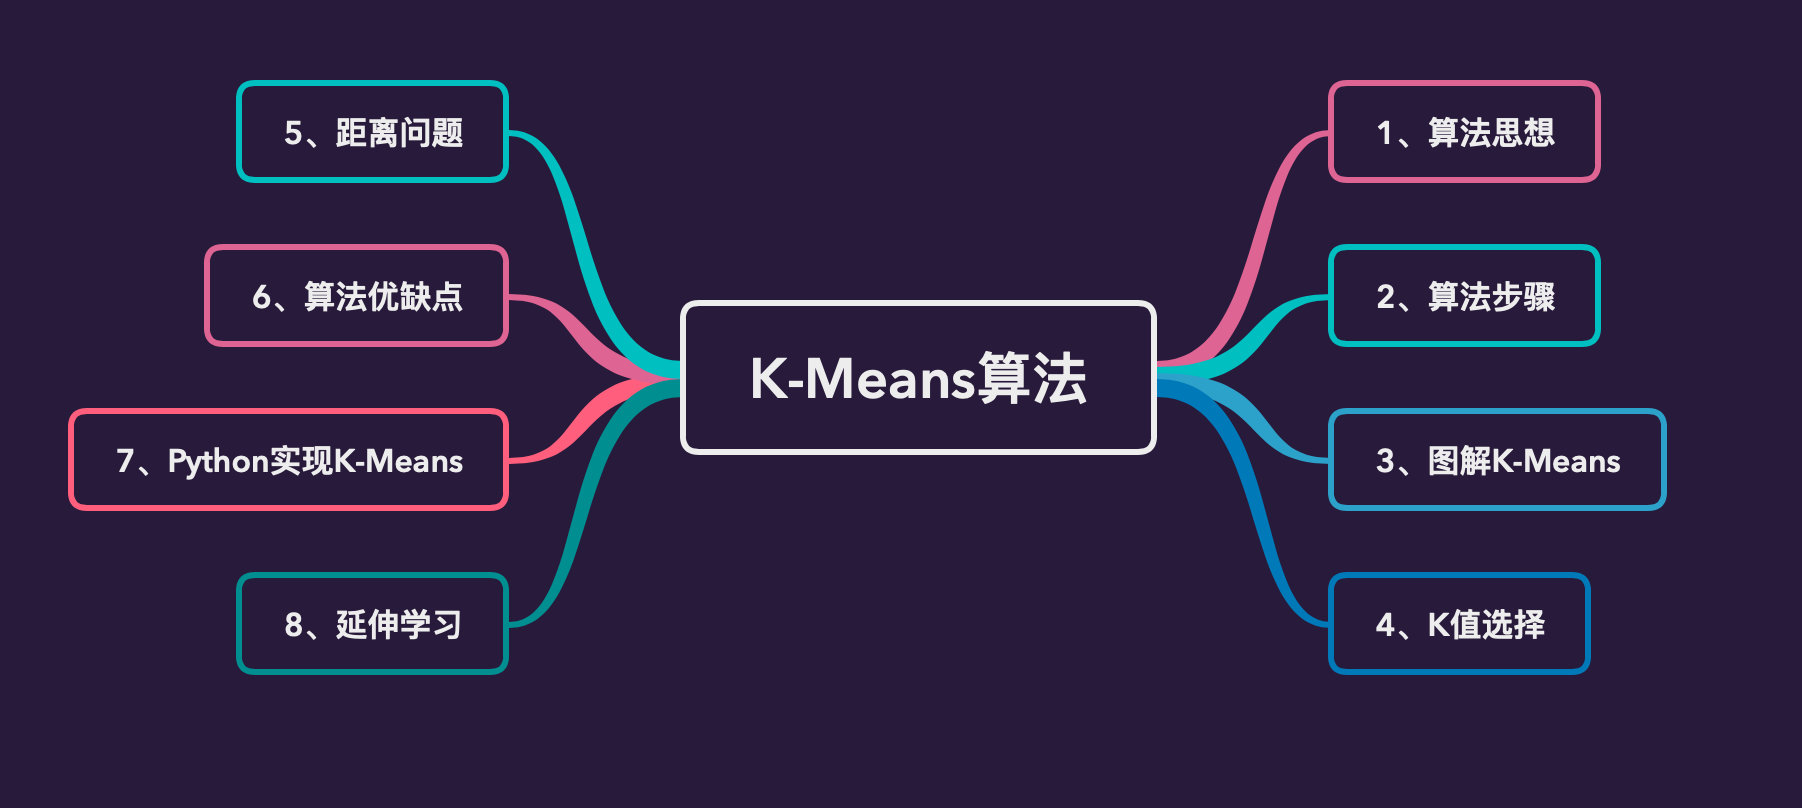
This article will explain in detail from the following 8 aspects:
Algorithmic thought
Unsupervised learning
Before formally introducing the K-Means algorithm, let's explain unsupervised learning. Explain it in a very popular sentence:
Whether it is supervised or not, we only need to see whether the input data has labels
If the input data is labeled, it is supervised learning. For example, KNN algorithm (K-nearest neighbor) is a typical supervised learning algorithm; If there is no label, it is considered as unsupervised learning, such as the K-Means algorithm to be introduced in this paper
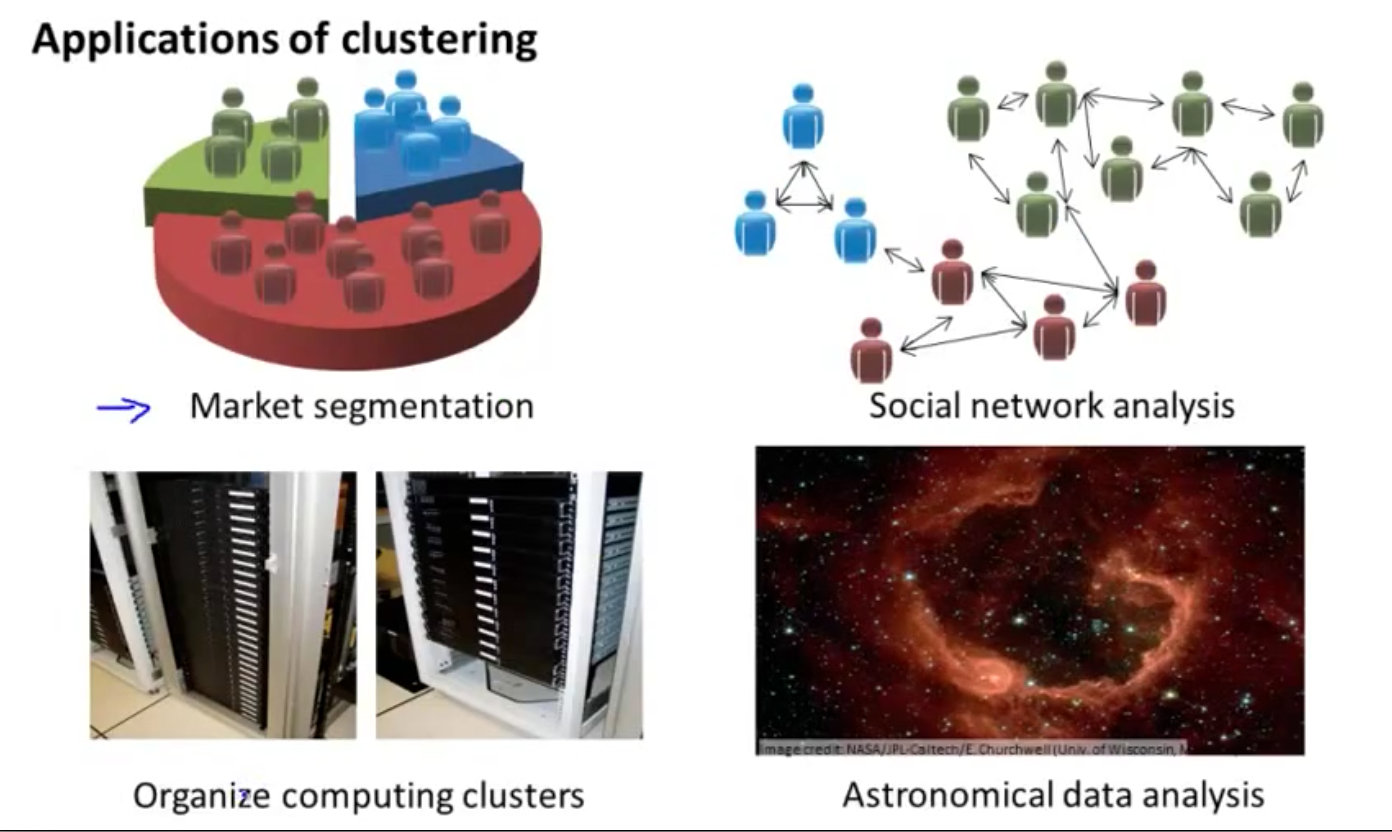
Let's look at the application of unsupervised learning clustering algorithm:
- market segmentation
- Social network analysis
- Organize computer clusters
- Galaxy formation
Algorithmic thought
K-Means clustering algorithm is an iterative clustering analysis algorithm. The idea of the algorithm is: we need to randomly select k objects as the initial cluster center, then calculate the distance between each object and each cluster center, and then assign each object to the nearest cluster center.
Cluster centers and the objects assigned to them represent a cluster. Each time a sample is allocated, the center of the cluster will be recalculated according to the existing objects in the cluster. This process will be repeated until the set termination conditions are met.
Algorithm steps
The specific steps of K-Means algorithm are as follows:
- First, we need to determine a k value (random), that is, we want the data to be clustered to get k different sets
- Randomly select K data points from a given data set as the centroid
- Calculate the distance between each point in the dataset and each centroid (such as Euclidean distance); The data point is divided into the set to which the centroid belongs
- In the first round, after all the data are assigned to the number set, there are K sets, and then recalculate the centroid of each set
- If the distance between the newly calculated centroid and the original centroid is less than a set threshold, it means that the position of the recalculated centroid changes little, and the data tends to be stable as a whole, or the data has converged. In this case, we believe that the clustering effect has reached the desired result, and the algorithm can be terminated.
- On the contrary, if the distance between the new centroid and the original centroid changes greatly, repeat steps 3-5 of iteration until the position changes little and reaches the convergence state.
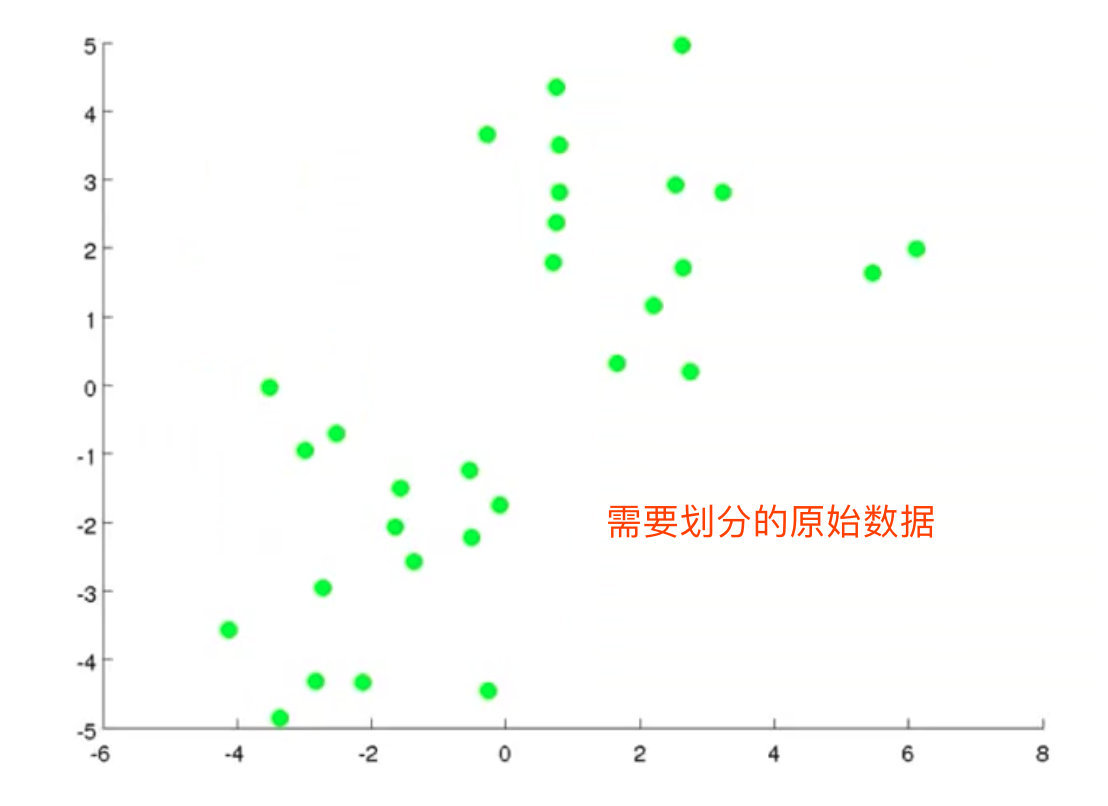
Graphic K-Means
Specific steps
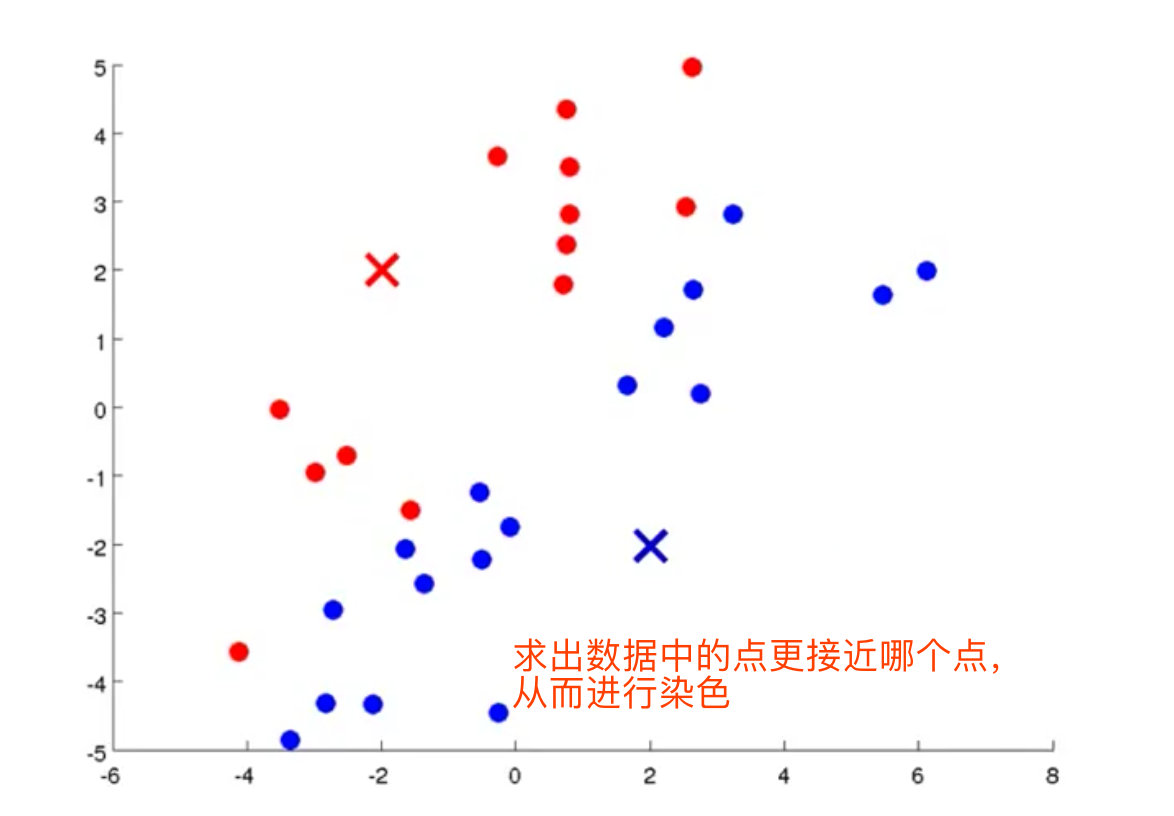
1. Given the data set to be clustered
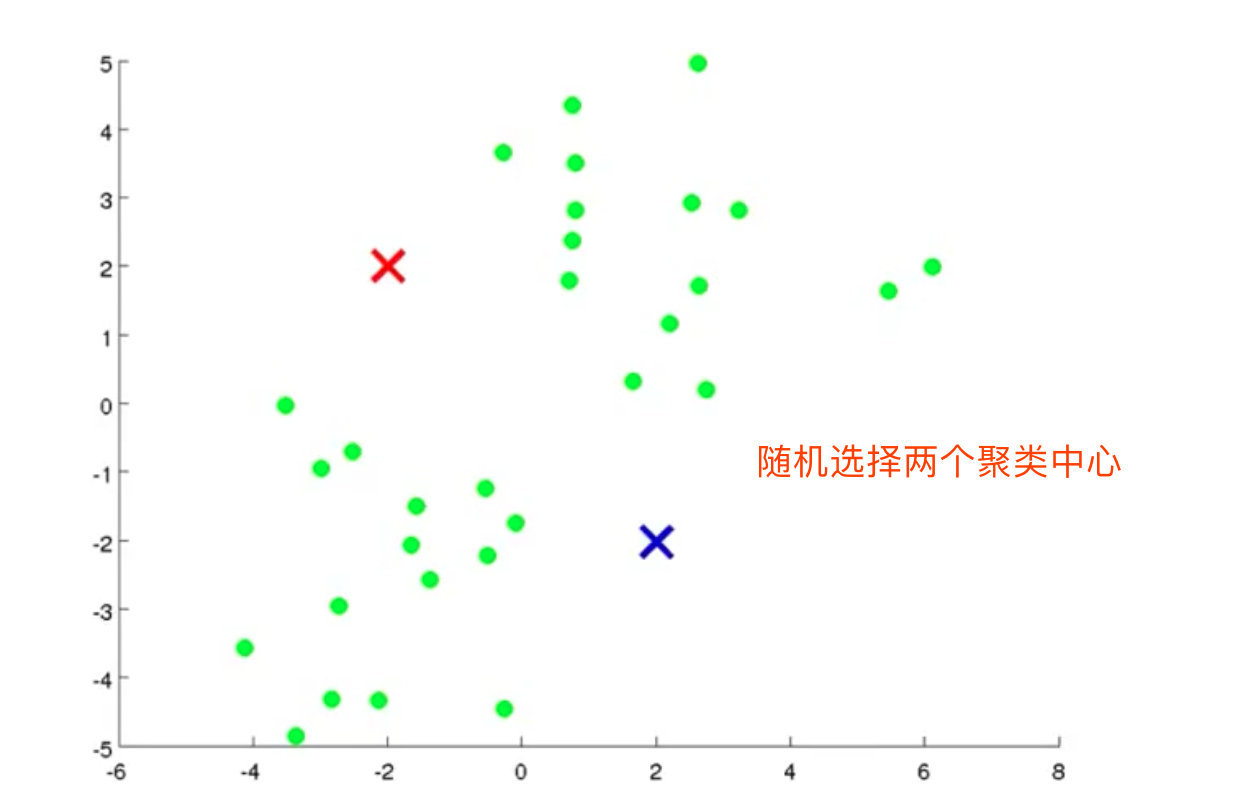
2. Randomly select 2 cluster centers (K=2)
3. Calculate the distance from each data point to the centroid, and divide the data point into the class of the nearest centroid
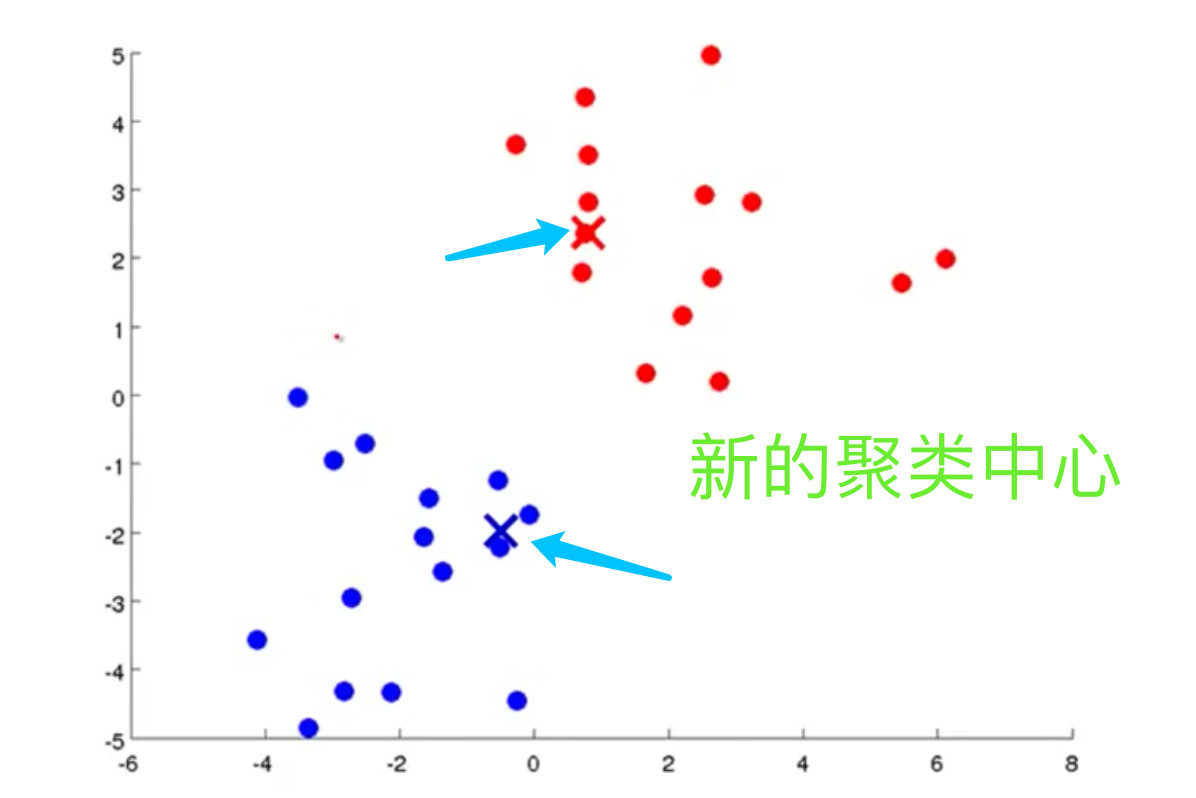
4. Calculate the centroids (mean values of red and blue dots) of the two data sets, and move the cluster center to the mean value to become a new cluster center
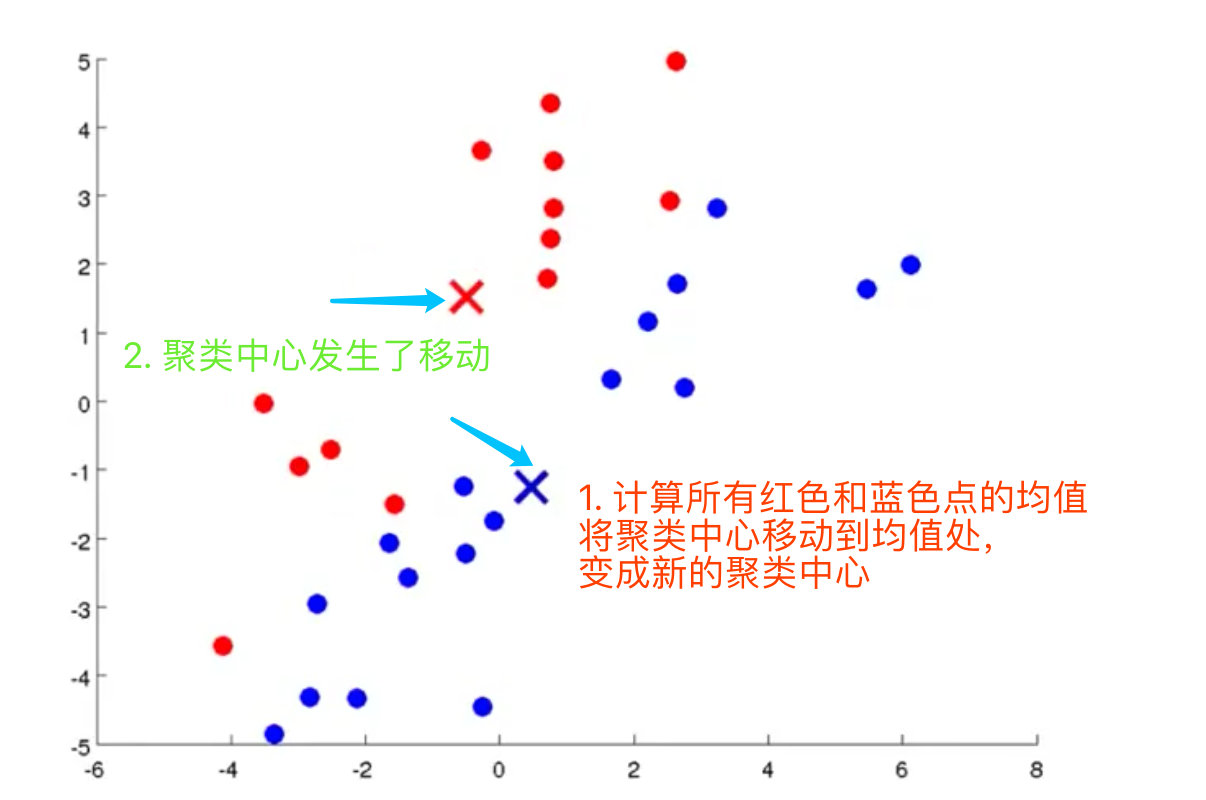
5. Find a new cluster center. If
Complete process
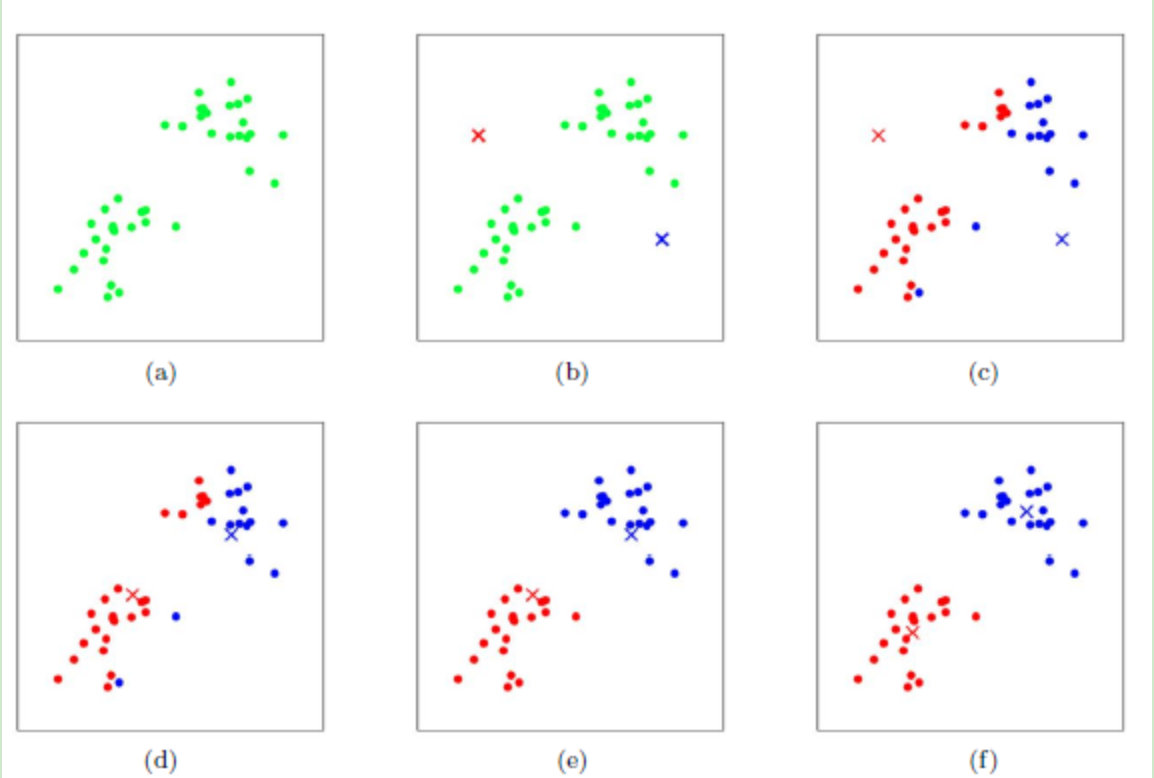
- In the above process, we assume k=2. In Figure b, we randomly select the centroids corresponding to the two classes, that is, the blue and red centroids in the figure
- The distance from each point in the sample to the two centroids is calculated respectively, and the category of each sample is classified into the category of the centroid with the smallest distance from the sample to obtain figure c, that is, the result after the first round of iteration
- We calculate the new centroids of the points currently marked red and blue in the c graph, and get the graph d. at this time, the position of the centroid changes
- Figure e and figure f repeat the process of figure c and figure d, that is, mark the category of all points as the category of the nearest centroid and find a new centroid.
- Generally, the K-Means algorithm needs to run many times to achieve the effect of figure f.
Note: the above graphics are from the screenshot of teacher Wu Enda's explanation in the machine learning video
k value selection
The value of k determines how many clusters we divide the data into. The location selection of k initialized centroids has a great impact on the final clustering results and the running time of the whole large code. Therefore, it is necessary to select the appropriate k centroids
Generally, k value is selected by prior knowledge. If there is no prior knowledge, we can choose an appropriate k value through cross validation.
Distance problem
In machine learning, we often use the following distances:
1. Between two sets x i , x j x_i,x_j xi, xj L p L_p Lp} distance is defined as:
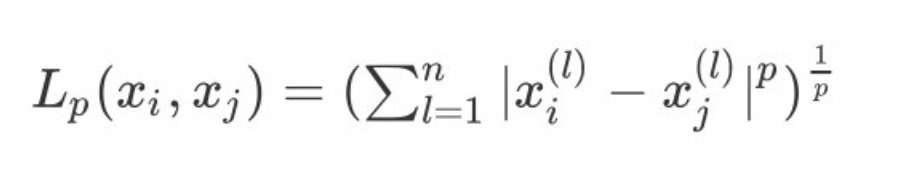
2. When p=1, it is expressed as Manhattan distance:
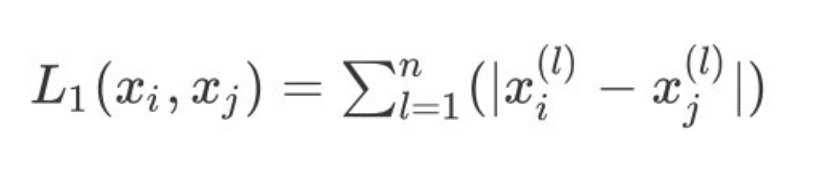
3. When p=2, it is expressed as our commonly used Euclidean distance:
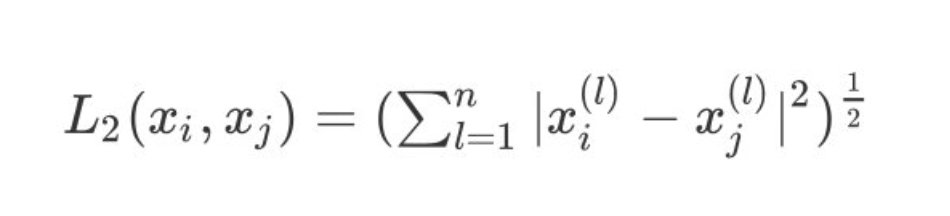
4. When p tends to infinity, it is expressed as Chebyshev distance, which is the maximum value of each coordinate distance:
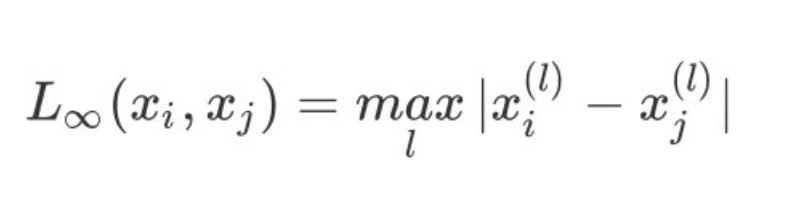
Euclidean distance is generally used in K-Means algorithm
Advantages and disadvantages of the algorithm
advantage
- The principle is very simple, the implementation is also very easy, and the convergence speed of the algorithm is also very fast
- The clustering effect is excellent and the interpretability is strong. When the data finally converges, we can finally see the effect of clustering clearly
- Less constraints. The only parameter to be controlled in the algorithm is the number of clusters k. The best clustering effect can be obtained by continuously adjusting k
shortcoming
- The selection of K value is not easy to grasp. In many cases, the estimation of K value is very difficult, sometimes obtained through cross validation.
- The result of iterative method can only be the local optimal solution, but can not get the global optimal solution.
- Sensitive to noise and outliers. Outliers have a great influence on the determination of centroid. Can be used to detect outliers.
Python implements K-Means
Here is a code for implementing the k-means algorithm using Python:
import numpy as np
import pandas as pd
import random  # Random module
import re
import matplotlib.pyplot as plt


# Import data
def loadDataSet():
  dataset = np.loadtext("user/skl/cluster/dataset.csv")  # Personal file path
  return dataset   # Return dataset

# Drawing function
def show_fig():
  dataset = loadDataSet()   # Import data
  fig = plt.figure()  # Determine canvas
  ax = fig.add_subplot(111)   # A subgraph
  ax.scatter(dataset[:,0], dataset[:,1])  # Incoming drawing data
  plt.show()

# Define Euclidean distance formula
# Euclidean distance formula between two vectors: [(x_1 - x_2)^2 + (y_1 - y_2)^2 + (x_n - y_n)^2]
def calcudistance(vec1,vec2):  # Pass in two vectors
  return np.sqrt(np.sum(np.square(vec1 - vec2)))  # The vectors are subtracted by the square and then summed

# Initialize centroid
def initCentroids(dataset, k):
  # Initialization execution; dataset is the incoming data
  # k: Select the number of classification clusters
  dataset = list(dataset)  # Data listing
  return random.sample(dataset,k)   # Randomly selected k modules

# The distance between each data point and the centroid is calculated and belongs to the category with the smallest distance
def minDisctance(dataset, centroidList):  # Incoming dataset and selected centroid list
  clusterDict = dict()  # Save cluster class results
  k = len(centroidList)  # Length of centroid list: the total number of centroids indicates how many classes are divided into
  for item in dataset:  # Each element in the raw data
    vec1 = item  # Vectors in data
    flag = -1  # Flag bit
    minDis = float("inf")   # Initialize to infinity
    for i in range(k):
      vec2 = centroidList[i]   # Take out the ith centroid
      distcance = calcudistance(vec1, vec2)   # Calculate Euclidean distance
      if distance < minDis:
        minDis = distance  # If the calculated actual distance is less than the initial value of the minimum value, assign the real value distance to the minimum value (update the minimum value)
        flag = i  # At the end of the cycle, the flag saves the cluster tag closest to the current item
    if flag not in clusterDict.keys():
      clusterDict.setdefault(flag,[])
    clusterDict[flag].append(item)  # Add to the corresponding cluster class
  return clusterDict  # Different categories

# Recalculate centroid
def getcentroids(clusterDict):
  # Recalculate k centroids
  centroidList = []   # Centroid empty list
  for key in clusterDict.keys():  #
    centroid = np.mean(clusterDict[key], axis=0)  # Average of existing data points
    centroidList.append(centroid)
  return centroidList  # Get a new center of mass

# Calculated mean square error
def getVar(centroidList, clusterDict):
  # The distance between each vector and the centroid in the cluster class is accumulated and summed
  sum = 0.0  # Initial value
  for key in clusterDict.keys():   # Keys in cluster classes
    vec1 = centroidList[key]   # Take out a center of mass
    distance = 0.0  # Distance initialization value
    for item in clusterDict[key]:  # Key of cluster class
      vec2 = item
      distance += calcudistance(vec1, vec2)  # Find distance
    sum += distance  # accumulation
  return sum

# Show cluster classes
def showCluster(centroidList, clusterDict):
  # Show cluster class results
  color_mark = ["or","ob","og","ok","oy","ow"]
  centroid_mark = ["dr","db","dg","dk","dy","dw"]

  for key in clusterDict.keys():
    plt.plot(centroidList[key][0], centroidList[key][1], centroidMark[key],markersize=12)  # centroid
    for item in clusterDict[key]:
      plt.plot(item[0],item[1],colorMark[key])
  plt.show()

# Main function
def main():
  dataset = loadDataSet()  # Import data
  centroidList = initCentroids(dataset,4)   # Centroid list
  clusterDict = minDistance(dataset, centroidList)   # Dictionary data of cluster class
  newVar = getVar(centroidList, clusterDict)   # New errors are obtained from centroid and cluster data
  oldVar = 1  # When the error of two clustering is less than a certain value, it shows that the centroid is basically stable

  times = 2
  while abs(newVar - oldVar) >= 0.00001:   # When the absolute value of the old and new error is less than a small value
    centroidList = getCentroids(clusterDict)   # Get a list of centroids
    oldVar = newVar  # Assign the new error to the old error
    newVar = getVar(centroidList, clusterDict)   # New error
    times += 1
    showCluster(centroidList, clusterDict)  # Display clustering results


if __name__ == "__main__":
  show_fig()
  main()
Extended learning
The traditional K-Means algorithm has some defects, such as the selection of K value is not easy to grasp and is sensitive to abnormal data. Therefore, many improved clustering algorithms are proposed:
1. K-Means + + (initialization optimization)
The method of randomly initializing centroid in K-Means algorithm is optimized
2. elkan K-Means (distance optimization)
In the traditional K-Means algorithm, we need to calculate the distance from all sample points to the centroid in each iteration, which is very time-consuming.
elkan K-Means algorithm uses the triangular property that the sum of two sides is greater than or equal to the third side and the difference between two sides is less than the third side to reduce the calculation of distance.
3. Mini Batch K-Means algorithm (large sample optimization)
In the traditional K-Means algorithm, the distance from all sample points to all centroids is calculated. In the era of big data, if the sample size is very large, the traditional algorithm will be very time-consuming.
Mini Batch K-Means is to randomly select some samples from the original sample set as traditional K-Means. This can avoid the calculation problem of too large sample size and accelerate the convergence of the algorithm. Of course, the price at this time is that the accuracy of our final clustering will be reduced.
In order to increase the accuracy of the algorithm, we will generally run the Mini Batch K-Means algorithm several times to obtain different random sample sets to obtain clustering clusters, and select the best clustering cluster.
reference material
1. Mr. Li Hang - statistical learning methods
2. Teacher Wu Enda - machine learning video
3. Teacher Liu Jianping - blog: https://www.cnblogs.com/pinard/