Introduction: The adapter interface of MPU9250 is made, and the steering gear is used to drive the rotation measurement module to measure the angle.
Key words: MPU9250, ESP32
§ 01 module interface
In blog Longqiu MPU9250 sensor is tested with ESP32 module ESP32 is used in the preliminary test of MPU9250. In order to facilitate future use, the adapter board of the module is made to convert from the original 8PINs to 4PINs interface.
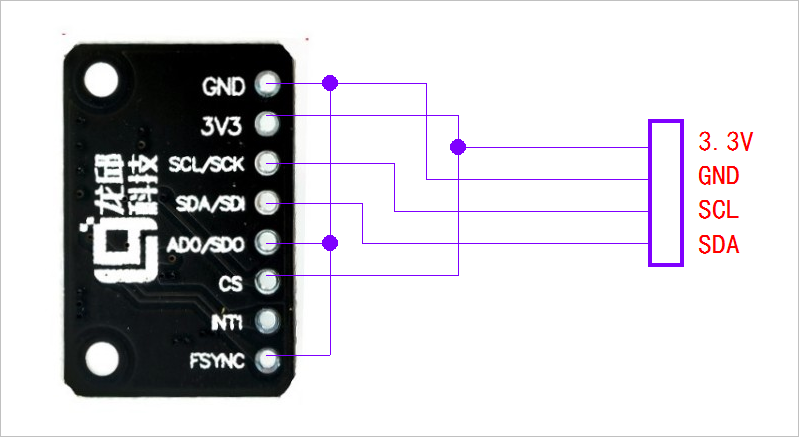
1, Interface definition
the function definition of interface simplification is as shown in the figure below:
2, Circuit making
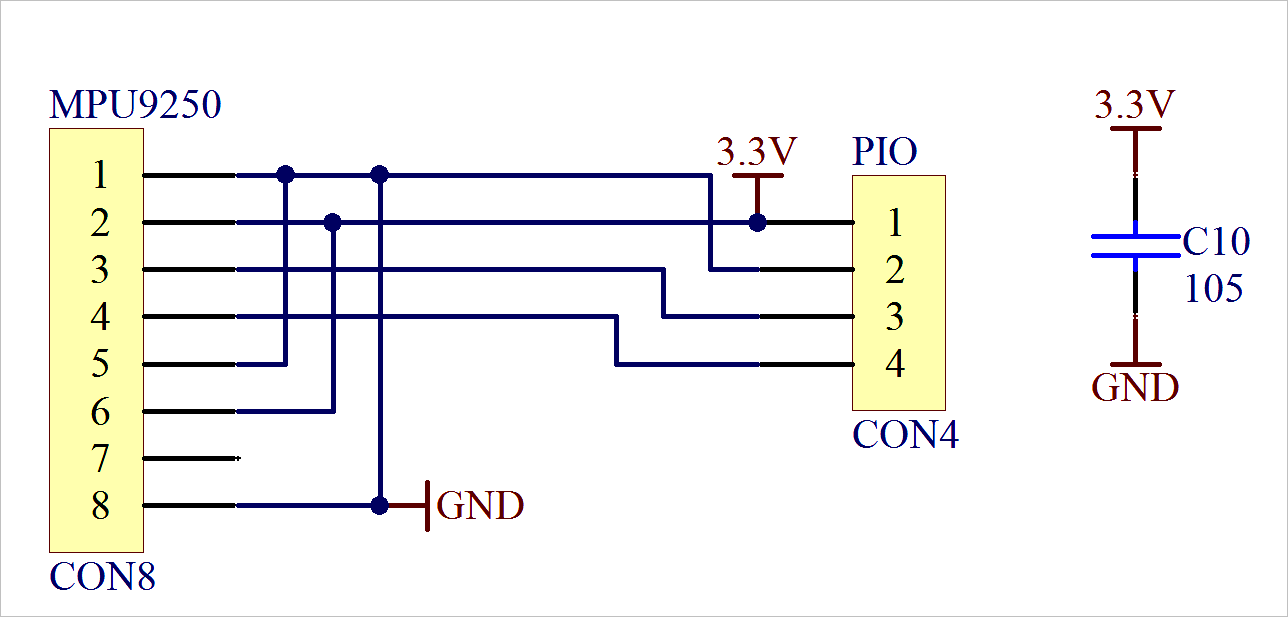
1. Schematic diagram
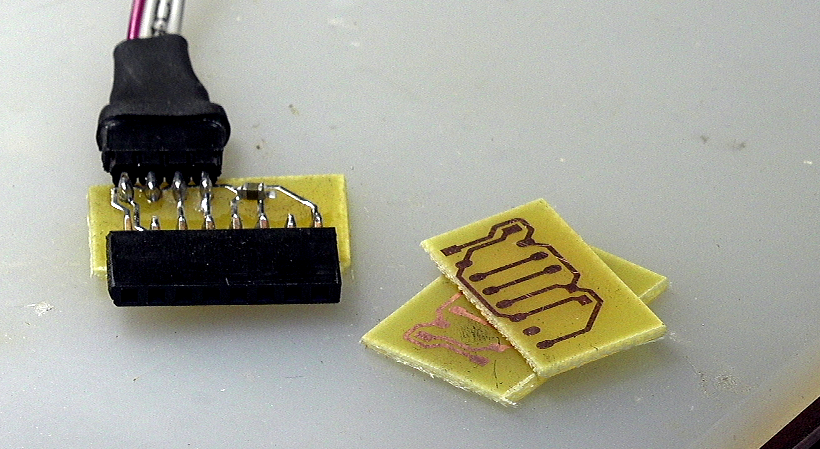
2. Rapid plate making
§ 02 test module
1, Test interface
1. I2C interface
according to Design and implementation of ESP32-S module adapter board Select GPIO2 and GPIO15 as SCL and SDA.
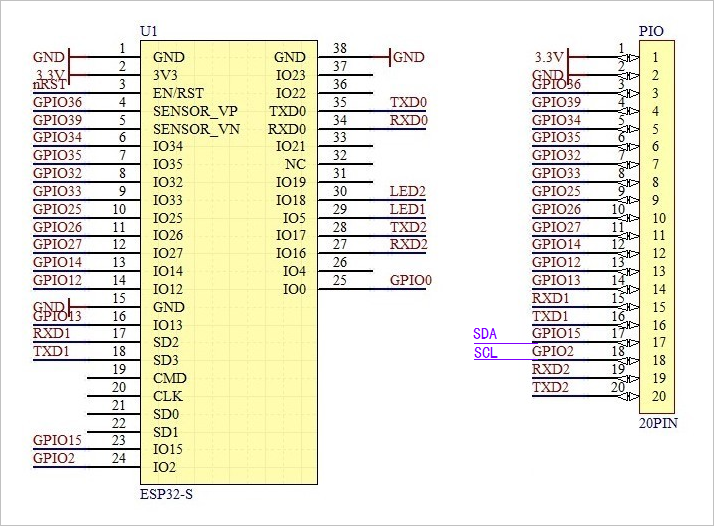
note: it is necessary to apply a 2.2k Ω pull-up resistance to GPIO2 to ensure that its output can be used.
2. Steering gear interface
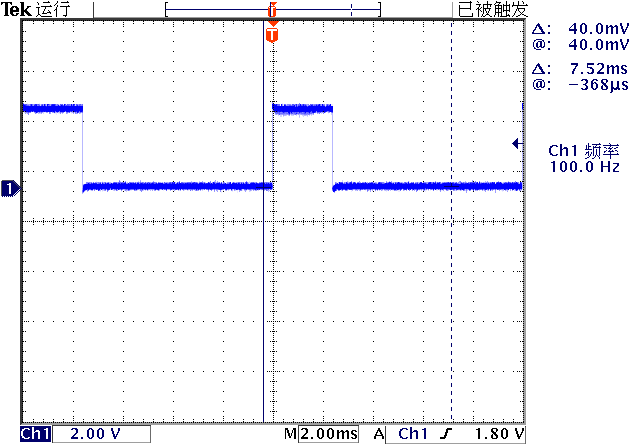
select TXD2 (GPIO2) as the steering gear signal output of 100Hz.
2, Test results
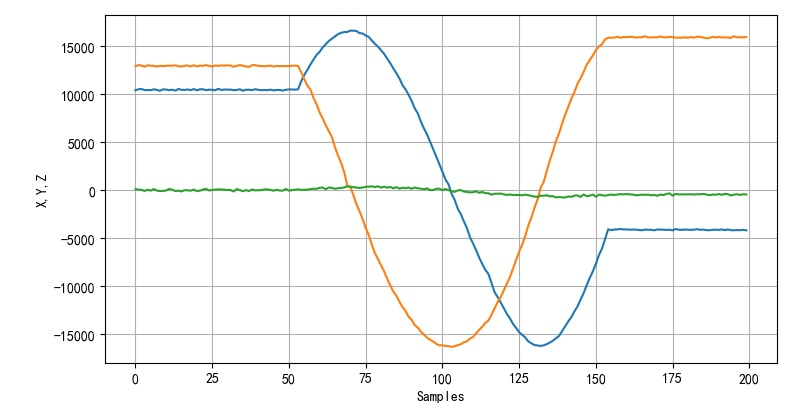
use PWM to control the steering gear to drive MPU9250 to rotate, and measure the values of three acceleration sensors output by MPU9250.
1. Test procedure
(1) Micro Python program
from machine                import Pin,Timer,SoftI2C,PWM
import time
import math

led0 = Pin(5, Pin.OUT)
led1 = Pin(17, Pin.OUT)

pwm = PWM(Pin(13))
pwm.freq(100)
pwm.duty(100)

i2c = SoftI2C(scl=Pin(2), sda=Pin(15), freq=100000)

MPU9250_ADDRESS            = 0x68
MAG_ADDRESS                = 0x0c

GYRO_FULL_SCALE_250_DPS    = 0x00
GYRO_FULL_SCALE_500_DPS    = 0x08
GYRO_FULL_SCALE_1000_DPS   = 0x10
GYRO_FULL_SCALE_2000_DPS   = 0x18

ACC_FULL_SCALE_2_G        = 0x00
ACC_FULL_SCALE_4_G        = 0x08
ACC_FULL_SCALE_8_G        = 0x10
ACC_FULL_SCALE_16_G       = 0x18

def MPU9250Setup():
    i2c.writeto_mem(MPU9250_ADDRESS, 27, bytearray(GYRO_FULL_SCALE_2000_DPS))
                                    # Configure gyroscope range
    i2c.writeto_mem(MPU9250_ADDRESS, 28, bytearray(ACC_FULL_SCALE_16_G))
                                    # Configure accelerometer range
    i2c.writeto_mem(MPU9250_ADDRESS, 0x37, bytearray(0x2))
                                    # Set by pass mode for magnetometer
                                    # Request first magnetometer single measurement

def bytes2short(b):
    a = int.from_bytes(b, 'big', True)
    if a > 0x7fff:
        return -(0x10000 - a)
    else:  return a

def MPU9250read():
    buf = bytearray(14)
    buf = i2c.readfrom_mem(MPU9250_ADDRESS, 0x3b, 14)

    ax = bytes2short(buf[0:2])
    ay = bytes2short(buf[2:4])
    az = bytes2short(buf[4:6])

    gx = bytes2short(buf[8:10])
    gy = bytes2short(buf[10:12])
    gz = bytes2short(buf[12:14])

    temp = bytes2short(buf[6:8])

    return (ax,ay,az),(gx,gy,gz), temp

MPU9250Setup()

axdim = []
aydim = []
azdim = []

step = 1
start = 50

pwm.duty(50)
time.sleep(1)

for i in range(200):
    pwm.duty(start+step*i)
    time.sleep(1)

    readdata = MPU9250read()
    axdim.append(readdata[0][0])
    aydim.append(readdata[0][1])
    azdim.append(readdata[0][2])

    print(readdata[0])

print(axdim)
print(aydim)
print(azdim)

while True:
    pass

while True:
    led0.on()
    led1.off()
    time.sleep_ms(200)
    led0.off()
    led1.on()
    time.sleep_ms(200)

    print(MPU9250read())
(2) Drawing graphics
from headm import *

def thonnycmd(cmd):
    tspsendwindowkey('Thonny', 's', alt=1, noreturn=1)
    tspsendwindowkey('Thonny', '%s'%cmd, noreturn=1)

def thonnyshs(cmd='', wait=0):
    tspsendwindowkey('Thonny', 's', alt=1, noreturn=1)
    if len(cmd) > 0:
        tspsendwindowkey('Thonny', '%s\r'%cmd, noreturn=1)
    if wait > 0:
        time.sleep(wait)
    tspsendwindowkey('Thonny', 'ac', control=1, noreturn=1)
    tspfocuswindow('TEASOFT:1')
    return clipboard.paste()

pastestr = thonnyshs('', 1)
ax = [float(s) for s in pastestr.split('[')[-3].split(']')[0].split(',')]
ay = [float(s) for s in pastestr.split('[')[-2].split(']')[0].split(',')]
az = [float(s) for s in pastestr.split('[')[-1].split(']')[0].split(',')]

printf(ax, ay, az)

plt.plot(ax, label='ax')
plt.plot(ay, label='ay')
plt.plot(az, label='az')

plt.xlabel("Samples")
plt.ylabel("X,Y,Z")
plt.grid(True)
plt.tight_layout()
plt.show()
2. Test results
(1) Data curve
(2) Data analysis
for AX, AY is converted to the corresponding angle.
angle = [math.atan2(y,x)*180/pi for y,x in zip(ay,ax)]
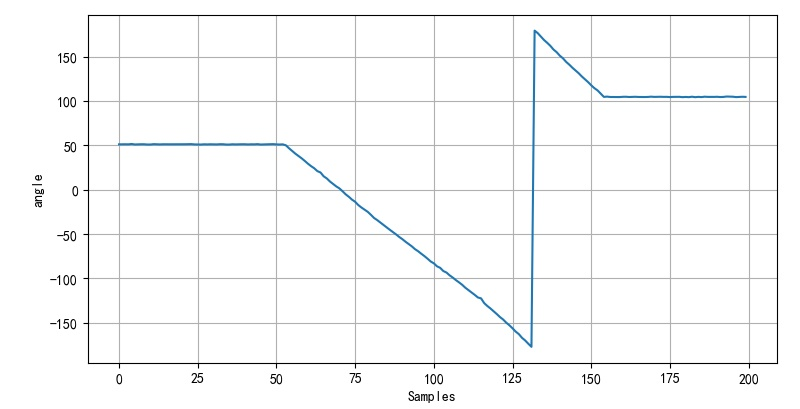
End angle: 104.51
Maximum angle: - 177.11
Minimum angle: 179.21
※ test results ※
the following conclusions can be obtained through the test:
- For large-scale steering gear rotation, the pulse width is set from 1ms to 2ms, and the corresponding angle changes by 307 °.
- The two acceleration values of MPU9250 can be used to calculate the inclination of the module.
■ links to relevant literature:
- Longqiu MPU9250 sensor is tested with ESP32 module
- Design and implementation of ESP32-S module adapter board
● relevant chart links:
- Figure 1.1 interface definition
- Figure 1.2.1 interface schematic diagram
- Figure 1.2.2 rapid plate making
- Figure 2.1.1 ESP32 interface
- Figure 2.1.2 output PWM waveform
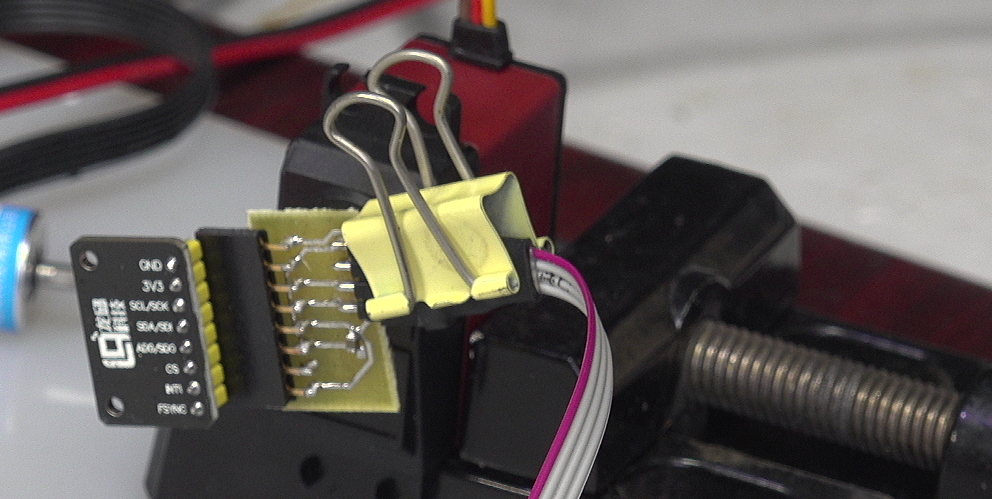
- Figure 2.2.1 test rotating platform
- Figure 2.2.1 collected three acceleration values
- Figure 2.2.2 is converted to different angle values
from headm import *

def thonnycmd(cmd):
    tspsendwindowkey('Thonny', 's', alt=1, noreturn=1)
    tspsendwindowkey('Thonny', '%s'%cmd, noreturn=1)

def thonnyshs(cmd='', wait=0):
    tspsendwindowkey('Thonny', 's', alt=1, noreturn=1)
    if len(cmd) > 0:
        tspsendwindowkey('Thonny', '%s\r'%cmd, noreturn=1)
    if wait > 0:
        time.sleep(wait)
    tspsendwindowkey('Thonny', 'ac', control=1, noreturn=1)
    tspfocuswindow('TEASOFT:1')
    return clipboard.paste()

pastestr = thonnyshs('', 1)
ax = [float(s) for s in pastestr.split('[')[-3].split(']')[0].split(',')]
ay = [float(s) for s in pastestr.split('[')[-2].split(']')[0].split(',')]
az = [float(s) for s in pastestr.split('[')[-1].split(']')[0].split(',')]

tspsave('measure', ax=ax, ay=ay, az=az)

angle = [math.atan2(y,x)*180/pi for y,x in zip(ay,ax)]

printf(ax, ay, az, angle)
printf(angle[0], angle[-1], min(angle), max(angle))

plt.plot(angle, label='angle')

plt.xlabel("Samples")
plt.ylabel("angle")
plt.grid(True)
plt.tight_layout()
plt.show()