Hello, everyone. I'm the laboratory researcher of this issue - Crazy Gong Liang. Today, I will briefly introduce log and link tracking in. NET Core and log collection through link through experiment and complete operation process. Next, let's go to the lab and find out!
Microsoft MVP lab researcher
catalogue
Logs in. NET Core
-
console output
-
Non intrusive logging
-
Microsoft.Extensions.Logging
-
Trace,Debug
Link tracking
-
OpenTracing
-
Context and tracking capabilities
Distributed Link Tracking
-
Tracking in different processes
-
Tracing in ASP.NET Core
-
OpenTracing API and Jaeger
-
Link tracking practice
Log and distributed link tracing in. NET Core
The log recorded by the program generally has two functions: troubleshooting and displaying the running status of the program. When the program fails, we can locate the problem through the log, and the log can leave us the basis for troubleshooting. Many times, it is often thought that logging is very simple. For example, many programmers just use try catch {} to catch exceptions and output them directly to. txt, but these logs often can not help locate problems, and even the logs are full of a lot of junk content; The log content is scanned line by line by the human eye, or Ctrl+F search, which can not review the log efficiently; Logs are simply output to text files, and logs are not well managed.
Next, we will learn the log writing skills step by step, as well as the relevant knowledge of OpenTracing API and Jaeger distributed link tracking.
Logs in. NET Core
console output
The simplest log is console output, using Console.WriteLine() Function outputs information directly.
The following is a simple information output. When the program calls the SayHello function, SayHello will print the information.
    public class Hello
    {
        public void SayHello(string content)
        {
            var str = $"Hello,{content}";
            Console.WriteLine(str);
        }
    }

    class Program
    {
        static void Main(string[] args)
        {
            Hello hello = new Hello();
            hello.SayHello("any one");
            Console.Read();
        }
    }
Non intrusive logging
Through the console, we can see that in order to record the log, we must write the code for inputting the log in the function. We won't talk about the advantages and disadvantages. We can realize aspect programming through the AOP framework and record the log at the same time.
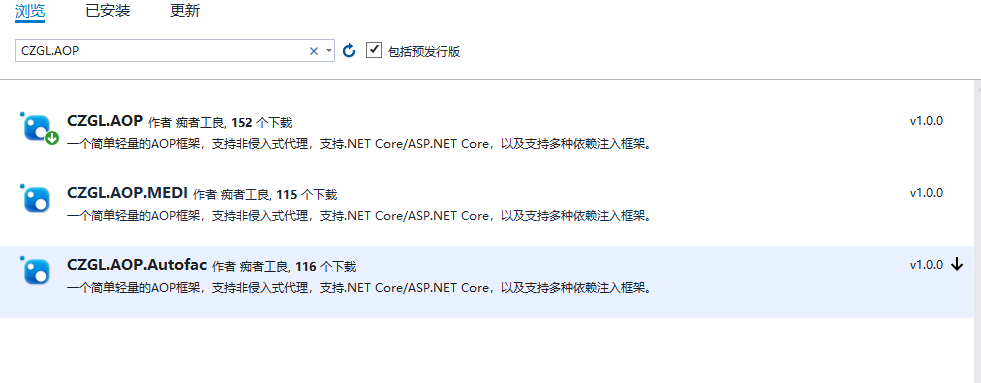
Here you can use the author's open source CZGL.AOP framework, which can be found in Nuget.
Write unified cut in code that will be executed when the function is called.
Before will take effect before the proxy's method is executed or when the proxy's attribute is called. You can obtain and modify the passed parameters through the AspectContext context context.
After takes effect after the method is executed or when the property is called. You can get and modify the return value through the context.
    public class LogAttribute : ActionAttribute
    {
        public override void Before(AspectContext context)
        {
            Console.WriteLine($"{context.MethodInfo.Name} Before the function is executed");
        }

        public override object After(AspectContext context)
        {
            Console.WriteLine($"{context.MethodInfo.Name} After the function is executed");
            return null;
        }
    }
Transform the Hello class with the following code:
 [Interceptor]
    public class Hello
    {
        [Log]
        public virtual void SayHello(string content)
        {
            var str = $"Hello,{content}";
            Console.WriteLine(str);
        }
    }
Then create the proxy type:
        static void Main(string[] args)
        {
            Hello hello = AopInterceptor.CreateProxyOfClass<Hello>();
            hello.SayHello("any one");
            Console.Read();
        }
Start the program and output:
SayHello Before the function is executed
Hello,any one
SayHello After the function is executed
You don't need to worry about the performance problems that the AOP framework will bring to your program, because the CZGL.AOP framework is written by EMIT and has its own cache. When a type is proxied, there is no need to generate it repeatedly.
CZGL.AOP can be used in combination with Autofac through the dependency injection framework of. NET Core to automatically proxy services in CI containers. This eliminates the need for AopInterceptor.CreateProxyOfClass to manually call the proxy interface.
CZGL.AOP code is open source. Please refer to another blog post of the author:
-
https://www.cnblogs.com/whuanle/p/13160139.html
Microsoft.Extensions.Logging
Some companies do not have technical management specifications. Different developers use different logging frameworks. There may be different logging frameworks in one product . txt, NLog, Serilog, etc., and there is no same package.
There are many logging components in the. NET Core, but the popular logging frameworks basically implement Microsoft.Extensions.Logging.abstracts, so we can learn Microsoft.Extensions.Logging. Microsoft.Extensions.Logging.Abstractions is the official abstraction of logging components. If a logging component does not support Microsoft.Extensions.Logging.Abstractions, it is easy to integrate with the project, and it is difficult to modularize and reduce the coupling degree in the future.
The Microsoft.Extensions.Logging package contains logging APIs, which cannot run independently. It is used with one or more logging providers that store or display logs to specific output, such as Console, Debug, TraceListeners.
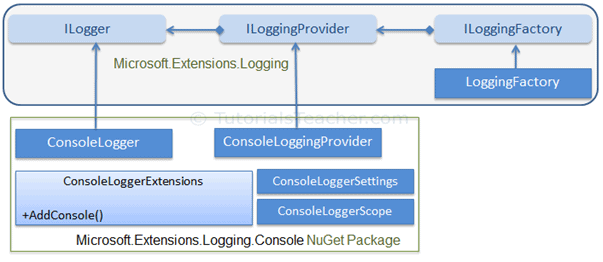
The following figure shows the hierarchy of Loggin API in. NET Core:
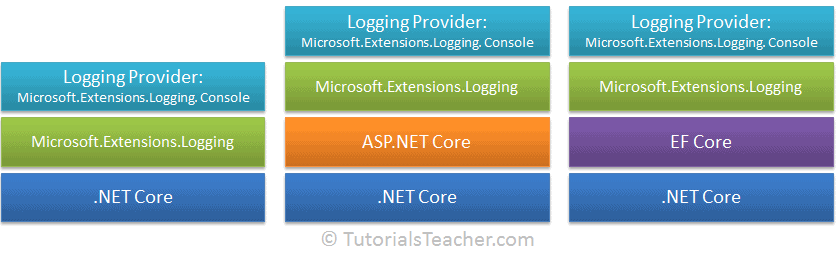
Image source: https://www.tutorialsteacher.com/
To tell you the truth, Microsoft.Extensions.Logging was confused at first, and the configuration felt very complicated. Therefore, it is important to have a clear structure diagram to help you understand the Logging API.
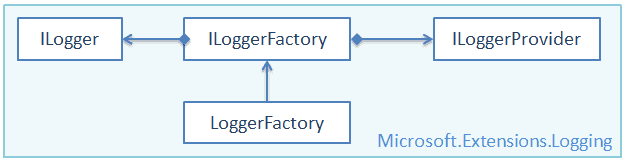
ILoggerFactory
Many standard interfaces in. NET Core practice the idea of factory mode. ILoggerFactory is the interface of factory mode, and LoggerFactory is the implementation of factory mode.
It is defined as follows:
public interface ILoggerFactory : IDisposable{ ILogger CreateLogger(string categoryName); void AddProvider(ILoggerProvider provider);}The function of ILoggerFactory interface is to create an instance of ILogger type, that is, CreateLogger interface.
ILoggerProvider
By implementing the ILoggerProvider interface, you can create your own logging provider to represent the types of ILogger instances that can be created.
It is defined as follows:
public interface ILoggerProvider : IDisposable{ ILogger CreateLogger(string categoryName);}
ILogger
The ILogger interface provides a method for logging to the underlying storage, which is defined as follows:
public interface ILogger{ void Log<TState>(LogLevel logLevel, EventId eventId, TState state, Exception exception, Func<TState, Exception, string> formatter); bool IsEnabled(LogLevel logLevel); IDisposable BeginScope<TState>(TState state);}
Logging Providers
Logging providers are called logging providers.
Logging Providers display or store logs to specific media, such as console, debugging event, event log, trace listener, etc.
Microsoft.Extensions.Logging provides the following types of logging providers, which can be obtained through Nuget.
-
Microsoft.Extensions.Logging.Console
-
Microsoft.Extensions.Logging.AzureAppServices
-
Microsoft.Extensions.Logging.Debug
-
Microsoft.Extensions.Logging.EventLog
-
Microsoft.Extensions.Logging.EventSource
-
Microsoft.Extensions.Logging.TraceSource
The Serilog includes File, Console, Elasticsearch, Debug, MSSqlServer, Email, etc.
There are many log providers, so we don't have to go into them; If a logging component does not provide an implementation compatible with Microsoft.Extensions.Logging, it should not be introduced at all.
In fact, many programs directly File.Write("Log.txt") , Where can the quality of this product be better?
How do you use it?
Earlier, I introduced the composition of Microsoft.Extensions.Logging. Here, I will learn how to use the Logging Provider to input logs.
At least, it only provides a Logging API. Therefore, in order to output logs, we must select an appropriate Logging Provider program. Here we choose
Microsoft.Extensions.Logging.Console, please refer to this package in Nuget.
The following figure is the structure diagram of the combination of Logging Provider and ConsoleLogger:
From the conventional method, the configuration is troublesome:
ConsoleLoggerProvider consoleLoggerProvider = new ConsoleLoggerProvider( new OptionsMonitor<ConsoleLoggerOptions>( new OptionsFactory<ConsoleLoggerOptions>( new IEnumerable<IConfigureOptions<TOptions>(... ... ...))));
We can use factory mode or extension method to quickly configure:
using ILoggerFactory loggerFactory = LoggerFactory.Create(builder => builder.AddSimpleConsole(options => { options.IncludeScopes = true; options.SingleLine = true; options.TimestampFormat = "hh:mm:ss "; }));ILoggerFactory loggerFactory = LoggerFactory.Create(builder => builder.AddConsole());
Of course, other log providers can be added to the factory, for example:
using ILoggerFactory loggerFactory = LoggerFactory.Create(builder => builder.AddSimpleConsole(...) .AddFile(...) .Add()... );
Then get the ILogger instance:
ILogger logger = loggerFactory.CreateLogger<Program>();
Log:
logger.LogInformation("Record information");Log level
In the Logging API, seven logging levels are defined as follows:
public enum LogLevel{ Debug = 1, Verbose = 2, Information = 3, Warning = 4, Error = 5, Critical = 6, None = int.MaxValue}We can output the following levels of logs through the functions in ILogger:
logger.LogInformation("Logging information."); logger.LogCritical("Logging critical information."); logger.LogDebug("Logging debug information."); logger.LogError("Logging error information."); logger.LogTrace("Logging trace"); logger.LogWarning("Logging warning.");About Microsoft.Extensions.Logging will not be repeated here. Readers can learn more about it through the following links:
-
https://docs.microsoft.com/zh-cn/aspnet/core/fundamentals/logging/?view=aspnetcore-5.0#log-exceptions
-
https://www.tutorialsteacher.com/core/fundamentals-of-logging-in-dotnet-core
-
https://docs.microsoft.com/en-us/archive/msdn-magazine/2016/april/essential-net-logging-with-net-core
Trace,Debug
The namespaces of the debug and Trace classes are System.Diagnostics. Debug and Trace provide a set of methods and properties that help debug code.
Readers can refer to another article by the author:
-
https://www.cnblogs.com/whuanle/p/14141213.html#3
Output to console:
Trace.Listeners.Add(new TextWriterTraceListener(Console.Out));Debug.WriteLine("information");Link tracking
Link tracking can help developers quickly locate the performance bottlenecks under the distributed application architecture and improve the development diagnosis efficiency in the era of microservices.
OpenTracing
Trace and Debug mentioned earlier are APIs provided to developers in. NET Core for diagnosing programs and outputting information, while trace mentioned later only refers to link trace in OpenTracing API.
Ordinary logging has a big disadvantage, that is, each method records a log. We can't connect multiple methods called in a process. When a method has an exception, it is difficult to know which task process has the exception. We can only see which method has an error and has its caller.
In OpenTracing, Trace is a directed acyclic graph with Span. A Span represents the logical representation of completing some work in the application. Each Span has the following properties:
-
Operation name
-
start time
-
End time
To find out what Trace and Span are and what OpenTracing is, please introduce OpenTracing in Nuget.
Write the Hello class as follows:
    public class Hello
    {
        private readonly ITracer _tracer;
        private readonly ILogger<Hello> _logger;
        public Hello(ITracer tracer, ILoggerFactory loggerFactory)
        {
            _tracer = tracer;
            _logger = loggerFactory.CreateLogger<Hello>();
        }

        public void SayHello(string content)
        {
            // Create a Span and start
            var spanBuilder = _tracer.BuildSpan("say-hello");
            // -------------------------------
            var span = spanBuilder.Start(); // |
            var str = $"Hello,{content}";   // |
            _logger.LogInformation(str);    // |
            span.Finish();                  // |
            // ---------------------------------
        }
    }
Start the program and start tracking:
        static void Main(string[] args)
        {
            using ILoggerFactory loggerFactory = LoggerFactory.Create(builder => builder.AddConsole());

            Hello hello = new Hello(GlobalTracer.Instance, loggerFactory);
            hello.SayHello("This trace");
            Console.Read();
        }
In the above process, we used the OpenTracing API. The following is a description of some elements in the code:
-
ITracer is a link tracking instance, and BuildSpan() can create one of the spans;
-
Each ISpan has an operation name, such as say hello;
-
Using Start() Start a Span; Use Finish() End a Span;
-
The tracker will automatically record the time stamp;
Of course, when we run the above program, there is no other information and UI interface, because GlobalTracer.Instance will return a Tracer without operation. When we define a Tracer, we can observe the process of link tracking.
In Nuget, Jaeger is introduced.
In Program, add a static function that returns a custom Tracer:
private static Tracer InitTracer(string serviceName, ILoggerFactory loggerFactory)
{
    var samplerConfiguration = new Configuration.SamplerConfiguration(loggerFactory)
        .WithType(ConstSampler.Type)
        .WithParam(1);

    var reporterConfiguration = new Configuration.ReporterConfiguration(loggerFactory)
        .WithLogSpans(true);

    return (Tracer)new Configuration(serviceName, loggerFactory)
        .WithSampler(samplerConfiguration)
        .WithReporter(reporterConfiguration)
        .GetTracer();
}
Modify the Main function as follows:
        static void Main(string[] args)
        {
            using ILoggerFactory loggerFactory = LoggerFactory.Create(builder => builder.AddConsole());
            var tracer = InitTracer("hello-world", loggerFactory);
            Hello hello = new Hello(tracer, loggerFactory);
            hello.SayHello("This trace");
            Console.Read();
        }
Full code:
-
https://gist.github.com/whuanle/b57fe79c9996988db0a9b812f403f00e
Context and tracking capabilities
However, it is very unfriendly to output string directly from the log. At this time, we need structured log.
Of course, ISpan provides a method for structured logging. We can write a method to format the log.
Track individual functions
Add the following code to the Hello class:
private string FormatString(ISpan rootSpan, string helloTo){ var span = _tracer.BuildSpan("format-string").Start(); try { var helloString = $"Hello, {helloTo}!"; span.Log(new Dictionary<string, object> { [LogFields.Event] = "string.Format", ["value"] = helloString }); return helloString; } finally { span.Finish(); }}In addition, we can also encapsulate a function that outputs string information:
private void PrintHello(ISpan rootSpan, string helloString){ var span = _tracer.BuildSpan("print-hello").Start(); try { _logger.LogInformation(helloString); span.Log("WriteLine"); } finally { span.Finish(); }}Change the SayHello method to:
public void SayHello(string content) { var spanBuilder = _tracer.BuildSpan("say-hello"); var span = spanBuilder.Start(); var str = FormatString(span, content); PrintHello(span,str); span.Finish(); }The reason for changing the above code is not to mix too much code in one method. You can try to reuse some code and encapsulate a unified code.
However, originally, we only need to call SayHello, where one method will continue to call the other two methods. It was originally a Span, but finally it became three spans.
info: Jaeger.Configuration[0]
info: Jaeger.Reporters.LoggingReporter[0]
      Span reported: 77f1a24676a3ffe1:77f1a24676a3ffe1:0000000000000000:1 - format-string
info: ConsoleApp1.Hello[0]
      Hello, This trace!
info: Jaeger.Reporters.LoggingReporter[0]
      Span reported: cebd31b028a27882:cebd31b028a27882:0000000000000000:1 - print-hello
info: Jaeger.Reporters.LoggingReporter[0]
      Span reported: 44d89e11c8ef51d6:44d89e11c8ef51d6:0000000000000000:1 - say-hello
Note: 0000000000000000 Indicates that a Span has ended.
Advantages: from the code point of view, sayhello - > formastring, sayhello - > printhello, we can clearly know the calling link;
Disadvantages: judging from the output, Span reported is different, so we cannot judge the causal relationship of the three functions;
We can't stare at the code all the time, and the operation and maintenance personnel and implementation personnel can't compare and find the code logic with the code.
Combine multiple spans into one track
ITracer is responsible for creating link tracing, so ITracer also provides an API for combining multiple Span causalities.
The method of use is as follows:
var rootSapn = _tracer.BuildSpan("say-hello"); // Avar span = _tracer.BuildSpan("format-string").AsChildOf(rootSpan).Start(); // B// A -> BWe create a rootSpan, and then create a sapn that continues the rootSpan, rootSpan - > span.
info: Jaeger.Reporters.LoggingReporter[0]
      Span reported: 2f2c7b36f4f6b0b9:3dab62151c641380:2f2c7b36f4f6b0b9:1 - format-string
info: ConsoleApp1.Hello[0]
      Hello, This trace!
info: Jaeger.Reporters.LoggingReporter[0]
      Span reported: 2f2c7b36f4f6b0b9:9824227a41539786:2f2c7b36f4f6b0b9:1 - print-hello
info: Jaeger.Reporters.LoggingReporter[0]
      Span reported: 2f2c7b36f4f6b0b9:2f2c7b36f4f6b0b9:0000000000000000:1 - say-hello
Span reported: 2f2c7b36f4f6b0b9
The output order is the order of execution completion, and say hello is the last execution completion.
Context in propagation
From what code, we found that the code is troublesome because:
-
Pass the Span object as the first parameter to each function;
-
Add lengthy to each function try-finally{} Ensure that the Span can be completed
To this end, OpenTracing API provides a better method. We can avoid passing Span as a parameter to the code and call it by ourselves_ Just trace.
Modify the FormatString and PrintHello codes as follows:
    private string FormatString(string helloTo)
    {
        using var scope = _tracer.BuildSpan("format-string").StartActive(true);
        var helloString = $"Hello, {helloTo}!";
        scope.Span.Log(new Dictionary<string, object>
        {
            [LogFields.Event] = "string.Format",
            ["value"] = helloString
        });
        return helloString;
    }

    private void PrintHello(string helloString)
    {
        using var scope = _tracer.BuildSpan("print-hello").StartActive(true);
        _logger.LogInformation(helloString);
        scope.Span.Log(new Dictionary<string, object>
        {
            [LogFields.Event] = "WriteLine"
        });
    }
Modify the SayHello code as follows:
public void SayHello(string helloTo){ using var scope = _tracer.BuildSpan("say-hello").StartActive(true); scope.Span.SetTag("hello-to", helloTo); var helloString = FormatString(helloTo); PrintHello(helloString);}Through the above code, we get rid of the annoying code.
-
StartActive() Instead of Start(), span is "active" by storing it in the thread local storage;
-
StartActive() Returns an IScope object instead of an ISpan object. IScope is the container of the current active scope. By accessing the activity span scope.Span, once the scope is closed, the previous scope will become the current scope, so as to reactivate the previous activity scope in the current thread;
-
IScope inherits IDisposable, which enables us to use the using syntax;
-
StartActive(true) tells Scope that once it is processed, it should complete the Scope it represents;
-
StartActive() automatically creates ChildOf's reference to the previous activity scope, so we don't have to explicitly use the builder method with AsChildOf();
If you run this program, we will see that all three report spans have the same trace ID.
Distributed Link Tracking
Tracking in different processes
Microservices deploy multiple programs separately, and each program provides different functions. Earlier, we have learned OpenTracing link tracking. Next, we will split the code. The console program will no longer provide the implementation of the FormatString function. We use a Web program to implement the FormatString service.
Create an ASP.NET Core application and select the template with view model controller in the template.
Add a FormatController in the Controllers directory with the following code:
using Microsoft.AspNetCore.Mvc;

namespace WebApplication1.Controllers
{
    [Route("api/[controller]")]
    public class FormatController : Controller
    {
        [HttpGet]
        public string Get()
        {
            return "Hello!";
        }

        [HttpGet("{helloTo}", Name = "GetFormat")]
        public string Get(string helloTo)
        {
            var formattedHelloString = $"Hello, {helloTo}!";
            return formattedHelloString;
        }
    }
}
Web application will be one of the micro services, and this service has only one API. This API is very simple, that is, it provides string formatting. You can also write other APIs to provide services.
Change the CreateHostBuilder of the Program to fix the port of this service.
public static IHostBuilder CreateHostBuilder(string[] args) => Host.CreateDefaultBuilder(args) .ConfigureWebHostDefaults(webBuilder => { webBuilder.UseUrls("http://*:8081"); webBuilder.UseStartup<Startup>(); });Then go to Startup and delete app. Usehttpsredirect();.
Modify the code of the previous console program and change the FormatString method to:
private string FormatString(string helloTo) { using (var scope = _tracer.BuildSpan("format-string").StartActive(true)) { using WebClient webClient = new WebClient(); var url = $"http://localhost:8081/api/format/{helloTo}"; var helloString = webClient.DownloadString(url); scope.Span.Log(new Dictionary<string, object> { [LogFields.Event] = "string.Format", ["value"] = helloString }); return helloString; } }After starting the Web program, start the console program.
Console program output:
info: Jaeger.Reporters.LoggingReporter[0]
      Span reported: c587bd888e8f1c19:2e3273568e6e373b:c587bd888e8f1c19:1 - format-string
info: ConsoleApp1.Hello[0]
      Hello, This trace!
info: Jaeger.Reporters.LoggingReporter[0]
      Span reported: c587bd888e8f1c19:f0416a0130d58924:c587bd888e8f1c19:1 - print-hello
info: Jaeger.Reporters.LoggingReporter[0]
      Span reported: c587bd888e8f1c19:c587bd888e8f1c19:0000000000000000:1 - say-hello
Next, we can change the formatting to:
  private string FormatString(string helloTo)
        {
            using (var scope = _tracer.BuildSpan("format-string").StartActive(true))
            {
                using WebClient webClient = new WebClient();
                var url = $"http://localhost:8081/api/format/{helloTo}";
                var helloString = webClient.DownloadString(url);
                var span = scope.Span
                    .SetTag(Tags.SpanKind, Tags.SpanKindClient)
                    .SetTag(Tags.HttpMethod, "GET")
                    .SetTag(Tags.HttpUrl, url);

                var dictionary = new Dictionary<string, string>();
                _tracer.Inject(span.Context, BuiltinFormats.HttpHeaders, new TextMapInjectAdapter(dictionary));
                foreach (var entry in dictionary)
                    webClient.Headers.Add(entry.Key, entry.Value);
                return helloString;
            }
        }
SetTag can set a tag. We set a tag for the Span requested to the Web and store the requested URL.
var span = scope.Span .SetTag(Tags.SpanKind, Tags.SpanKindClient) .SetTag(Tags.HttpMethod, "GET") .SetTag(Tags.HttpUrl, url);
Inject context information through inject.
_tracer.Inject(span.Context, BuiltinFormats.HttpHeaders, new TextMapInjectAdapter(dictionary));
These configuration specifications can be found in https://github.com/opentracing/specification/blob/master/semantic_conventions.md.
Tracing in ASP.NET Core
In the above, we have implemented the tracking of the Client in different processes, but we have not implemented the tracking in the Server. We can modify the code in Startup.cs and replace the following code:
using Jaeger;
using Jaeger.Samplers;
using Microsoft.AspNetCore.Builder;
using Microsoft.Extensions.Configuration;
using Microsoft.Extensions.DependencyInjection;
using Microsoft.Extensions.Logging;
using OpenTracing.Util;
using System;

namespace WebApplication1
{
    public class Startup
    {
        private static readonly ILoggerFactory loggerFactory = LoggerFactory.Create(builder => builder.AddConsole());
        private static readonly Lazy<Tracer> Tracer = new Lazy<Tracer>(() =>
        {
            return InitTracer("webService", loggerFactory);
        });
        private static Tracer InitTracer(string serviceName, ILoggerFactory loggerFactory)
        {
            var samplerConfiguration = new Configuration.SamplerConfiguration(loggerFactory)
                .WithType(ConstSampler.Type)
                .WithParam(1);

            var reporterConfiguration = new Configuration.ReporterConfiguration(loggerFactory)
                .WithLogSpans(true);

            return (Tracer)new Configuration(serviceName, loggerFactory)
                .WithSampler(samplerConfiguration)
                .WithReporter(reporterConfiguration)
                .GetTracer();
        }
        public Startup(IConfiguration configuration)
        {
            Configuration = configuration;
        }

        public IConfiguration Configuration { get; }

        // This method gets called by the runtime. Use this method to add services to the container.
        public void ConfigureServices(IServiceCollection services)
        {
            services.AddMvc();

            GlobalTracer.Register(Tracer.Value);
            services.AddOpenTracing();
        }

        // This method gets called by the runtime. Use this method to configure the HTTP request pipeline.
        public void Configure(IApplicationBuilder app)
        {
            app.UseRouting();
            app.UseEndpoints(endpoints =>
            {
                endpoints.MapControllerRoute(
                    name: "default",
                    pattern: "{controller=Home}/{action=Index}/{id?}");
            });
        }
    }
}
In this way, different processes can be tracked.
OpenTracing API and Jaeger
OpenTracing is an open distributed tracing specification. The OpenTracing API is a consistent, expressive, vendor independent API for distributed tracing and context propagation.
Jaeger is an open source distributed tracking system of Uber.
OpenTracing client libraries and specifications can be viewed in Github: https://github.com/opentracing/
For detailed introduction, you can consult the information by yourself.
Here, we need to deploy a Jaeger instance for microservices and transaction tracking learning.
Using Docker for deployment is simple. You only need to execute the following command:
docker run -d -p 5775:5775/udp -p 16686:16686 -p 14250:14250 -p 14268:14268 jaegertracing/all-in-one:latest
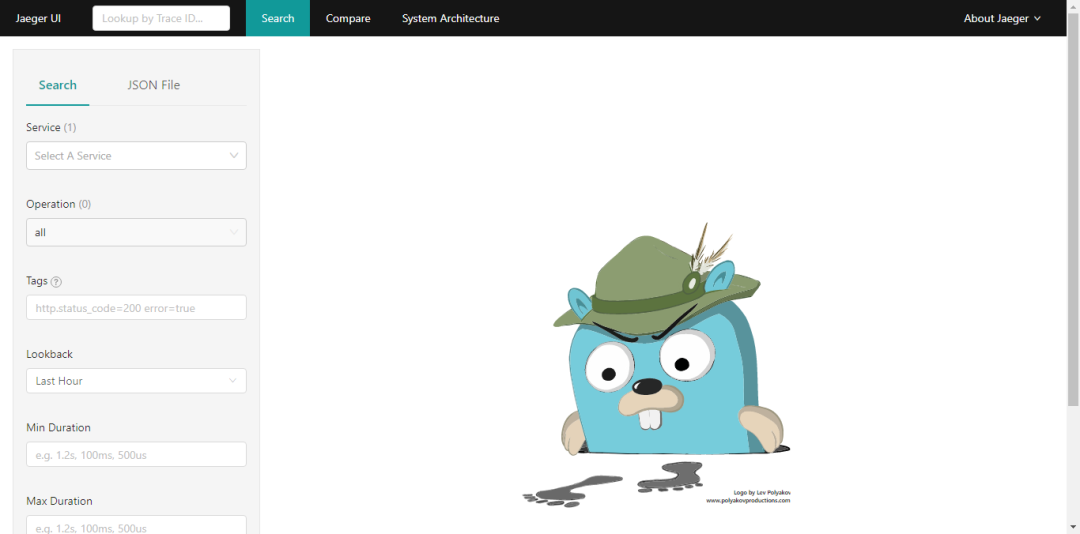
Visit port 16686 to see the UI interface.
Jaeger's port functions are as follows:
Collector14250 tcp gRPC send out proto Format data 14268 http Directly accept client data 14269 http health examination Query16686 http jaeger of UI Front end 16687 http health examination
Next, we will learn how to upload data to Jaeger through code.
Link tracking practice
Note that if the data is uploaded to Jaeger, it is Span, and the log content will not be uploaded.
Continue to use the above console program and add Jaeger.Senders.Grpc package to Nuget.
We can upload data to Jaeger through UDP (port 6831) and gRPC (port 14250). Here we use gRPC.
Modify the InitTracer method of the console program, and its code is as follows:
private static Tracer InitTracer(string serviceName, ILoggerFactory loggerFactory)
{
Configuration.SenderConfiguration.DefaultSenderResolver = new SenderResolver(loggerFactory)
.RegisterSenderFactory<GrpcSenderFactory>();
var reporter = new RemoteReporter.Builder()
.WithLoggerFactory(loggerFactory)
.WithSender(new GrpcSender("180.102.130.181:14250", null, 0))
.Build();
var tracer = new Tracer.Builder(serviceName)
.WithLoggerFactory(loggerFactory)
.WithSampler(new ConstSampler(true))
.WithReporter(reporter);
return tracer.Build();
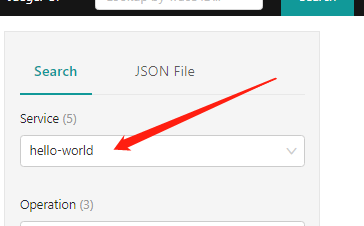
}Start the Web and console programs respectively, then open the Jaeger interface, select Hello world in "Service", and then click Find Traces at the bottom.
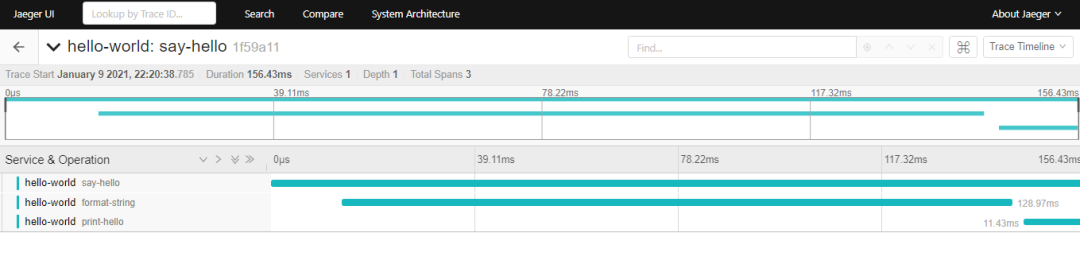
Through Jaeger, we can analyze the execution speed of functions in the link and the performance of the server.
summary
In the experiment, we explored the use of logs and link tracking in. NET Core. By reasonably carrying logs in link tracking, we can use the analysis platform to analyze the performance and status of links and find the performance and request status of each service.
Microsoft MVP

Microsoft's most valuable expert is a global award awarded by Microsoft to third-party technology professionals. Over the past 28 years, technology community leaders around the world have won this award for sharing expertise and experience in their online and offline technology communities.
MVP is a strictly selected team of experts. They represent the most skilled and intelligent people. They are experts who are very enthusiastic and helpful to the community. MVP is committed to helping others through speeches, forum Q & A, creating websites, writing blogs, sharing videos, open source projects, organizing meetings, etc., and helping users of Microsoft technology community to make Use Microsoft technology.
For more details, please visit the official website:
https://mvp.microsoft.com/zh-cn