Mission 23 October
1 0.1 Use w to view system load
10.2 vmstat command
10.3 top command
10.4 sar command
10.5 nload command
View System Load
- w command
# Line 1: Current system time, system start-up time, logged-in users, system load: 1 minute, 5 minutes, 15 minutes
[root@centos7 ~]# w
 20:54:14 up 5 min,  1 user,  load average: 0.01, 0.14, 0.09
USER     TTY      FROM             LOGIN@   IDLE   JCPU   PCPU WHAT
root     tty1                      19:49    2.00s  0.04s  0.00s w
root     pts/0    192.168.65.1     20:50    6.00s  0.07s  0.03s w
tty[1-7]:Physical machine terminal; pts:Virtual terminal (via ssh Remote connection)
About the value of the system load: the average number of processes using the cpu per unit time. The optimum value is the number of logical CPUs in the system, which is greater than the pressure on the cpu, and less than the value means that the cpu is idle.
# View the number of CPUs in the current system (+1)
[root@centos7 ~]# grep "processor" /proc/cpuinfo | tail -n 1
processor	: 1

# The above code indicates that the number of CPUs in the system is 2.
- uptime command
# The display is equivalent to the first line of the w command
[root@centos7 ~]# uptime
 21:03:14 up 14 min,  1 user,  load average: 0.00, 0.03, 0.05
Monitoring system status: vmstat
# Statistical system status every 1 s, a total of 5 times (the latter 5 do not add, will continue to count, unless interrupted by ctrl+c)
[root@centos7 ~]# vmstat 1 5
procs -----------memory---------- ---swap-- -----io---- -system-- ------cpu-----
 r  b   swpd   free   buff  cache   si   so    bi    bo   in   cs us sy id wa st
 1  0      0 736764   2076 135812    0    0    34     4   59   57  0  0 98  1  0
 1  0      0 736764   2076 135812    0    0     0     0   60   49  0  1 100  0  0
 0  0      0 736764   2076 135844    0    0     0     0   42   33  0  0 100  0  0
 0  0      0 736764   2076 135844    0    0     0     0   53   44  0  0 100  0  0
 0  0      0 736764   2076 135844    0    0     0     0   41   36  0  0 100  0  0
| Symbol | Explain |
|---|---|
| r(run) | Number of currently running processes |
| b(block) | Number of processes waiting for the current system (blocked by network, disk) |
| swpd | The swap partition changes only when memory is insufficient. |
| free | Residual memory size |
| si | Data is written to memory from swap |
| so | Data is written to swap from memory |
| bi | Disk - > Memory: The amount of data read |
| bo | Memory - > Disk: The amount of data written |
| us | Percentage of cpu resources occupied by user-level generated processes (longer than 50, resources may not be sufficient) |
| sy | Percentage of cpu resources occupied by processes and services generated at the system level |
| id | Percentage of cpu resources occupied by idle resources (us+sy+id=100) |
| wa | Percentage of waiting CPUs (large CPUs may be insufficient) |
View process resource usage:top
View process resource usage (dynamic, refreshed every 3 seconds)
[root@centos7 ~]# top
top - 21:27:28 up 38 min,  1 user,  load average: 0.00, 0.01, 0.05
Tasks:  93 total,   1 running,  92 sleeping,   0 stopped,   0 zombie
%Cpu(s):  0.0 us,  0.0 sy,  0.0 ni,100.0 id,  0.0 wa,  0.0 hi,  0.0 si,  0.0 st
KiB Mem :   999720 total,   732700 free,   125816 used,   141204 buff/cache
KiB Swap:  4194300 total,  4194300 free,        0 used.   7 110 64 avail Mem

   PID USER      PR  NI    VIRT    RES    SHR S  %CPU %MEM     TIME+ COMMAND
     1 root      20   0  128164   6816   4048 S   0.0  0.7   0:02.61 systemd
     2 root      20   0       0      0      0 S   0.0  0.0   0:00.01 kthreadd
     3 root      20   0       0      0      0 S   0.0  0.0   0:00.02 ksoftirqd+
     5 root       0 -20       0      0      0 S   0.0  0.0   0:00.00 kworker/0+
     6 root      20   0       0      0      0 S   0.0  0.0   0:00.01 kworker/u+
     7 root      rt   0       0      0      0 S   0.0  0.0   0:00.03 migration+
     8 root      20   0       0      0      0 S   0.0  0.0   0:00.00 rcu_bh
     9 root      20   0       0      0      0 S   0.0  0.0   0:00.45 rcu_sched
    10 root      rt   0       0      0      0 S   0.0  0.0   0:00.01 watchdog/0
    11 root      rt   0       0      0      0 S   0.0  0.0   0:00.01 watchdog/1
- Line 1: The result is equal to the uptime command
top - 21:27:28 up 38 min, 1 user, load average: 0.00, 0.01, 0.05
- Line 2: Number of current processes: total, running, dormant, stopped, rigid
Tasks: 93 total, 1 running, 92 sleeping, 0 stopped, 0 zombie
- Line 3: Average usage of all CPUs: us (er), sy (stem), Ni (ce), ID (le), (IO-) wa (i t), h (ardware-) I (nterrupts), s (s oftware-) I (nterrupts), s (tolen) t (ime)
%Cpu(s): 0.0 us, 0.0 sy, 0.0 ni,100.0 id, 0.0 wa, 0.0 hi, 0.0 si, 0.0 st
- Line 4: Physical memory usage
KiB Mem : 999720 total, 732700 free, 125816 used, 141204 buff/cache
- Line 5: Exchange partition usage
KiB Swap: 4194300 total, 4194300 free, 0 used. 711064 avail Mem
Display effect switching
- Sort by M, by the size of memory used;
- Sort by P, by cpu usage (default);
- Press the number 1 to display the usage of all specified CPUs on the third line.
Top-c displays resource usage for specific process commands
[root@centos7 ~]# top -c
top - 21:47:42 up 58 min,  1 user,  load average: 0.00, 0.01, 0.05
Tasks:  92 total,   1 running,  91 sleeping,   0 stopped,   0 zombie
%Cpu(s):  0.2 us,  0.3 sy,  0.0 ni, 99.5 id,  0.0 wa,  0.0 hi,  0.0 si,  0.0 st
KiB Mem :   999720 total,   706460 free,   138408 used,   154852 buff/cache
KiB Swap:  4194300 total,  4194300 free,        0 used.   690712 avail Mem

   PID USER      PR  NI    VIRT    RES    SHR S  %CPU %MEM     TIME+ COMMAND
   525 root      20   0  305296   6292   4920 S   0.3  0.6   0:05.09 /usr/bin/vmtoolsd
  1273 root      20   0  157612   2192   1592 R   0.3  0.2   0:00.10 top -c
     1 root      20   0  128164   6816   4048 S   0.0  0.7   0:02.63 /usr/lib/systemd/systemd --switched-root --system --deserializ+
     2 root      20   0       0      0      0 S   0.0  0.0   0:00.01 [kthreadd]
     3 root      20   0       0      0      0 S   0.0  0.0   0:00.03 [ksoftirqd/0]
     5 root       0 -20       0      0      0 S   0.0  0.0   0:00.00 [kworker/0:0H]
     6 root      20   0       0      0      0 S   0.0  0.0   0:00.01 [kworker/u256:0]
     7 root      rt   0       0      0      0 S   0.0  0.0   0:00.03 [migration/0]
     8 root      20   0       0      0      0 S   0.0  0.0   0:00.00 [rcu_bh]
     9 root      20   0       0      0      0 S   0.0  0.0   0:00.53 [rcu_sched]
    10 root      rt   0       0      0      0 S   0.0  0.0   0:00.01 [watchdog/0]
    11 root      rt   0       0      0      0 S   0.0  0.0   0:00.02 [watchdog/1]
    12 root      rt   0       0      0      0 S   0.0  0.0   0:00.01 [migration/1]
    13 root      20   0       0      0      0 S   0.0  0.0   0:00.04 [ksoftirqd/1]
    15 root       0 -20       0      0      0 S   0.0  0.0   0:00.00 [kworker/1:0H]
    17 root      20   0       0      0      0 S   0.0  0.0   0:00.01 [kdevtmpfs]
    18 root       0 -20       0      0      0 S   0.0  0.0   0:00.00 [netns]
    19 root      20   0       0      0      0 S   0.0  0.0   0:00.00 [khungtaskd]
    20 root       0 -20       0      0      0 S   0.0  0.0   0:00.00 [writeback]
    21 root       0 -20       0      0      0 S   0.0  0.0   0:00.00 [kintegrityd]
Top-bn1 displays all information at once, suitable for scripting
sar command
install
yum install -y epel-release
yum install -y sysstat
The state of the system is stored in / var/log/sa / directory every 10 minutes. The default sar command calls the history file in / var/log/sa / directory without parameters. These historical files cannot be read by cat! Some binary files!
View Network Card Traffic-n DEV
# Output every 1s, display 4 times
[root@centos7 ~]# sar -n DEV 1 4
Linux 3.10.0-693.2.2.el7.x86_64 (centos7) 	... 	_x86_64_	(2 CPU)

22 07 minutes 26 seconds     IFACE   rxpck/s   txpck/s    rxkB/s    txkB/s   rxcmp/s   txcmp/s  rxmcst/s
22 07 minutes 27 seconds        lo      0.00      0.00      0.00      0.00      0.00      0.00      0.00
22 07 minutes 27 seconds     ens33      1.00      0.00      0.06      0.00      0.00      0.00      0.00

22 07 minutes 27 seconds     IFACE   rxpck/s   txpck/s    rxkB/s    txkB/s   rxcmp/s   txcmp/s  rxmcst/s
22 07 minutes 28 seconds        lo      0.00      0.00      0.00      0.00      0.00      0.00      0.00
22 07 minutes 28 seconds     ens33      2.00      1.00      0.12      0.40      0.00      0.00      0.00

22 07 minutes 28 seconds     IFACE   rxpck/s   txpck/s    rxkB/s    txkB/s   rxcmp/s   txcmp/s  rxmcst/s
22 07 minutes 29 seconds        lo      0.00      0.00      0.00      0.00      0.00      0.00      0.00
22 07 minutes 29 seconds     ens33      2.00      1.00      0.12      0.40      0.00      0.00      0.00

22 07 minutes 29 seconds     IFACE   rxpck/s   txpck/s    rxkB/s    txkB/s   rxcmp/s   txcmp/s  rxmcst/s
22 07 minutes 30 seconds        lo      0.00      0.00      0.00      0.00      0.00      0.00      0.00
22 07 minutes 30 seconds     ens33      1.00      1.00      0.06      0.40      0.00      0.00      0.00

//Average time: IFACE rxpck/s txpck/s rxkB/s txkB/s rxcmp/s txcmp/s rxmcst/s
//Average time: Lo 0.00 0.00 0.00 0.00 0.00 0.00 0.00 0.00 0.00 0.00 0.00
//Mean time: ens33 1.50 0.75 0.09 0.30 0.00 0.00 0.00 0.00
Explain:
- time
- adapter name
- Received Packets/s
- Sending Packets/s
- The amount of data received/s
- The amount of data sent/s
- The last three columns need no attention
Packets received in a certain period of time increase abnormally, may be attacked, need attention!
View historical data (save only one month's history file)
- f/var/log/sa/saDD (DD is the date of the file)
[root@centos7 ~]# sar -n DEV -f /var/log/sa/sa08
Linux 3.10.0-693.2.2.el7.x86_64 (centos7) 	... 	_x86_64_	(2 CPU)

22 00 minutes 01 seconds     IFACE   rxpck/s   txpck/s    rxkB/s    txkB/s   rxcmp/s   txcmp/s  rxmcst/s
22 10 minutes and 01 seconds        lo      0.00      0.00      0.00      0.00      0.00      0.00      0.00
22 10 minutes and 01 seconds     ens33      0.44      0.14      0.03      0.02      0.00      0.00      0.00
//Average time: Lo 0.00 0.00 0.00 0.00 0.00 0.00 0.00 0.00 0.00 0.00 0.00
//Mean time: ens33 0.440.140.03 0.02 0.00 0.00 0.00 0.00


[root@centos7 ~]# sar -q -f /var/log/sa/sa08
Linux 3.10.0-693.2.2.el7.x86_64 (centos7) 	... 	_x86_64_	(2 CPU)

22 00 minutes 01 seconds   runq-sz  plist-sz   ldavg-1   ldavg-5  ldavg-15   blocked
22 10 minutes and 01 seconds         0       110      0.02      0.02      0.05         0
//Average time: 0 110 0.02 0.02 0.05 0
View Disk Information
[root@centos7 ~]# sar -b 1 5
Linux 3.10.0-693.2.2.el7.x86_64 (centos7) 	... 	_x86_64_	(2 CPU)

Tps rtps WTPS bread/s bwrtn/s at 22:16:03 seconds
22:16:04 seconds 0.00 0.00 0.00 0.00 0.00 0.00
22:16:05 seconds 0.00 0.00 0.00 0.00 0.00 0.00
22:16:06 seconds 0.00 0.00 0.00 0.00 0.00 0.00
22:16:07 seconds 0.00 0.00 0.00 0.00 0.00 0.00
22:16:08 seconds 0.00 0.00 0.00 0.00 0.00 0.00
Average time: 0.00 0.00 0.00 0.00 0.00 0.00 0.00
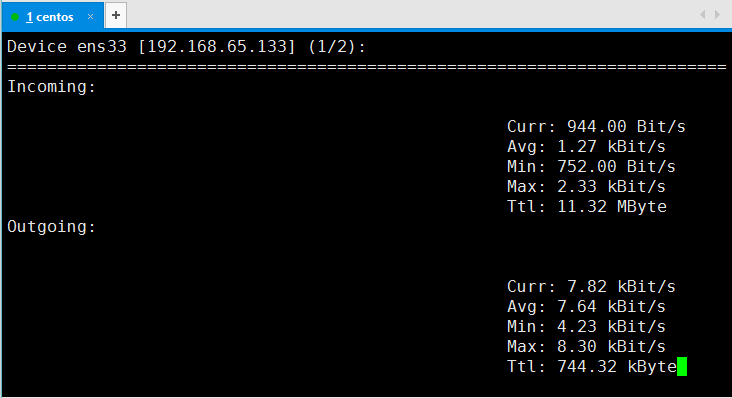
nload command
install
yum install -y epel-release
yum install -y nload
Use the left and right keyboard to switch the network cards of the display system; the nload command will dynamically display the IO traffic of the network card in order to understand the current system traffic status.