Summary of Li Hongyi's machine learning notes
Course links
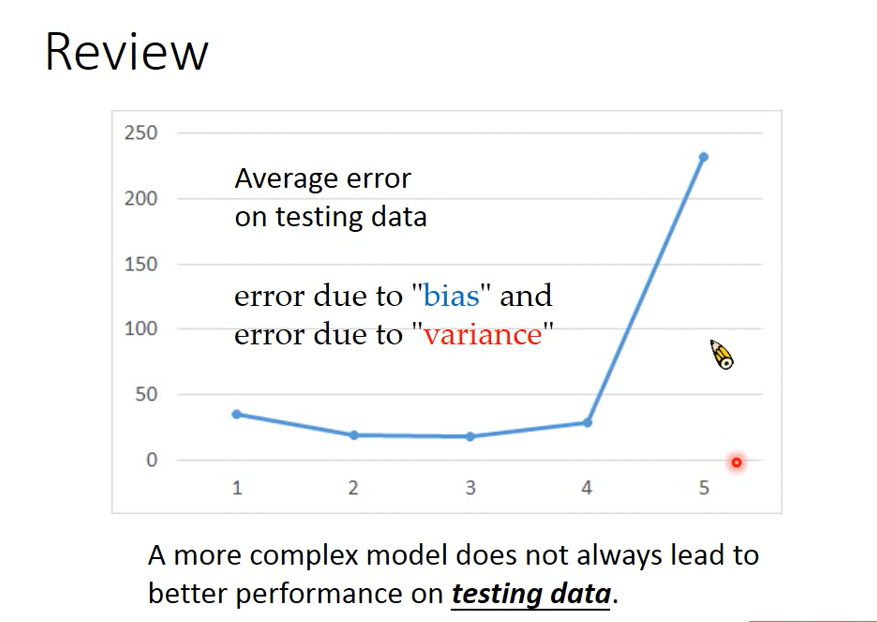
Review
The more complex the model, the lower the error on the testing data.
error comes from two places:
- bias
- variance
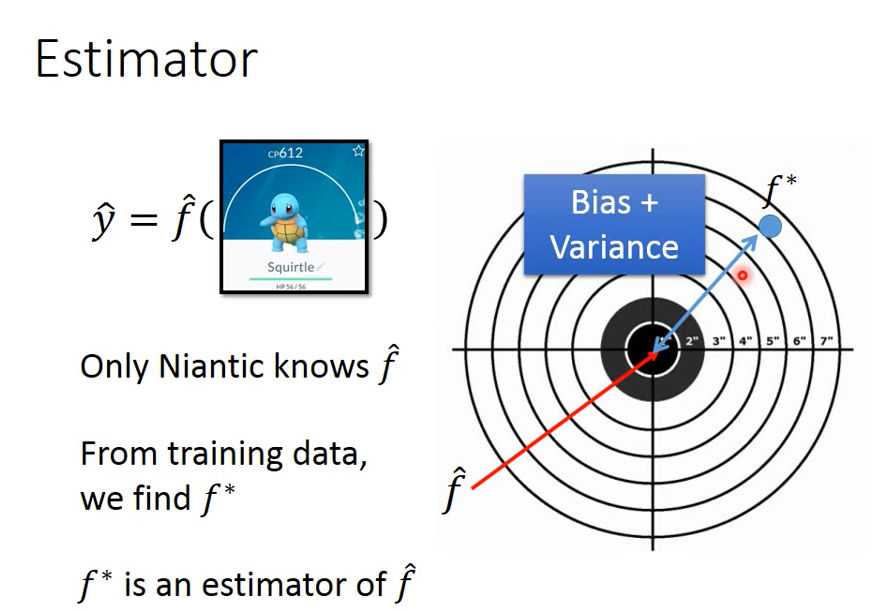
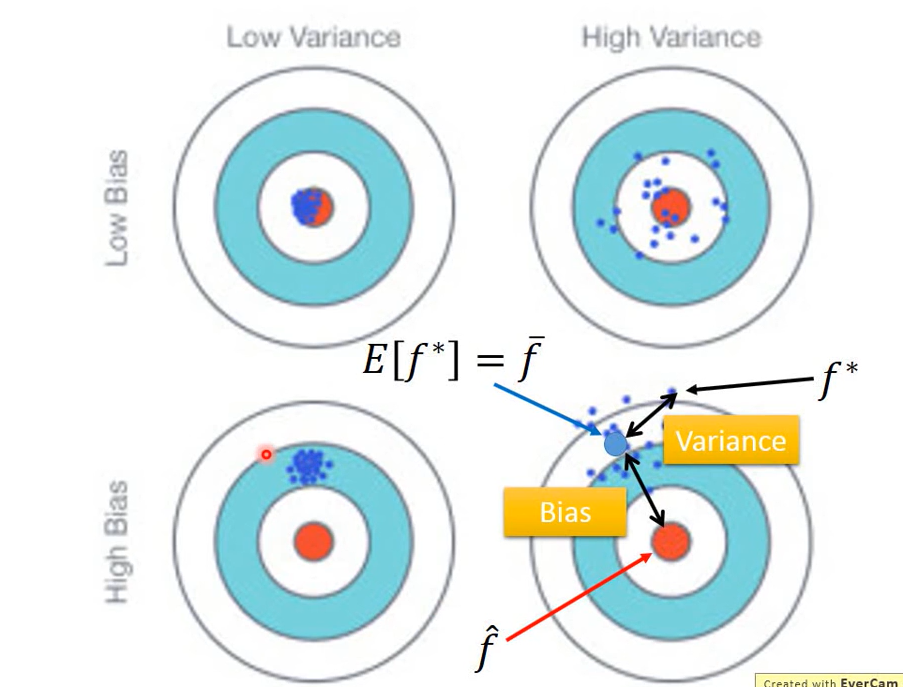
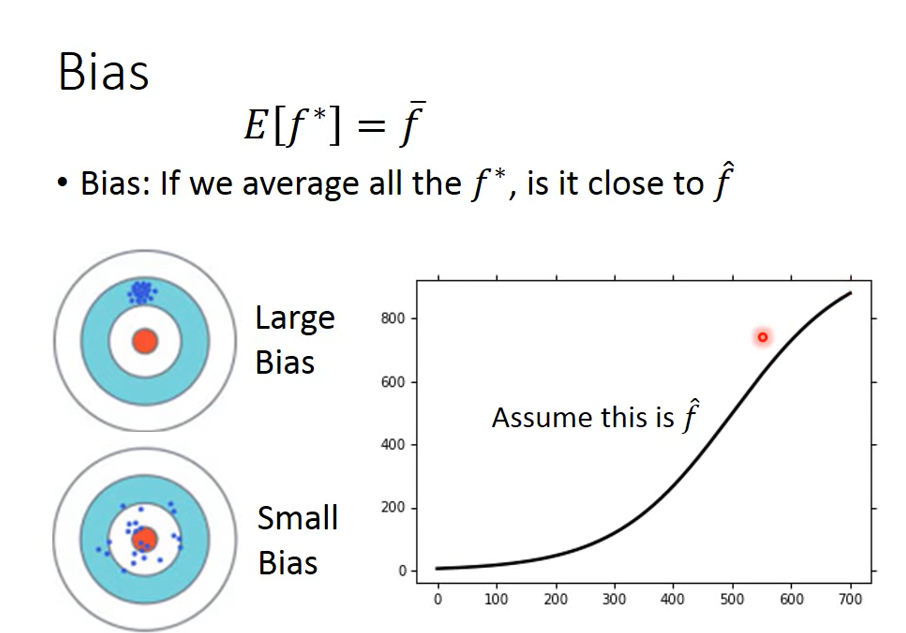
f_star is f_ An estimate of hat, f_star may not be equal to f_hat, the distance may come from bias or variance
Estimate the mean value of variable x (assuming that the mean value of variable x is μ, Variance is σ^ 2):
First sample N points and calculate the average value m, which is generally not equal to the average value of x μ
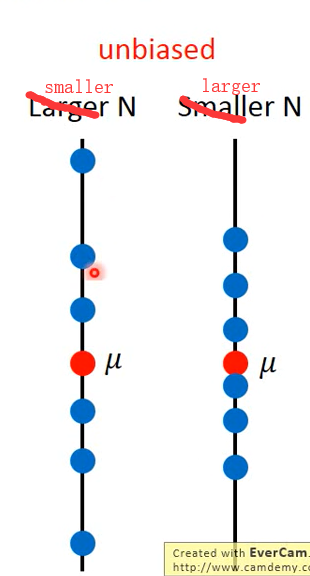
But calculating the expected value of m will be exactly equal to μ
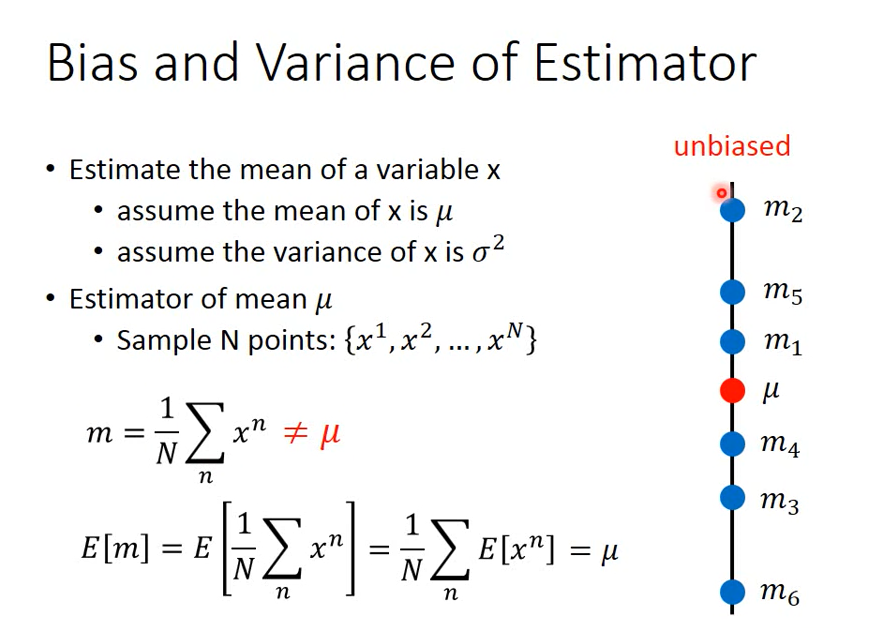
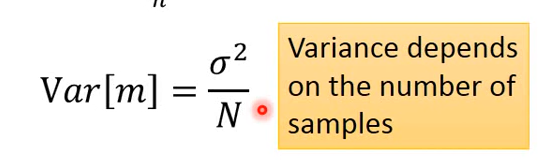
The larger the N, the more concentrated the distribution; The smaller the N, the more dispersed the distribution
Estimating x σ^ two
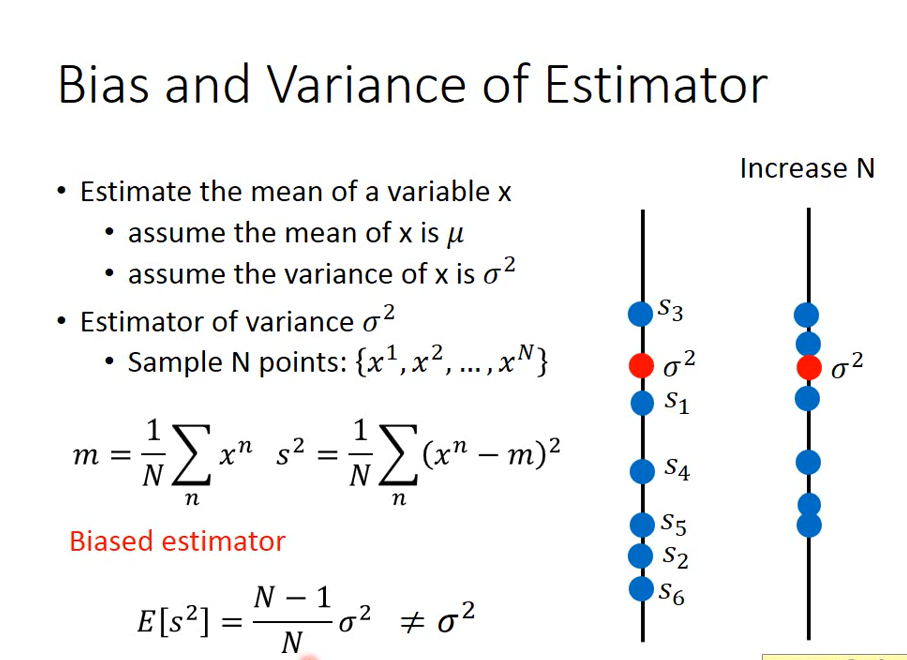
The key figures are as follows for easy understanding
Errors come from bias (aiming position) and variance (gun performance), ideally both small / none.
The more concentrated the points, the smaller the variance; The farther away from the center, the greater the deviation.
Parallel time and space, catch different treasure dreams
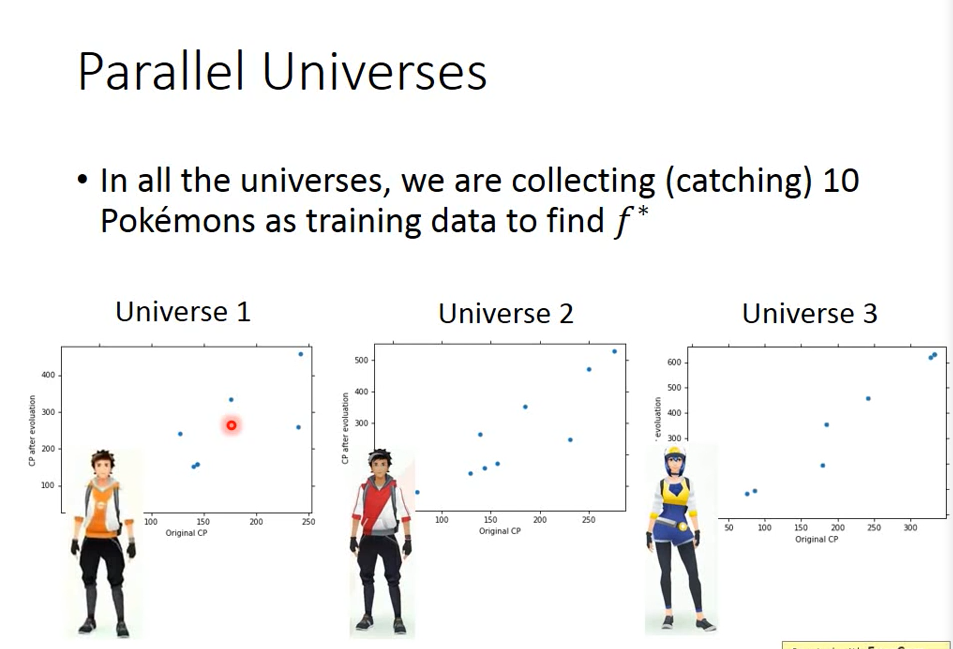
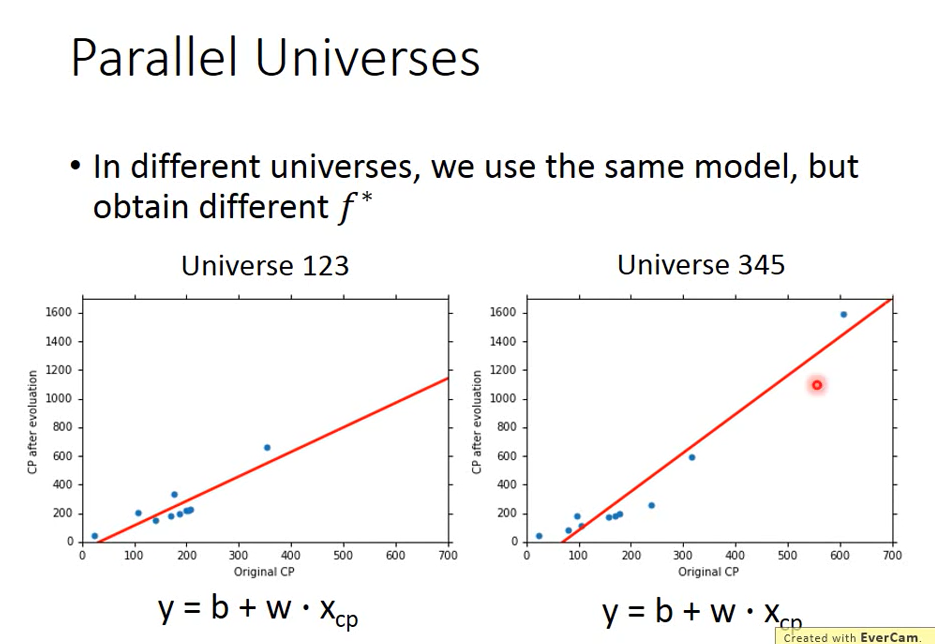
The f * found in different universes is different
In 100 parallel universes, grab 10 Baoke dreams and find one f*
100 different w and b
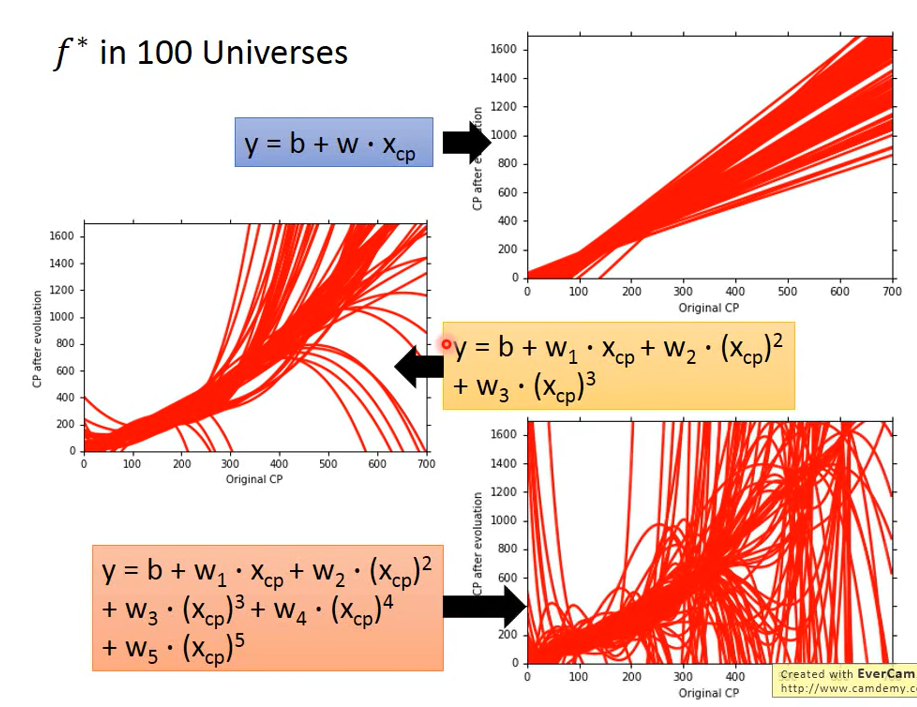
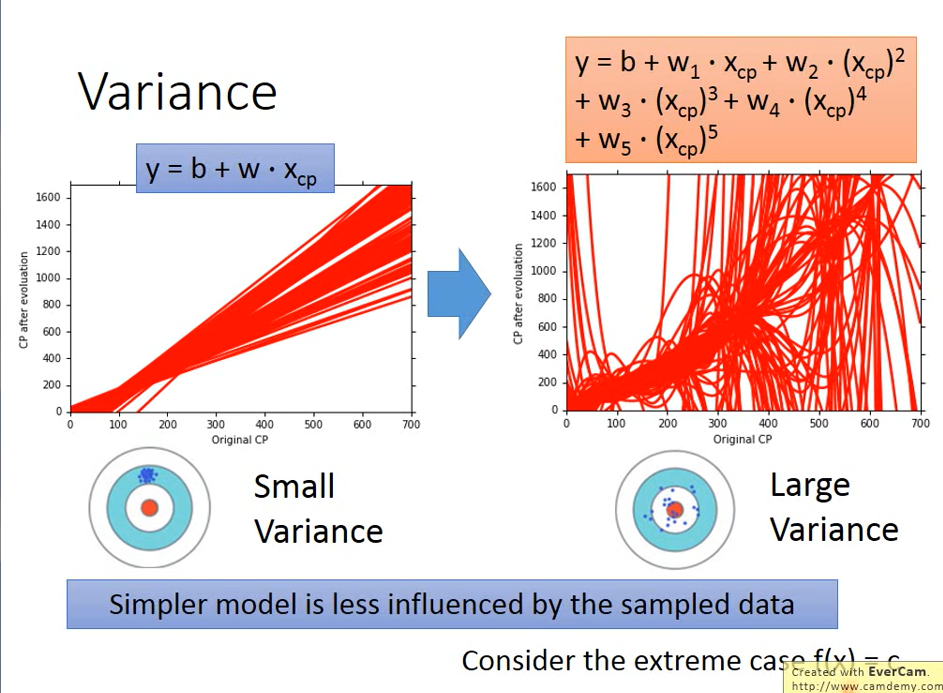
Simple model: very concentrated, and the variance is very small
Complex model: scattered and variable
Reason: the simple model is less affected by different data
The bull's-eye represents the ideal function and the target result.
The experimental results are as follows:
Black line: bull's-eye position;
The red line represents: do 5000 experiments, and the f * found each time is different, and the model is also different;
The blue line represents: after averaging the 5000 times of f *
f
ˉ
\bar f
</span><span class="katex-html"><span class="base"><span class="strut" style="height: 1.02566em; vertical-align: -0.19444em;"></span><span class="mord accent"><span class="vlist-t vlist-t2"><span class="vlist-r"><span class="vlist" style="height: 0.83122em;"><span class="" style="top: -3em;"><span class="pstrut" style="height: 3em;"></span><span class="mord mathdefault" style="margin-right: 0.10764em;">f</span></span><span class="" style="top: -3.26344em;"><span class="pstrut" style="height: 3em;"></span><span class="accent-body" style="left: -0.08333em;">ˉ</span></span></span><span class="vlist-s"></span></span><span class="vlist-r"><span class="vlist" style="height: 0.19444em;"><span class=""></span></span></span></span></span></span></span></span></span></p>
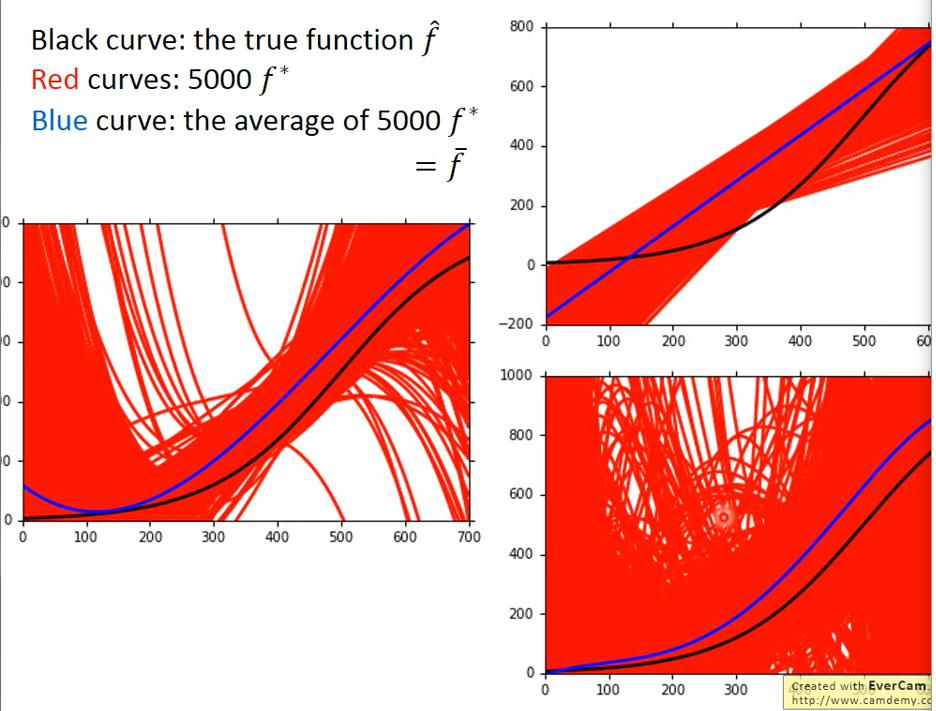
Explanation of the following figure:
model is a function set, which is represented by a range. The best function can only be selected from function set.
-
The space of a simple model is very small and may not contain target, so it is impossible to get target on average no matter how the sample is.
-
The complex model has a large space. Its function set contains a target, but it may not be able to find the target, because the training data given each time is different. If it is scattered near the target, it can be obtained as long as it is averaged
f ˉ \bar f </span><span class="katex-html"><span class="base"><span class="strut" style="height: 1.02566em; vertical-align: -0.19444em;"></span><span class="mord accent"><span class="vlist-t vlist-t2"><span class="vlist-r"><span class="vlist" style="height: 0.83122em;"><span class="" style="top: -3em;"><span class="pstrut" style="height: 3em;"></span><span class="mord mathdefault" style="margin-right: 0.10764em;">f</span></span><span class="" style="top: -3.26344em;"><span class="pstrut" style="height: 3em;"></span><span class="accent-body" style="left: -0.08333em;">ˉ</span></span></span><span class="vlist-s"></span></span><span class="vlist-r"><span class="vlist" style="height: 0.19444em;"><span class=""></span></span></span></span></span></span></span></span></span></p> </li></ul>
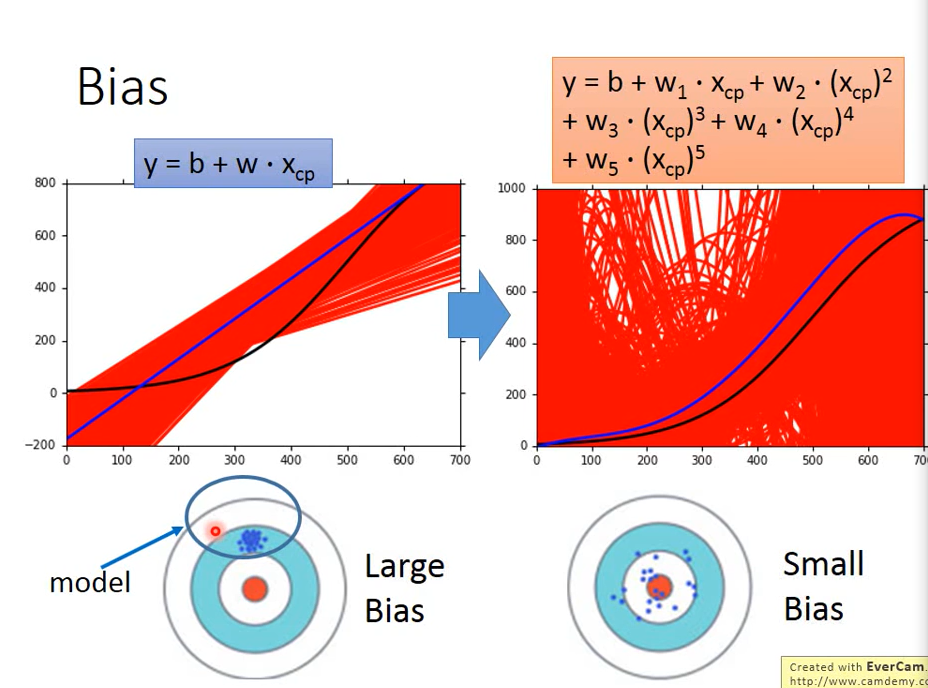
As shown below, where
Simple model: big bias, small variance
Complex model: small bias, large variance
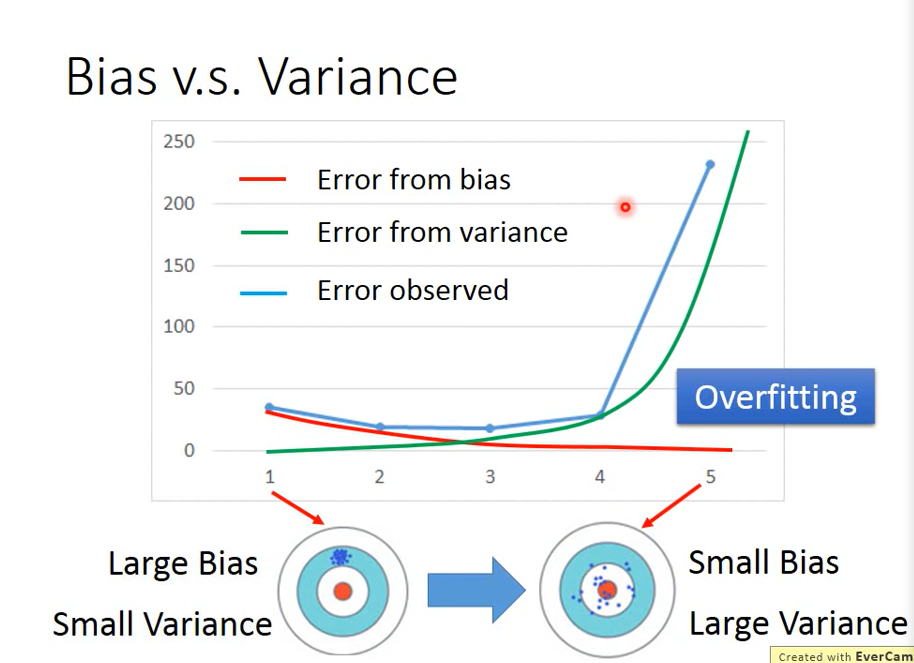
error comes from bias (red line) and variance (green line), and the blue line is the impact of both
- error comes from a large variance: overfitting over fitting (too complex)
- error comes from bias: underfitting under fitting (too simple)
How do you know whether bias is big or variance is big?
- If your model can't fit you and your training example (a few training data points), it means bias is big and underfitting.
- If you get a small error on training data and an error on testing data, it means that the variance of the model is large, indicating overfitting
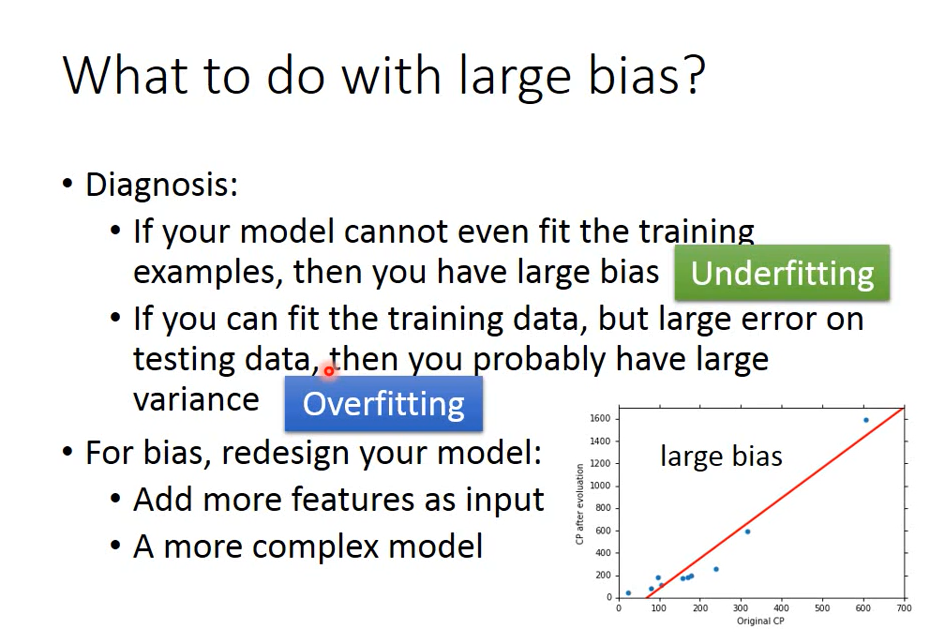
resolvent:
bias large:
- To redesign a new model, it is possible that the model does not contain a target at all
f ^ \hat{f} </span><span class="katex-html"><span class="base"><span class="strut" style="height: 1.15232em; vertical-align: -0.19444em;"></span><span class="mord accent"><span class="vlist-t vlist-t2"><span class="vlist-r"><span class="vlist" style="height: 0.95788em;"><span class="" style="top: -3em;"><span class="pstrut" style="height: 3em;"></span><span class="mord"><span class="mord mathdefault" style="margin-right: 0.10764em;">f</span></span></span><span class="" style="top: -3.26344em;"><span class="pstrut" style="height: 3em;"></span><span class="accent-body" style="left: -0.08333em;">^</span></span></span><span class="vlist-s"></span></span><span class="vlist-r"><span class="vlist" style="height: 0.19444em;"><span class=""></span></span></span></span></span></span></span></span></span>,So we can consider adding more feature,Higher number of times. (increase) data (no effect)</li></ul>
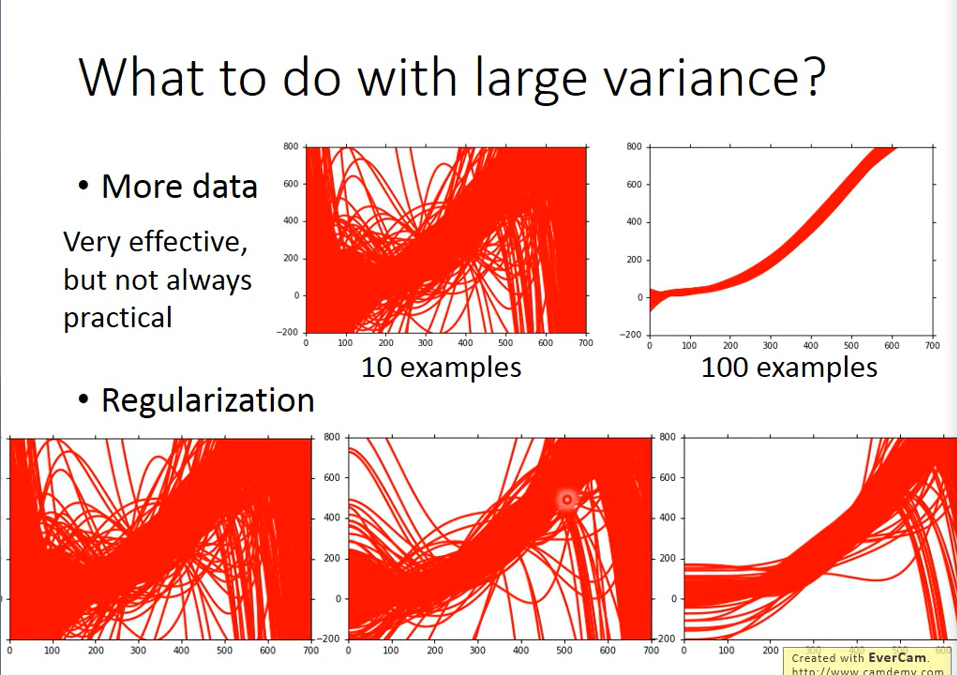
variance:
- Increase the number of data, enhance the data set, and effectively control the excessive variance
- Regularization regularization, add a term after loss function
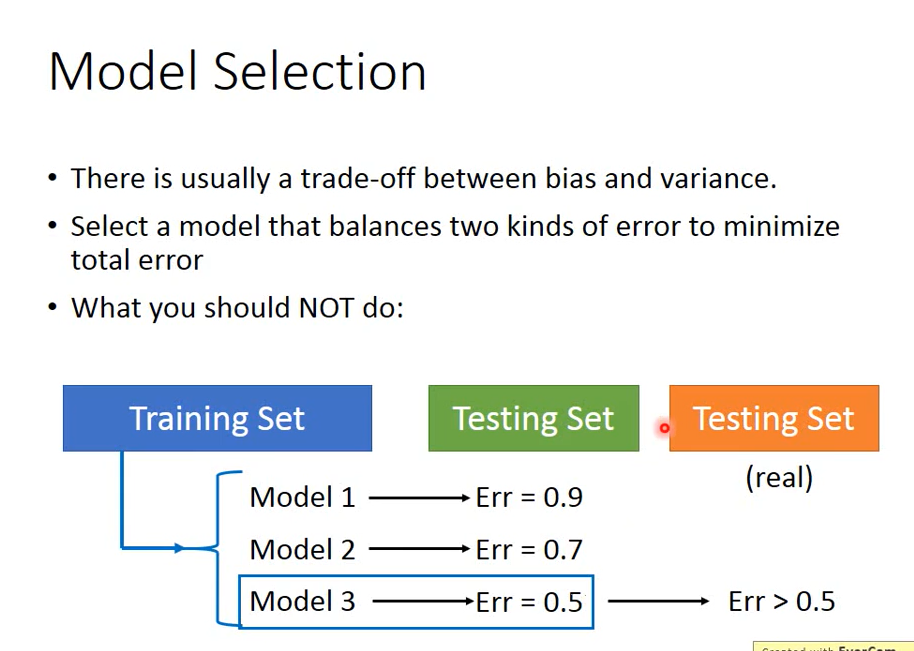
In the balance between bias and variance, choosing a model can balance the two errors to minimize the total error.
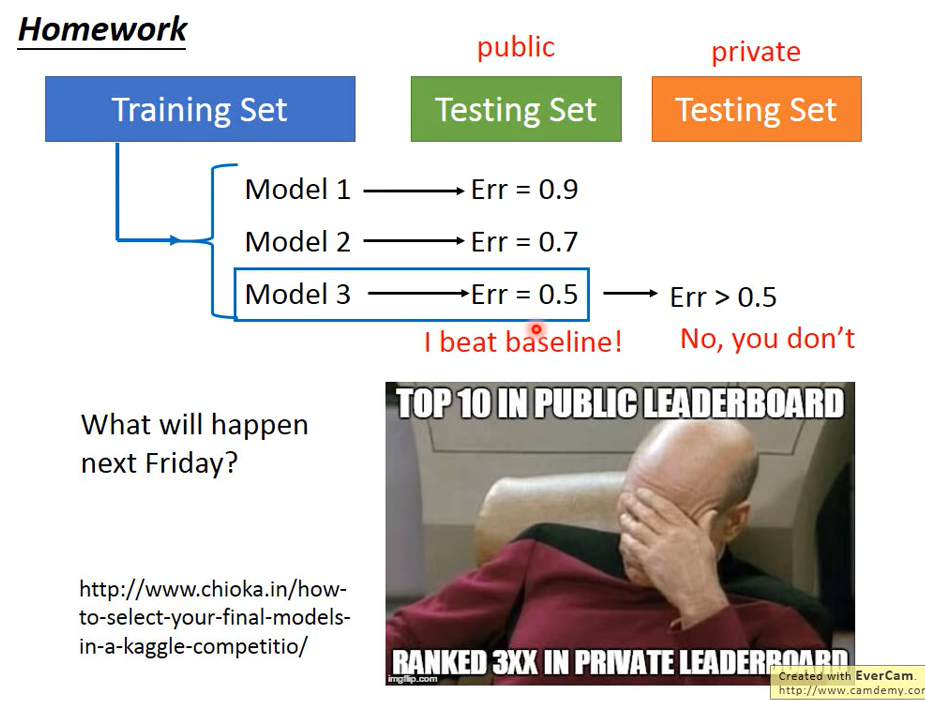
But what you can't do is: when you use your existing testing set to select the best model, the selected model may not be the best model on the real testing data
Testing set has its own bias: deviation of data collection. Unless your testing set better represents the overall distribution, the Err will become worse in actual use
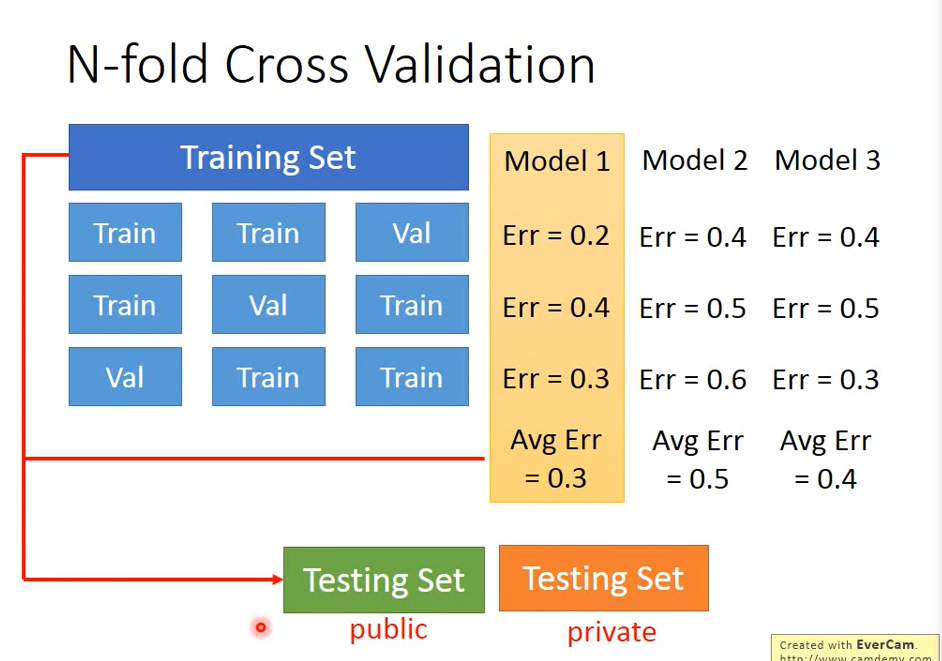
Correct practice: cross validation
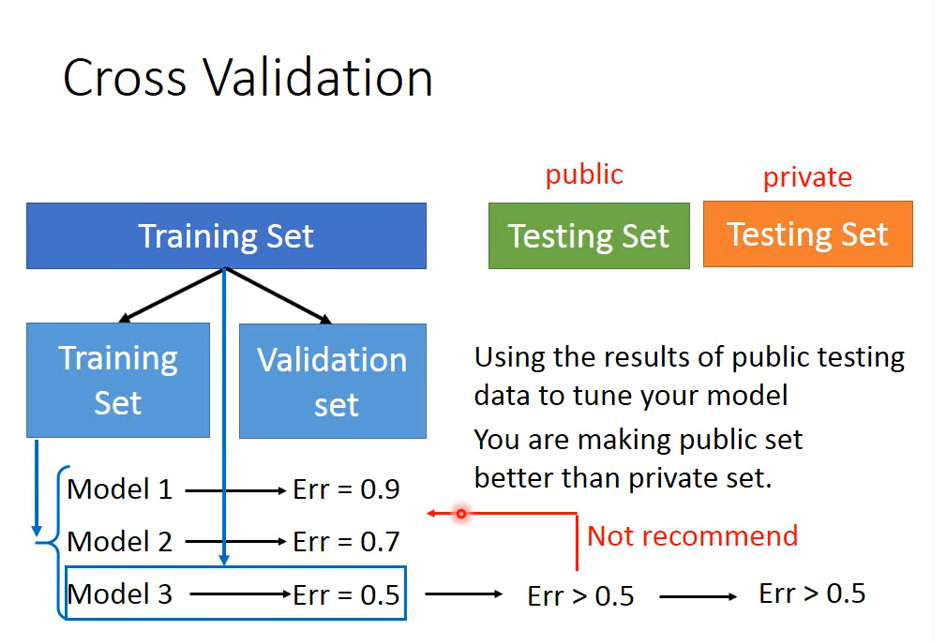
If you don't believe in a data set divided into trin and test, you can divide it several times, that is, N-fold Cross Validation
Use the best model in the final testing test