preface
Due to the need of work, d3 is used to draw the mind map and force map based on svg
So I'm quite familiar with svg. I'll make a memorial here.
Really, let's go see a rookie
1, svg
This circle is a common and convenient loading graph (because the animateTransform tag is filtered out in the document, it has no effect. In fact, it can rotate infinitely in the browser)
Ready to use Gadgets: loading.io
	<svg xmlns="http://www.w3.org/2000/svg" xmlns:xlink="http://www.w3.org/1999/xlink" style="margin: auto; background: rgba(255, 255, 255, 0); display: block; shape-rendering: auto;" width="50px" height="50px" viewBox="0 0 100 100" preserveAspectRatio="xMidYMid">
	  <circle cx="50" cy="50" r="32" stroke-width="8" stroke="#1989fa" stroke-dasharray="50.26548245743669 50.26548245743669" fill="none" stroke-linecap="round">
	    <animateTransform attributeName="transform" type="rotate" repeatCount="indefinite" dur="1s" keyTimes="0;1" values="0 50 50;360 50 50"></animateTransform>
	  </circle>
	</svg>
svg is often used for small icon s or images with uncomplicated content as large images. Because svg is full of tag code and less content, it will be more comfortable to use than png image loading
It should be noted that svg objects are different from ordinary dom objects. For example, hasClass is invalid, so the methods on jquery need to be determined according to the situation
g
g = group is to group labels without actual display. When there are more labels in a vector diagram, each label has different positioning or needs to be taken out for screening, it needs to be wrapped with g labels. The popular analogy is UL = SVG > Li = g
foreignobject
It is not compatible with IE. by analogy, it is equivalent to iframe. If you need to add some html elements such as div in svg, you need to wrap it with this tag, and the content is the same as that of ordinary dom
line
The xy axis values x1 and y1 of a given starting point are connected in a straight line with the end points x2 and y2
rect
Given the width and height attribute, draw a rectangle. If you need to fill, add the color value of fill attribute. Otherwise, add the stroke color value to draw a border
circle
Draw a prototype with a given radius r
path
Path brush is a general scheme to realize all irregular graphics. The use of basic points is to draw two straight lines. The important attribute d, M0 0 L0 10, means to move to the position where the xy coordinate axis is (0,0), and then draw a line to (0,10)
It is similar to canvas's moveTo(), lineTo()
text
If you want to add text in svg, you must wrap it with this label. If you want to wrap a line, my implementation method is to divide the string by length and add it to the tspan label under the text package, one tspan label for each line
Common attributes on some labels
- Fill fill content is the specified color
- stroke sets the brush color
- Stroke width brush width thickness
- xy offset relative to the current canvas (svg specifies the coordinate axis of width and height)
- Stroke opacity brush transparency
- Stroke dasharray dashed line spacing, actual fine tuning
2, d3.js v5 Chinese document
Like lodash, the method set is divided into different plug-ins in d3. Each plug-in uses different methods. There are limitations here. I only use part
1. d3-selection
The methods in d3 are chain calls, and the segmentation is very detailed. The most commonly used method is d3 selection
The calling method is the same as jquery, and the d3 object is returned
//Select one, select all, and select id or class just like jquery
const svgContainer = d3.select("svg")
    .attr("class", "graf") // Select the svg tag and add a class value for it. If there is already a class, it will be overwritten
    .style("color", "red")

const g = svgContainer.append("g") //Add a group tag g to the svg just found
const rect = g
			.append("rect") //Add a rectangle
			.data([{w:100, h:200}]) //Bind data for the rectangle just added, in array format
			.attr("width",function(d){ //d={w:100,h:200}
				return d.w; //Get the binding data. If there are multiple selections, get the data in array order
			})
const text = g.append("text").text("Add text")
2. d3-zoom
The built-in svg canvas manipulation plug-in allows you to simply zoom and drag the canvas
svgContainer.call( //Bind events for this svg
	d3
		.zoom() //Create a new zoom behavior
		.scaleExtent([0.1, 5]) //Limit zoom range
		.on("zoom", function (d) {
			// Scale event binding
		})
		.on("wheel.zoom", null) // Mouse wheel event binding
		.on("dblclick.zoom", null); //Double click event binding
)
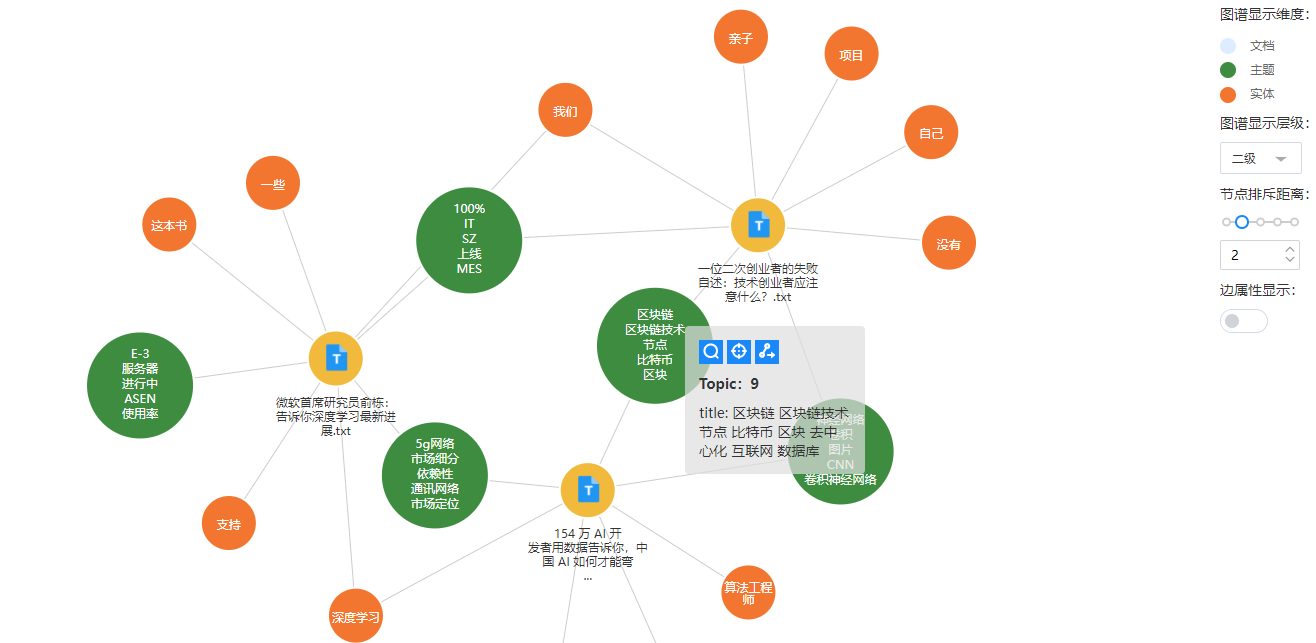
2. d3-force
It is used to draw the force guidance diagram and define the mutual exclusion force, gravity, etc. Draw circles and lines, and hand over the others to the plug-in
var forceSimulation = d3.forceSimulation();
        // Sets the center position of the drawing
        forceSimulation
          .nodes([{
				key: "only ID",
			}])
          .force("link", d3.forceLink([{
				key: "only ID",
	            source: "The starting point of the connection, node Nodal key",
	            target: "End",
			}]).distance(150).strength(1)) //Prevent collision confusion
          // Spacing, impact strength
          .force(
            "collision",
            d3
              .forceCollide()
              .radius(function (d) {
                // Separate exclusion
              }) //Margin margin
              .strength(0.1) //Gravity index
          )
          .force("charge", d3.forceManyBody().strength(-1000)) //exclude
          .velocityDecay(0.5) //Friction, vibration
          .alpha(0.7) //Initial animation speed
          .on("tick", ticked);
          // ticked method is the most important. When the mouse triggers node interaction, recalculate the positions of all nodes and draw the beginning of the connection
2. d3-hierarchy
It is used to draw the force tree structure diagram. Because the width and height of each node are variable, it will squeeze the adjacent nodes, so another plug-in D3 flexree is used
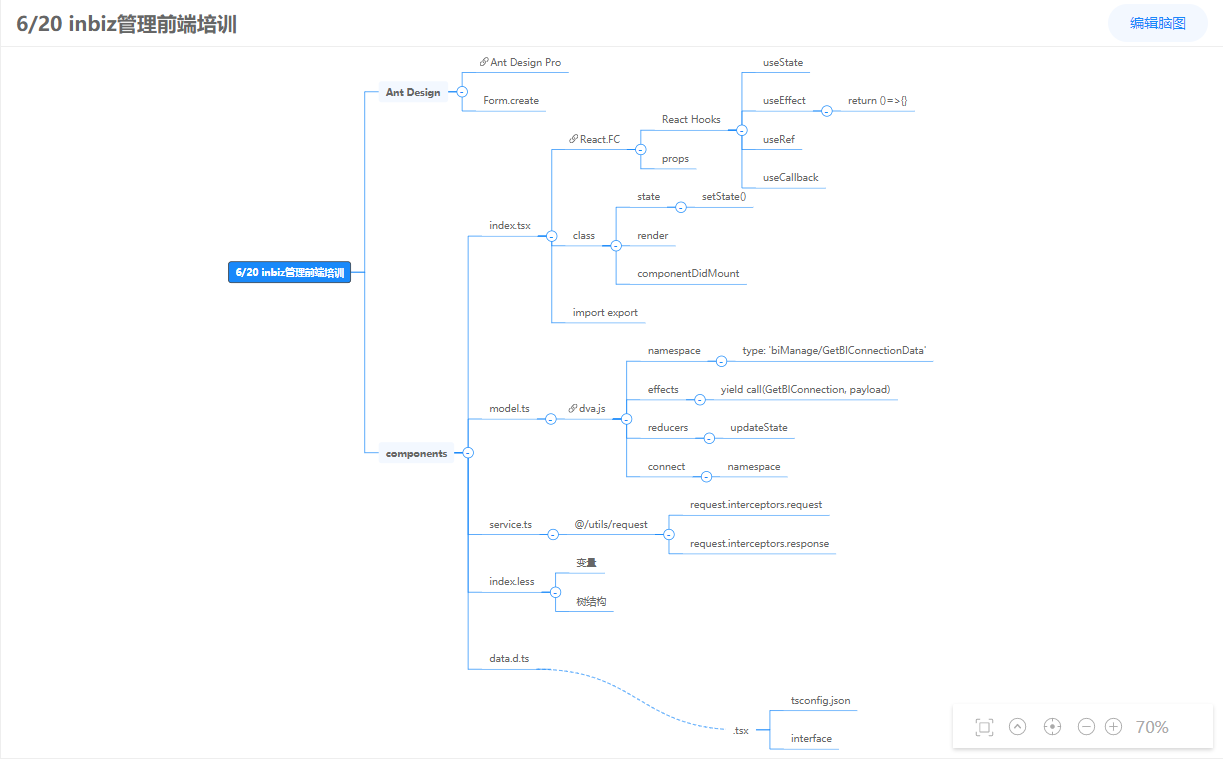
This is the effect of mind mapping. It is simple to realize, but there are many pits
var flextree = d3Flextree.hierarchy;
// Basic configuration of third-party plug-ins
var layout = flextree({
              spacing: nodeHeight / 2 + 10, //Spacing height in left and right layout
            });
var root = layout.hierarchy(d.data[0], function (d) {
	// Layout node location
});
root.sort() // Sort by binding data rules, name, id and other requirements
root.each(function(d){}) //You can adjust the node offset later
- d3.select().data() first binds data, parent-child structure
- Use the basic D3 hierarchy or plug-in version D3 hierarchy to give the location layout of each node. For example, if the root node is (0,0), the first node on the right needs to move the x value, and the right is plus (100,0)
- If it is the right layout, use it directly. If it is a left-right layout, you need to divide the data into two parts, use D3 hierarchy to generate the tree post layout respectively, and the x-axis value on the left is negative. In case of up-down layout, offset the y value
- Finally, draw node graphics and text according to the bound data, calculate the connection according to the two node positions after the current layout is completed, and bind click and drag events
summary
With more d3, you can understand the implementation of charts like echarts