Catalog:
- Prometheus architecture
- K8S Monitoring Indicators and Realization Ideas
- Deployment of Prometheus on K8S Platform
- Configuration Analysis Based on K8S Service Discovery
- Deployment of Grafana on K8S Platform
- Monitoring Pod, Node, Resource Objects in K8S Cluster
- Visualization of Prometheus monitoring data using Grafana
- Warning Rules and Warning Notification
In the past, if monitoring is preferred now, it must be Prometheus+Grafana, that is, many large companies are also using it, such as RBM, 360, Netease, basically using this monitoring system.
I. What is Prometheus?
Prometheus (Prometheus) is a monitoring system originally built on SoundCloud. SoundCloud is a foreign company engaged in cloud computing. It was developed after an engineer from Google came to the company. SoundCloud has been a community open source project since 2012. It has a very active developer and user community. To emphasize open source and independent maintenance, Prometheus joined the Cloud Native Cloud Computing Foundation in 2016.
CNCF has become the second hosting project after Kubernetes. The project is still developing rapidly. With the development of k8s, it has also risen.
https://prometheus.io Official website
https://github.com/prometheus GitHub address
Composition and Architecture of Prometheus
Next, let's take a look at the official sketch. Let's take a look at it.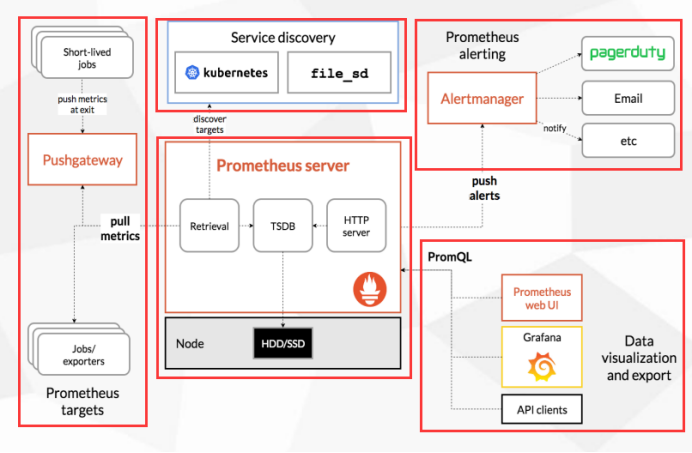
The leftmost part is collecting, who collects and monitors who, generally some short-term tasks, such as cronjob tasks, can also be some persistent tasks, in fact, the main task is some persistent tasks, such as web services, that is, continuous running, exposing some indicators, such as short-term tasks, processing one. The next step is to close, which can be divided into two types. Push gateway is used for short-term tasks to collect these short-term tasks.
The middle part is Prometheus itself. There is a TSDB database inside. It can be completed by collecting and displaying Prometheus from inside. It shows that this UI of itself is lou. So with the help of this open source Grafana, Prometheus will take the initiative to display all the indicators exposed by the monitored end. Take these indicators, store them in your TSDB database, provide them to the Web UI, or Grafana, or API clients to invoke these data through PromQL, PromQL is equivalent to Mysql's SQL, mainly to query these data.
In the middle of the above is to do service discovery, that is, when you have many monitored terminals, it is unrealistic to write these monitored terminals manually, so you need to automatically find new joined nodes, or join the monitoring in batches of nodes. Like k8s, it has built-in k8s service discovery mechanism, that is, it. K8s API s will be connected to find out which applications you deploy, which pod s, and all of them will be exposed to you and monitored. That is why K8S is particularly friendly to prometheus, that is, it has built-in support to do this.
In the upper right corner is the alarm of Prometheus. Its alarm implementation has a component, Alert manager. This component receives the alarm from prometheus, which triggers some pre-values and notifies Alert manager. Alert manager processes the alarm-related processing and sends it to the receiver, either email or enterprise Wechat. Or nails, the whole framework of it, are divided into five pieces.
Summary:
Prometheus Server: Collect metrics, store time series data, and provide query interfaces
Client Library: Client libraries, which can be integrated into many languages, such as a Web site developed with JAVA, can integrate the client side of JAVA to expose relevant indicators and their own indicators, but many business indicators need to be developed and written.
Push Gateway: Short-term storage of metrics data. Mainly for temporary tasks
Exporters: Collect existing third-party service monitoring indicators and expose metrics, which is equivalent to an agent at the collection end.
Alertmanager: Warning
Web UI: Simple Web Console
data model
Prometheus stores all data as time series; the same metric name and label belong to the same indicator.
Each time series is uniquely identified by the metric name and a set of key-value pairs (also labels). That is when the query is made.
These tags are also used to query and filter, which is when writing PromQL.
Time series format:
<metric name>{<label name>=<label value>, ...}
The name of the indicator + curly brackets have a lot of values
Example: api_http_requests_total{method="POST", handler="/messages"}
(Name) (POST request, GET request, request resource, such as message or API) can also have a lot of indicators, such as the protocol of the request, or fields with other HTTP headers, can be marked, that is to say, all the monitored items can be accessed. It was monitored in this way.
Homework and examples
Example: The target that can be grabbed is called Instances. Everyone who has used zabbix knows what the monitored end is called. Generally, it is called host, monitored end, and prometheus is called an instance.
Homework: The set of instances with the same goal is called Job, which means that your monitored end is regarded as your set, such as a group, web services have several sets, such as three sets, write a job, this job is three sets, that is to say, a logical group.
II. K8S Monitoring Indicators
Kubernetes itself monitoring
- node resource utilization: dozens of nodes in the general production environment, hundreds of nodes to monitor
Number of Nodes: You can generally monitor the number of nodes, because it's an example, how many projects a node can run, and it needs to be evaluated. What kind of state and value is the overall resource rate, so it needs to be evaluated according to the project, resource utilization rate and value of running. Estimated, for example, how much resources are needed to run another project.
Pods Number (Node): The same is true: how many pods are run on each node, but by default 110 pods can be run on one node, but in most cases it is impossible to run so much, such as a 128-gigabyte memory, 32-core cpu, a java project, an allocation of 2G, that is to say, 50-60 pods can be run on a general machine, and how many pods can be run. Ten, rarely more than 100.
* Resource object status: such as pod, service,deployment,job, do a statistics.
Pod monitoring
Pod Quantity: How many pods did your project run, and how much profit margin might be. Evaluate how many resources it ran and how many resources it occupied, and how many resources each pod occupied.
Container resource utilization: how much resources are consumed per container, how many CPU s are used, and how much memory is used
Application: This is a partial indicator of the application itself, which is generally difficult to get in our operation and maintenance, so before monitoring, it needs to be developed to expose to you, there are many client integration, client library is to support many languages, need to let development do some development to integrate it. If the development department cooperates, the basic operation and maintenance can hardly achieve this part unless it writes a client program and can get internal work from the outside through shell/python. If this program provides API, this is easy to do. Here.
Prometheus Monitoring K8S Architecture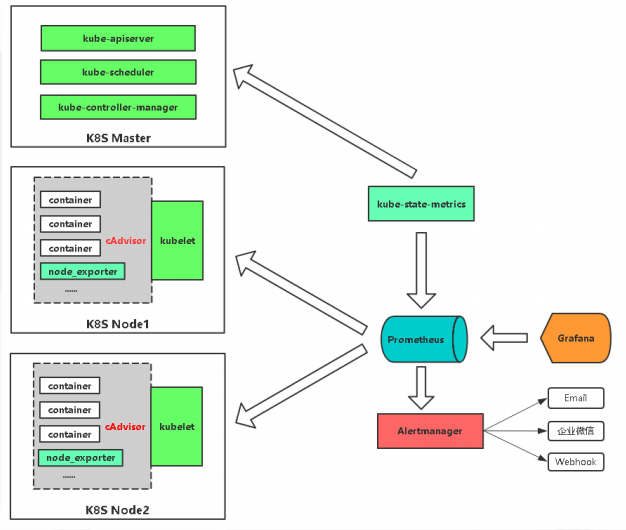
If you want to monitor node resources, you can put a node_exporter, which monitors node resources. Node_exporter is a collector on Linux. If you put it on, you can collect the CPU, memory, network IO of the current node and wait for it to be collected.
If you want to monitor the container, k8s internal provides cAdvisor collector, pod, container can collect these indicators, are built-in, do not need to deploy alone, just know how to access the Cadvisor.
If you want to monitor k8s resource objects, you will deploy a kube-state-metrics service, which will capture these metrics in a regular API and help you access them to Prometheus. If an alarm is sent to some recipients through Alert manager and displayed visually through Grafana.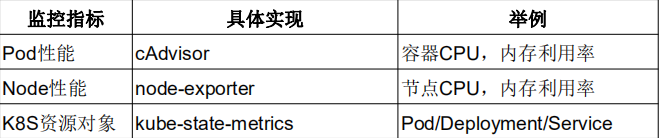
Service discovery:
https://prometheus.io/docs/prometheus/latest/configuration/configuration/#kubernetes_sd_config
3. Deployment of Prometheus+Grafana in K8S
yaml file address:
https://github.com/kubernetes/kubernetes/tree/master/cluster/addons/prometheus
https://grafana.com/grafana/download
Here I am, and I have made some changes.
[root@k8s-master prometheus-k8s]# ls
alertmanager-configmap.yaml         OWNERS
alertmanager-deployment.yaml        prometheus-configmap.yaml
alertmanager-pvc.yaml               prometheus-rbac.yaml
alertmanager-service.yaml           prometheus-rules.yaml
grafana.yaml                        prometheus-service.yaml
kube-state-metrics-deployment.yaml  prometheus-statefulset-static-pv.yaml
kube-state-metrics-rbac.yaml        prometheus-statefulset.yaml
kube-state-metrics-service.yaml     README.md
node_exporter.sh
Now let's create rbac, because the main service host process that deploys it refers to these services
Because prometheus connects to your API, get a lot of metrics from the API
And set up the rights to bind cluster roles, can only view, can not modify
[root@k8s-master prometheus-k8s]# cat prometheus-rbac.yaml
apiVersion: v1
kind: ServiceAccount
metadata:
  name: prometheus
  namespace: kube-system
  labels:
    kubernetes.io/cluster-service: "true"
    addonmanager.kubernetes.io/mode: Reconcile
---
apiVersion: rbac.authorization.k8s.io/v1beta1
kind: ClusterRole
metadata:
  name: prometheus
  labels:
    kubernetes.io/cluster-service: "true"
    addonmanager.kubernetes.io/mode: Reconcile
rules:
  - apiGroups:
      - ""
    resources:
      - nodes
      - nodes/metrics
      - services
      - endpoints
      - pods
    verbs:
      - get
      - list
      - watch
  - apiGroups:
      - ""
    resources:
      - configmaps
    verbs:
      - get
  - nonResourceURLs:
      - "/metrics"
    verbs:
      - get
---
apiVersion: rbac.authorization.k8s.io/v1beta1
kind: ClusterRoleBinding
metadata:
  name: prometheus
  labels:
    kubernetes.io/cluster-service: "true"
    addonmanager.kubernetes.io/mode: Reconcile
roleRef:
  apiGroup: rbac.authorization.k8s.io
  kind: ClusterRole
  name: prometheus
subjects:
- kind: ServiceAccount
  name: prometheus
  namespace: kube-system

[root@k8s-master prometheus-k8s]# kubectl create -f prometheus-rbac.yaml
Now create configmap,
rule_files:
- /etc/config/rules/*.rules
This is the directory written to the alarm rules, that is, the configmap will be mounted in Prometheus and let the main process read these configurations.
 scrape_configs:
    - job_name: prometheus
      static_configs:
      - targets:
        - localhost:9090
These are to configure the monitoring end, job_name is grouped, which is to monitor itself, there are monitoring nodes below, we will set up a nodeport on the node, here to modify to monitor node nodes.
scrape_interval: 30s: Time collected here, data collected every few seconds
 Here is also the name of the alerting service.
    alerting:
      alertmanagers:
      - static_configs:
          - targets: ["alertmanager:80"]
[root@k8s-master prometheus-k8s]# kubectl create -f prometheus-configmap.yaml
[root@k8s-master prometheus-k8s]# cat prometheus-configmap.yaml
# Prometheus configuration format https://prometheus.io/docs/prometheus/latest/configuration/configuration/
apiVersion: v1
kind: ConfigMap
metadata:
name: prometheus-config
namespace: kube-system
labels:
kubernetes.io/cluster-service: "true"
addonmanager.kubernetes.io/mode: EnsureExists
data:
prometheus.yml: |
rule_files:
- /etc/config/rules/*.rules
scrape_configs:
- job_name: prometheus
static_configs:
- targets:
- localhost:9090
- job_name: kubernetes-nodes
scrape_interval: 30s
static_configs:
- targets:
- 192.168.30.22:9100
- 192.168.30.23:9100
- job_name: kubernetes-apiservers
kubernetes_sd_configs:
- role: endpoints
relabel_configs:
- action: keep
regex: default;kubernetes;https
source_labels:
- __meta_kubernetes_namespace
- __meta_kubernetes_service_name
- __meta_kubernetes_endpoint_port_name
scheme: https
tls_config:
ca_file: /var/run/secrets/kubernetes.io/serviceaccount/ca.crt
insecure_skip_verify: true
bearer_token_file: /var/run/secrets/kubernetes.io/serviceaccount/token
- job_name: kubernetes-nodes-kubelet
kubernetes_sd_configs:
- role: node
relabel_configs:
- action: labelmap
regex: __meta_kubernetes_node_label_(.+)
scheme: https
tls_config:
ca_file: /var/run/secrets/kubernetes.io/serviceaccount/ca.crt
insecure_skip_verify: true
bearer_token_file: /var/run/secrets/kubernetes.io/serviceaccount/token
- job_name: kubernetes-nodes-cadvisor
kubernetes_sd_configs:
- role: node
relabel_configs:
- action: labelmap
regex: __meta_kubernetes_node_label_(.+)
- target_label: __metrics_path__
replacement: /metrics/cadvisor
scheme: https
tls_config:
ca_file: /var/run/secrets/kubernetes.io/serviceaccount/ca.crt
insecure_skip_verify: true
bearer_token_file: /var/run/secrets/kubernetes.io/serviceaccount/token
- job_name: kubernetes-service-endpoints
kubernetes_sd_configs:
- role: endpoints
relabel_configs:
- action: keep
regex: true
source_labels:
- __meta_kubernetes_service_annotation_prometheus_io_scrape
- action: replace
regex: (https?)
source_labels:
- __meta_kubernetes_service_annotation_prometheus_io_scheme
target_label: __scheme__
- action: replace
regex: (.+)
source_labels:
- __meta_kubernetes_service_annotation_prometheus_io_path
target_label: __metrics_path__
- action: replace
regex: ([^:]+)(?::\d+)?;(\d+)
replacement: $1:$2
source_labels:
- __address__
- __meta_kubernetes_service_annotation_prometheus_io_port
target_label: __address__
- action: labelmap
regex: __meta_kubernetes_service_label_(.+)
- action: replace
source_labels:
- __meta_kubernetes_namespace
target_label: kubernetes_namespace
- action: replace
source_labels:
- __meta_kubernetes_service_name
target_label: kubernetes_name
- job_name: kubernetes-services
kubernetes_sd_configs:
- role: service
metrics_path: /probe
params:
module:
- http_2xx
relabel_configs:
- action: keep
regex: true
source_labels:
- __meta_kubernetes_service_annotation_prometheus_io_probe
- source_labels:
- __address__
target_label: __param_target
- replacement: blackbox
target_label: __address__
- source_labels:
- __param_target
target_label: instance
- action: labelmap
regex: __meta_kubernetes_service_label_(.+)
- source_labels:
- __meta_kubernetes_namespace
target_label: kubernetes_namespace
- source_labels:
- __meta_kubernetes_service_name
target_label: kubernetes_name
- job_name: kubernetes-pods
kubernetes_sd_configs:
- role: pod
relabel_configs:
- action: keep
regex: true
source_labels:
- __meta_kubernetes_pod_annotation_prometheus_io_scrape
- action: replace
regex: (.+)
source_labels:
- __meta_kubernetes_pod_annotation_prometheus_io_path
target_label: __metrics_path__
- action: replace
regex: ([^:]+)(?::\d+)?;(\d+)
replacement: $1:$2
source_labels:
- __address__
- __meta_kubernetes_pod_annotation_prometheus_io_port
target_label: __address__
- action: labelmap
regex: __meta_kubernetes_pod_label_(.+)
- action: replace
source_labels:
- __meta_kubernetes_namespace
target_label: kubernetes_namespace
- action: replace
source_labels:
- __meta_kubernetes_pod_name
target_label: kubernetes_pod_name
alerting:
alertmanagers:
- static_configs:
- targets: ["alertmanager:80"]To reconfigure this role, this is to configure the alarm rules. There are two alarm rules. One is a general alarm rule, which applies to all instances. If the instance hangs up, then send an alarm. The instance is the agent of the monitored end, and there is a node role. This role monitors the CPU, memory and memory of each node. Disk utilization. In prometheus, the alarm value is written by promQL to query a data comparison. If the expression of this comparison is true, trigger the current alarm, such as the following one, and then push the alarm to alert manager to process the information. Alarm.
expr: 100 - (node_memory_MemFree_bytes+node_memory_Cached_bytes+node_memory_Buffers_bytes) / node_memory_MemTotal_bytes * 100 > 80
[root@k8s-master prometheus-k8s]# kubectl create -f prometheus-rules.yaml
[root@k8s-master prometheus-k8s]# cat prometheus-rules.yaml
apiVersion: v1
kind: ConfigMap
metadata:
name: prometheus-rules
namespace: kube-system
data:
general.rules: |
groups:
- name: general.rules
rules:
- alert: InstanceDown
expr: up == 0
for: 1m
labels:
severity: error
annotations:
summary: "Instance {{ $labels.instance }} Stop working"
description: "{{ $labels.instance }} job {{ $labels.job }} It has stopped for more than five minutes.."
node.rules: |
groups:
- name: node.rules
rules:
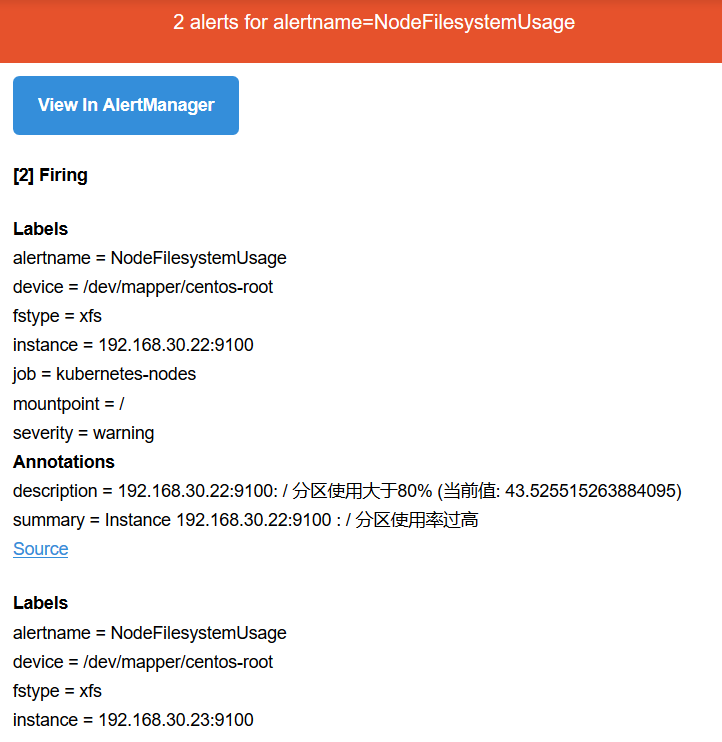
- alert: NodeFilesystemUsage
expr: 100 - (node_filesystem_free_bytes{fstype=~"ext4|xfs"} / node_filesystem_size_bytes{fstype=~"ext4|xfs"} * 100) > 80
for: 1m
labels:
severity: warning
annotations:
summary: "Instance {{ $labels.instance }} : {{ $labels.mountpoint }} High partition utilization"
description: "{{ $labels.instance }}: {{ $labels.mountpoint }} Partition usage greater than 80% (Current value: {{ $value }})"
- alert: NodeMemoryUsage
expr: 100 - (node_memory_MemFree_bytes+node_memory_Cached_bytes+node_memory_Buffers_bytes) / node_memory_MemTotal_bytes * 100 > 80
for: 1m
labels:
severity: warning
annotations:
summary: "Instance {{ $labels.instance }} High memory usage"
description: "{{ $labels.instance }}Memory usage greater than 80% (Current value: {{ $value }})"
- alert: NodeCPUUsage
expr: 100 - (avg(irate(node_cpu_seconds_total{mode="idle"}[5m])) by (instance) * 100) > 60
for: 1m
labels:
severity: warning
annotations:
summary: "Instance {{ $labels.instance }} CPU High utilization rate"
description: "{{ $labels.instance }}CPU Use greater than 60% (Current value: {{ $value }})"Then deploy the statefulset
- name: prometheus-server-configmap-reload: This is mainly to reload the configuration file of prometheus. Here is the main server of prometheus, which is used to start the service of prometheus. In addition, the / data directory is persisted. The configuration file uses configmap, and the alarm rules are stored from configmap. Here or Our dynamic creation of pv storage class, named managed-nfs-storage
[root@k8s-master prometheus-k8s]# cat prometheus-statefulset.yaml
apiVersion: apps/v1
kind: StatefulSet
metadata:
  name: prometheus
  namespace: kube-system
  labels:
    k8s-app: prometheus
    kubernetes.io/cluster-service: "true"
    addonmanager.kubernetes.io/mode: Reconcile
    version: v2.2.1
spec:
  serviceName: "prometheus"
  replicas: 1
  podManagementPolicy: "Parallel"
  updateStrategy:
   type: "RollingUpdate"
  selector:
    matchLabels:
      k8s-app: prometheus
  template:
    metadata:
      labels:
        k8s-app: prometheus
      annotations:
        scheduler.alpha.kubernetes.io/critical-pod: ''
    spec:
      priorityClassName: system-cluster-critical
      serviceAccountName: prometheus
      initContainers:
      - name: "init-chown-data"
        image: "busybox:latest"
        imagePullPolicy: "IfNotPresent"
        command: ["chown", "-R", "65534:65534", "/data"]
        volumeMounts:
        - name: prometheus-data
          mountPath: /data
          subPath: ""
      containers:
        - name: prometheus-server-configmap-reload
          image: "jimmidyson/configmap-reload:v0.1"
          imagePullPolicy: "IfNotPresent"
          args:
            - --volume-dir=/etc/config
            - --webhook-url=http://localhost:9090/-/reload
          volumeMounts:
            - name: config-volume
              mountPath: /etc/config
              readOnly: true
          resources:
            limits:
              cpu: 10m
              memory: 10Mi
            requests:
              cpu: 10m
              memory: 10Mi

        - name: prometheus-server
          image: "prom/prometheus:v2.2.1"
          imagePullPolicy: "IfNotPresent"
          args:
            - --config.file=/etc/config/prometheus.yml
            - --storage.tsdb.path=/data
            - --web.console.libraries=/etc/prometheus/console_libraries
            - --web.console.templates=/etc/prometheus/consoles
            - --web.enable-lifecycle
          ports:
            - containerPort: 9090
          readinessProbe:
            httpGet:
              path: /-/ready
              port: 9090
            initialDelaySeconds: 30
            timeoutSeconds: 30
          livenessProbe:
            httpGet:
              path: /-/healthy
              port: 9090
            initialDelaySeconds: 30
            timeoutSeconds: 30
          # based on 10 running nodes with 30 pods each
          resources:
            limits:
              cpu: 200m
              memory: 1000Mi
            requests:
              cpu: 200m
              memory: 1000Mi

          volumeMounts:
            - name: config-volume
              mountPath: /etc/config
            - name: prometheus-data
              mountPath: /data
              subPath: ""
            - name: prometheus-rules
              mountPath: /etc/config/rules

      terminationGracePeriodSeconds: 300
      volumes:
        - name: config-volume
          configMap:
            name: prometheus-config
        - name: prometheus-rules
          configMap:
            name: prometheus-rules

  volumeClaimTemplates:
  - metadata:
      name: prometheus-data
    spec:
      storageClassName: managed-nfs-storage
      accessModes:
        - ReadWriteOnce
      resources:
        requests:
          storage: "16Gi"
Here, because I built the pvc dynamically created by NFS and used the network storage made by nfs, there is no demonstration here. You can see my previous blog, and then I have created it here.
[root@k8s-master prometheus-k8s]# kubectl get pod -n kube-system
NAME                                 READY   STATUS    RESTARTS   AGE
coredns-bccdc95cf-kqxwv              1/1     Running   3          2d4h
coredns-bccdc95cf-nwkbp              1/1     Running   3          2d4h
etcd-k8s-master                      1/1     Running   2          2d4h
kube-apiserver-k8s-master            1/1     Running   2          2d4h
kube-controller-manager-k8s-master   1/1     Running   5          2d4h
kube-flannel-ds-amd64-dc5z9          1/1     Running   1          2d4h
kube-flannel-ds-amd64-jm2jz          1/1     Running   1          2d4h
kube-flannel-ds-amd64-z6tt2          1/1     Running   1          2d4h
kube-proxy-9ltx7                     1/1     Running   2          2d4h
kube-proxy-lnzrj                     1/1     Running   1          2d4h
kube-proxy-v7dqm                     1/1     Running   1          2d4h
kube-scheduler-k8s-master            1/1     Running   5          2d4h
prometheus-0                         2/2     Running   0          3m3s
Then take a look at the service. We use the Nodeport type and the port 9090. Of course, ingress can also be used to expose
[root@k8s-master prometheus-k8s]# cat prometheus-service.yaml
kind: Service
apiVersion: v1
metadata:
  name: prometheus
  namespace: kube-system
  labels:
    kubernetes.io/name: "Prometheus"
    kubernetes.io/cluster-service: "true"
    addonmanager.kubernetes.io/mode: Reconcile
spec:
  type: NodePort
  ports:
    - name: http
      port: 9090
      protocol: TCP
      targetPort: 9090
  selector:
    k8s-app: prometheus
Now you can visit random port 32276. Our prometheus has been successfully deployed.
[root@k8s-master prometheus-k8s]# kubectl create -f prometheus-service.yaml
[root@k8s-master prometheus-k8s]# kubectl get svc -n kube-system
NAME         TYPE        CLUSTER-IP   EXTERNAL-IP   PORT(S)                  AGE
kube-dns     ClusterIP   10.1.0.10    <none>        53/UDP,53/TCP,9153/TCP   2d4h
prometheus   NodePort    10.1.58.1    <none>        9090:32276/TCP           22s
A very concise UI page, there is no good function, it is difficult to meet the requirements of enterprise UI, but only a debugging here, which mainly writes promQL expression, how to check this data, just like mysql's SQL, to query your data, you can debug in status, and the conf in it. Ig config uration file we added alarm pre-value, increased support for nodeport and specified the address of alert manager, then rules, we also planned two pieces, one is general rules, the other is node rules, mainly monitoring three blocks, memory, disk, CPU.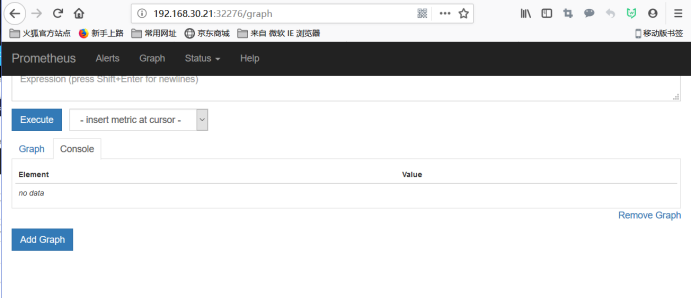
Now look at CPU utilization, usually using Grafana to show.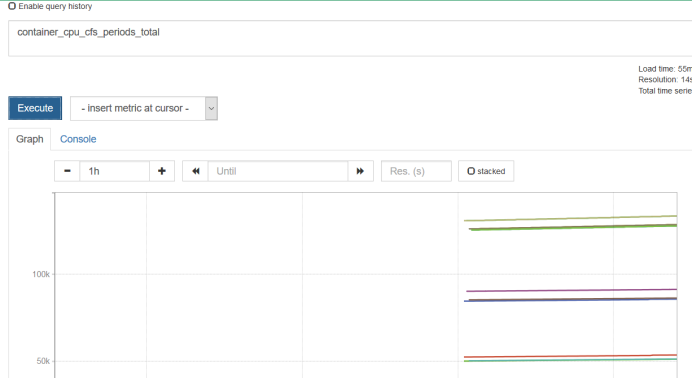
V. Deployment of Grafana on K8S Platform
This is also done with stateful set. It also creates pv automatically. The port defined is 30007.
[root@k8s-master prometheus-k8s]# cat grafana.yaml
apiVersion: apps/v1
kind: StatefulSet
metadata:
  name: grafana
  namespace: kube-system
spec:
  serviceName: "grafana"
  replicas: 1
  selector:
    matchLabels:
      app: grafana
  template:
    metadata:
      labels:
        app: grafana
    spec:
      containers:
      - name: grafana
        image: grafana/grafana
        ports:
          - containerPort: 3000
            protocol: TCP
        resources:
          limits:
            cpu: 100m
            memory: 256Mi
          requests:
            cpu: 100m
            memory: 256Mi
        volumeMounts:
          - name: grafana-data
            mountPath: /var/lib/grafana
            subPath: grafana
      securityContext:
        fsGroup: 472
        runAsUser: 472
  volumeClaimTemplates:
  - metadata:
      name: grafana-data
    spec:
      storageClassName: managed-nfs-storage
      accessModes:
        - ReadWriteOnce
      resources:
        requests:
          storage: "1Gi"

---

apiVersion: v1
kind: Service
metadata:
  name: grafana
  namespace: kube-system
spec:
  type: NodePort
  ports:
  - port : 80
    targetPort: 3000
    nodePort: 30007
  selector:
app: grafana
The default password is admin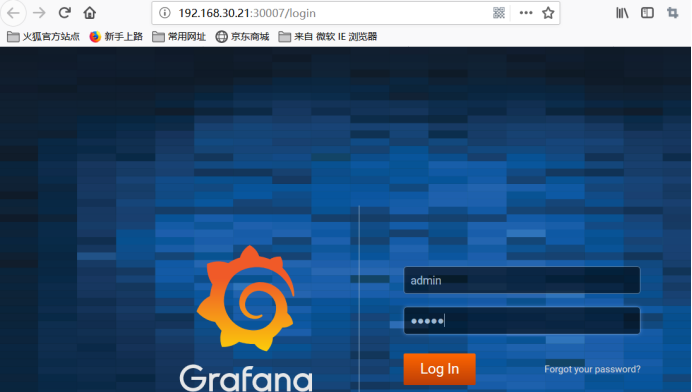
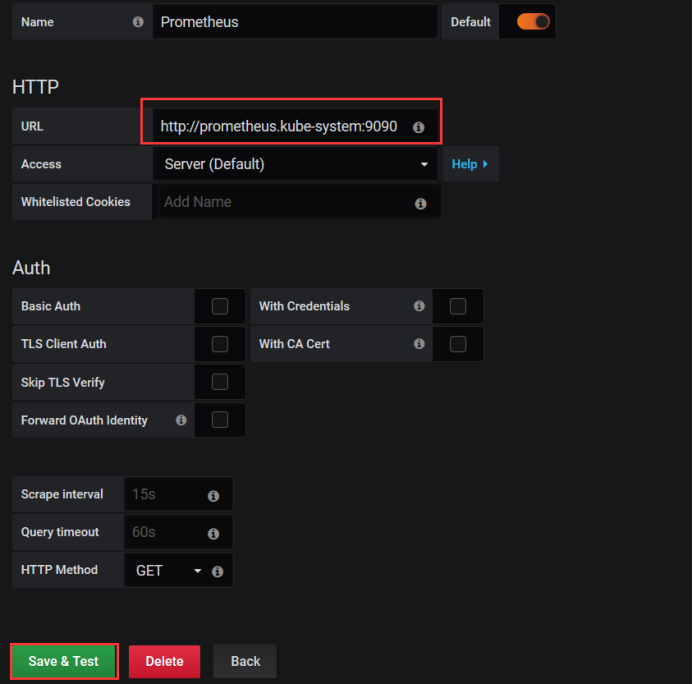
First, we will use Prometheus as the data source, add a data source and select prometheus.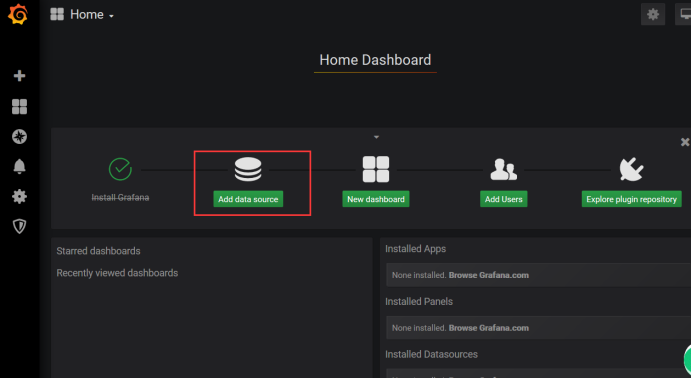
Add a URL address that can either write the address of the UI page you visit or the address of the service.
[root@k8s-master prometheus-k8s]# kubectl get svc -n kube-system
NAME         TYPE        CLUSTER-IP     EXTERNAL-IP   PORT(S)                  AGE
grafana      NodePort    10.1.246.143   <none>        80:30007/TCP             11m
kube-dns     ClusterIP   10.1.0.10      <none>        53/UDP,53/TCP,9153/TCP   2d5h
prometheus   NodePort    10.1.58.1      <none>        9090:32276/TCP           40m
Looking at the data source already has one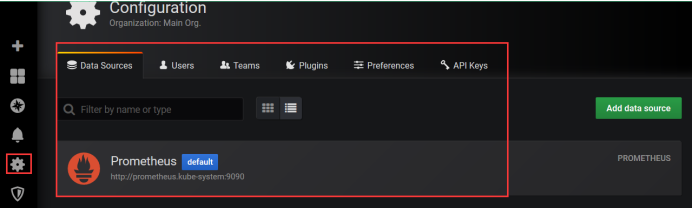
6. Monitoring Pod, Node and Resource Objects in K8S Cluster
Pod
The kubelet node uses metrics interface provided by cAdvisor to obtain all Pod and container-related performance metrics data of the node.
That is, kubelet exposes two interface addresses:
https://NodeIP:10255/metrics/cadvisor read-only
https://NodeIP:10250/metrics/cadvisor kubelet's API, authorization can do anything if it's okay
Look at the node node. This port is mainly used for accessing some API authentication of kubelet and providing some cAdvisor metrics. When we deployed prometheus, we began to collect cAdvisor data. Why did we collect cAdvisor data? Because the Prometheus configuration file already defines how to collect data?
[root@k8s-node1 ~]# netstat -antp |grep 10250
tcp6       0      0 :::10250                :::*                    LISTEN      107557/kubelet
tcp6       0      0 192.168.30.22:10250     192.168.30.23:58692     ESTABLISHED 107557/kubelet
tcp6       0      0 192.168.30.22:10250     192.168.30.23:46555     ESTABLISHED 107557/kubelet
Node
Use node_exporter collector to collect node resource utilization.
https://github.com/prometheus/node_exporter
Use documentation: https://prometheus.io/docs/guides/node-exporter/
Resource Object
kube-state-metrics collects state information of various resource objects in k8s.
https://github.com/kubernetes/kube-state-metrics
Now import a template that can view the pod data, that is, display the data more intuitively through the template.
7. Visualizing Prometheus Monitoring Data with Grafana
Recommended template: that is, in the grafana Sharing Center, that is, the template written by others is uploaded to the library, you can write, write and upload, others can access, the following is the template id, as long as you get this ID, you can use the template, as long as this template, the back-end provides execution P. RomeQL, as long as you have data, you can show it.
Grafana.com
Cluster resource monitoring: 3119
Resource status monitoring: 6417
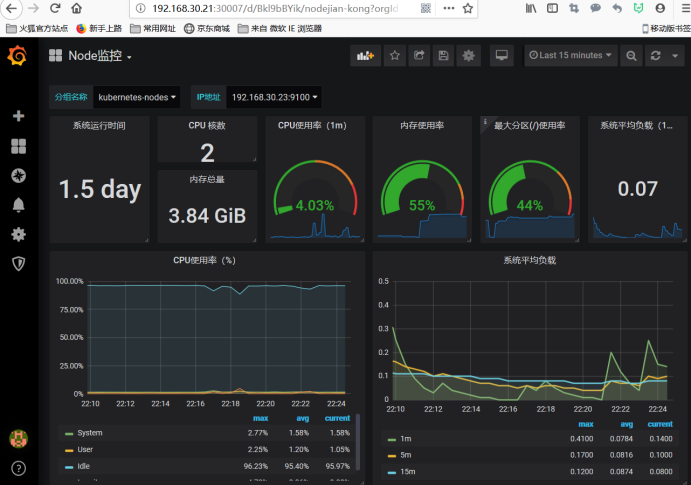
Node monitoring: 9276
Now use this 3319 template to show the resources of our cluster, open the add template, and select dashboard.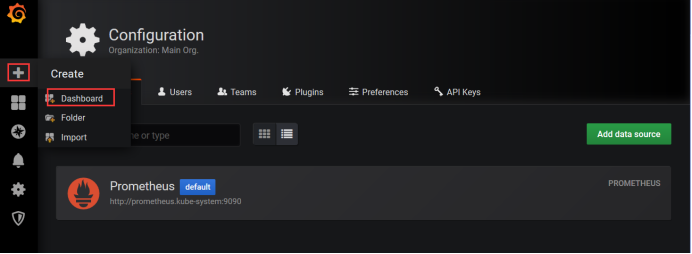
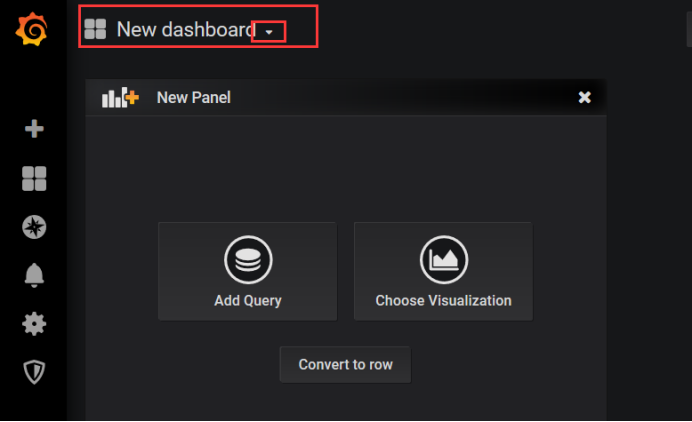
Select Import Template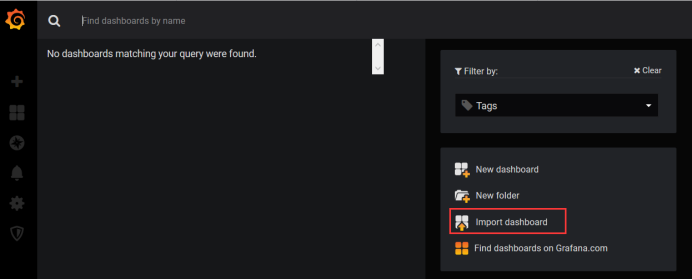
Write 3119, it can automatically help you identify the template name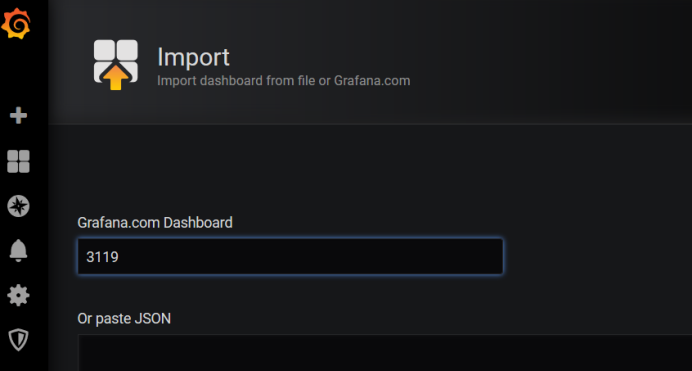
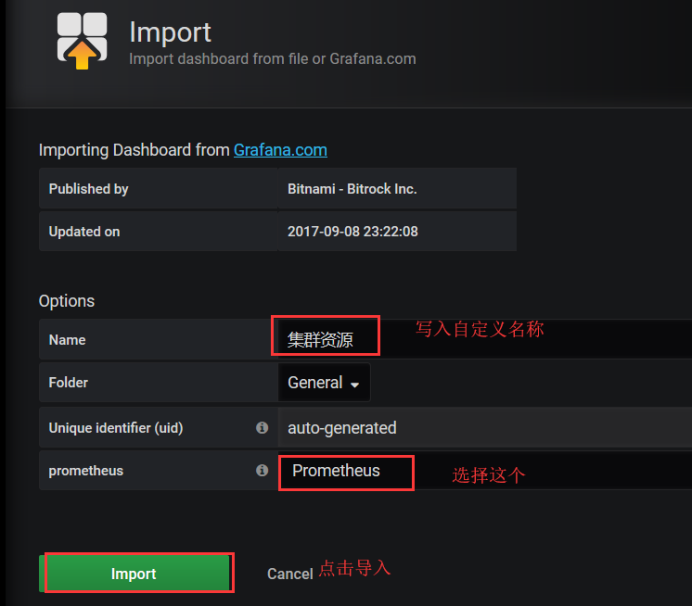
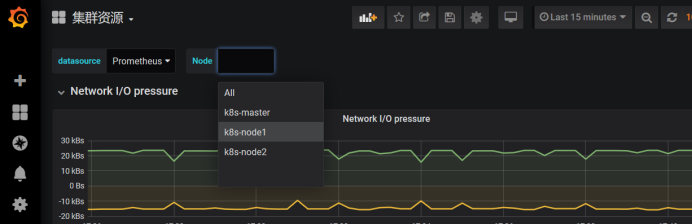
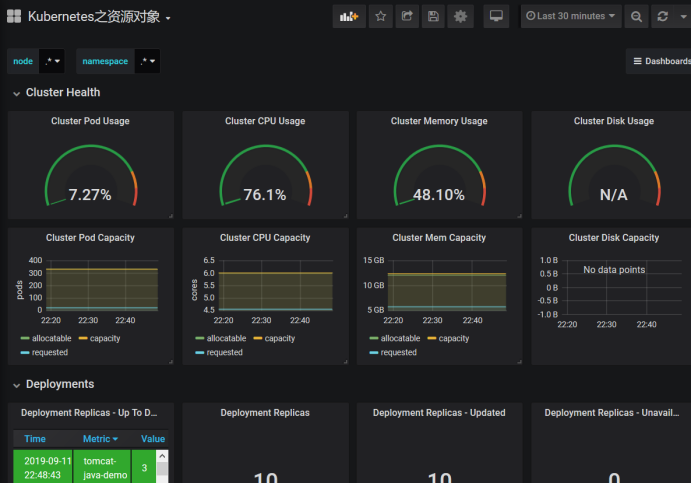
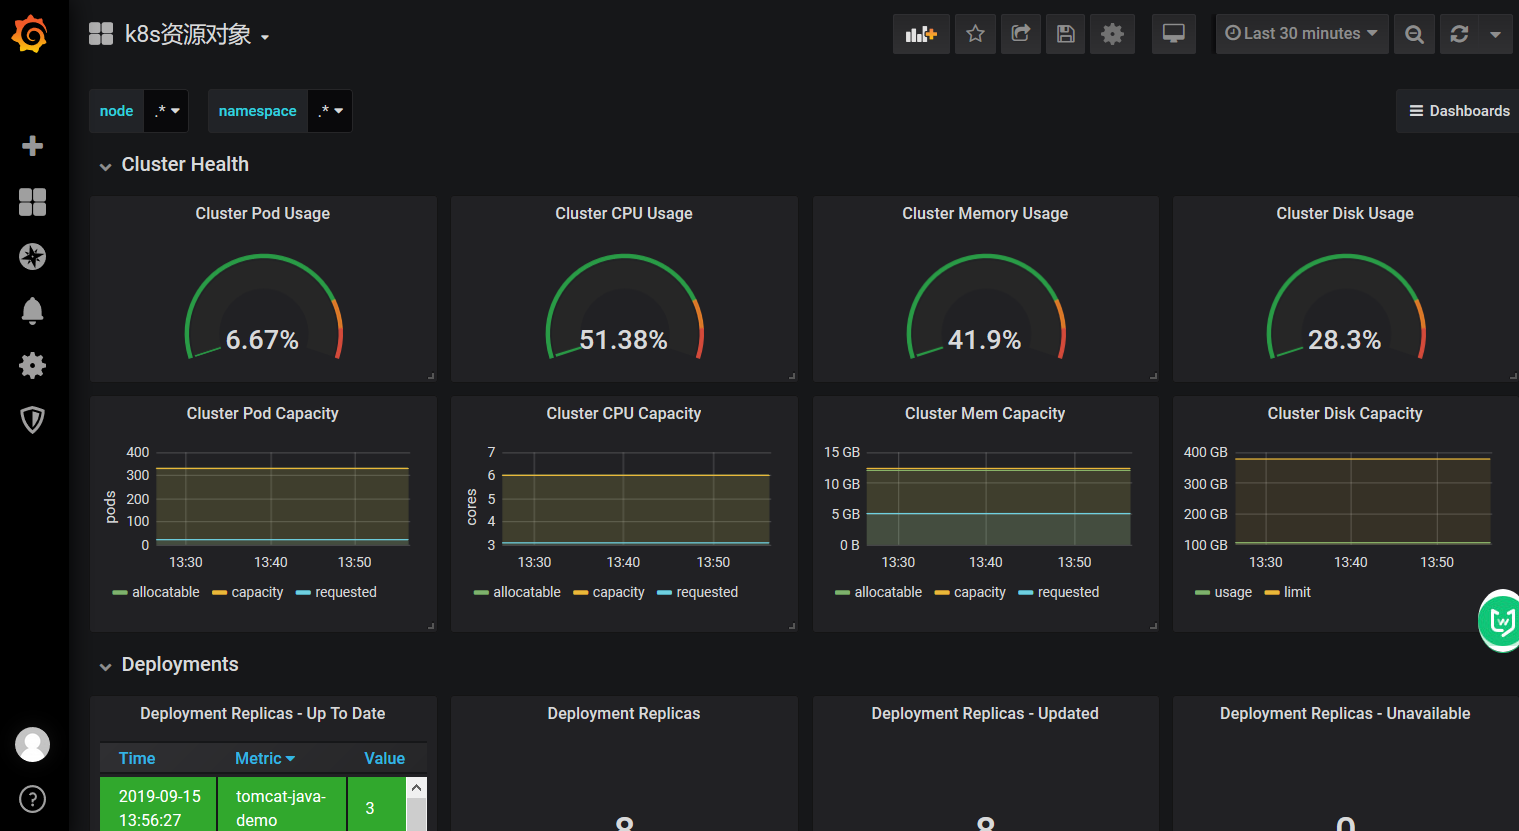
Because they all have data, you can view all the cluster resources directly.
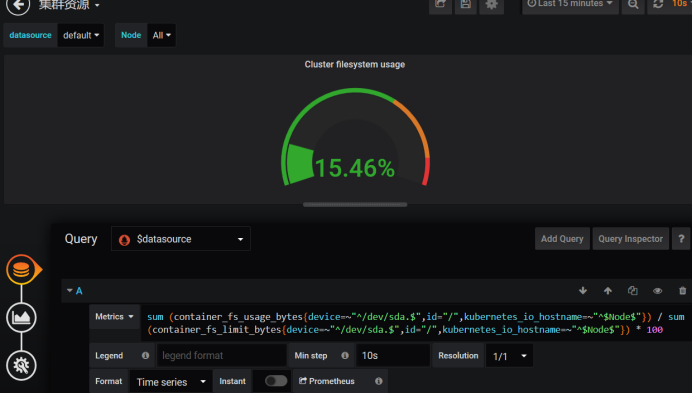
Here is a graph of network IO. One is receiving, the other is sending.
Here's how cluster memory is used
Here is 4G, only 3.84G is recognized, 2.26G is used, CPU is dual-core, 0.11 is used, the right is the cluster file system, but not shown, we can see how it is written PromQL, take this written promQL to promQL Ui to test whether there is data, generally not matched to the data caused by.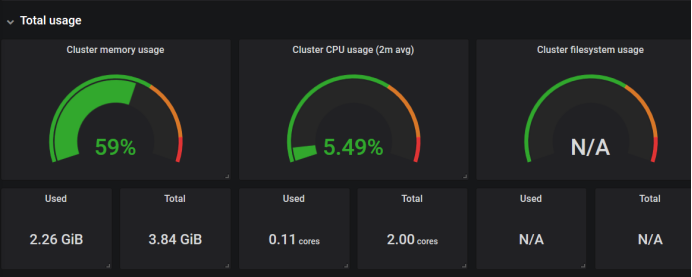
Let's see how this works out.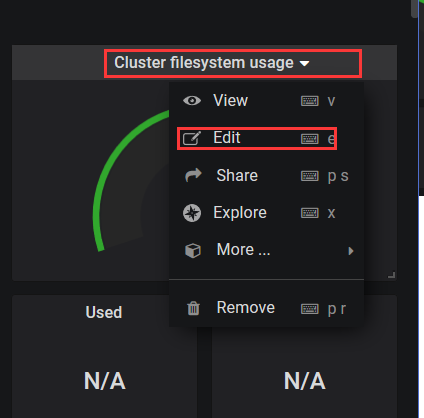
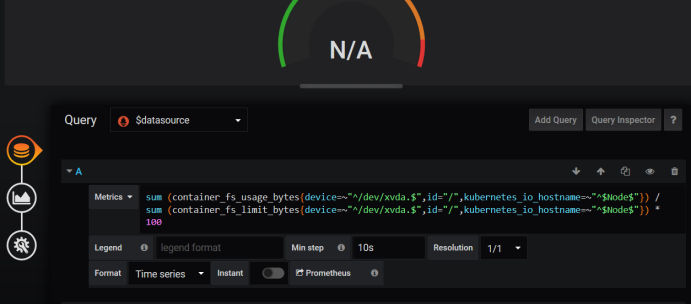
Take this data to compare, find the data, delete bit by bit, now we find the data, here is the name of the matching your node, according to this we find, because the template is uploaded by others, we use our own content to match, here can match the relevant promQL, and then Change our promQL for grafana. Now we've got the data.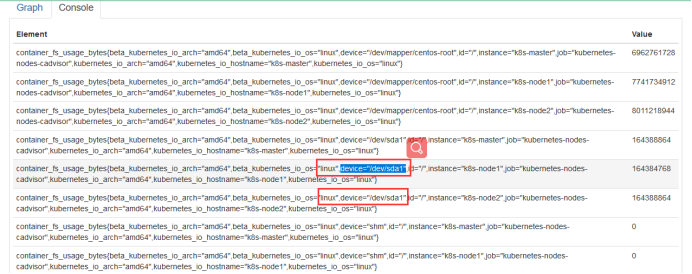
In addition, we may also do some monitoring of other templates. We can find some templates in Grafana's office, but some of them may not work. We need to modify them, such as inputting k8s, which is to monitor the etcd cluster.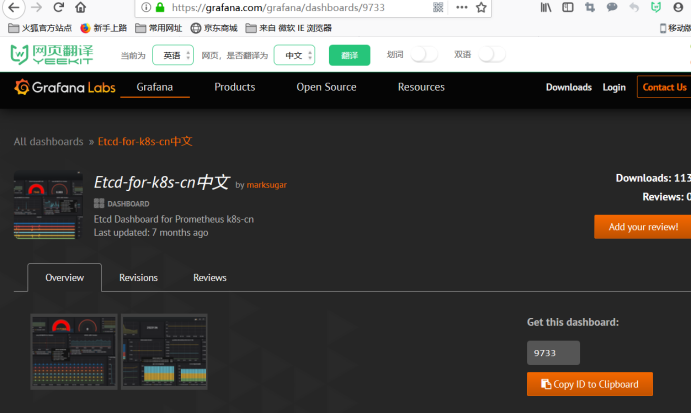
Node
Use node_exporter collector to collect node resource utilization.
https://github.com/prometheus/node_exporter
Use documentation: https://prometheus.io/docs/guides/node-exporter/
This is not currently deployed using pod, because it does not show the utilization of a disk. Officials have given a statfulset way to display the disk, but it can also be deployed on node nodes in a daemon way. This deployment is relatively simple, deployed in a binary way, on the host computer. Just start one on it.
Take a look at this script, which uses system D to filter the status of service startup monitoring. If the daemon hangs, it will also be collected by Prometheus, which is the following parameter.
--collector.systemd --collector.systemd.unit-whitelist=(docker|kubelet|kube-proxy|flanneld).service
[root@k8s-node1 ~]# bash node_exporter.sh
#!/bin/bash

wget https://github.com/prometheus/node_exporter/releases/download/v0.17.0/node_exporter-0.17.0.linux-amd64.tar.gz

tar zxf node_exporter-0.17.0.linux-amd64.tar.gz
mv node_exporter-0.17.0.linux-amd64 /usr/local/node_exporter

cat <<EOF >/usr/lib/systemd/system/node_exporter.service
[Unit]
Description=https://prometheus.io

[Service]
Restart=on-failure
ExecStart=/usr/local/node_exporter/node_exporter --collector.systemd --collector.systemd.unit-whitelist=(docker|kubelet|kube-proxy|flanneld).service

[Install]
WantedBy=multi-user.target
EOF

systemctl daemon-reload
systemctl enable node_exporter
systemctl restart node_exporter
prometheus is an active indicator of resource acquisition, not a passive push of data from the monitored end.
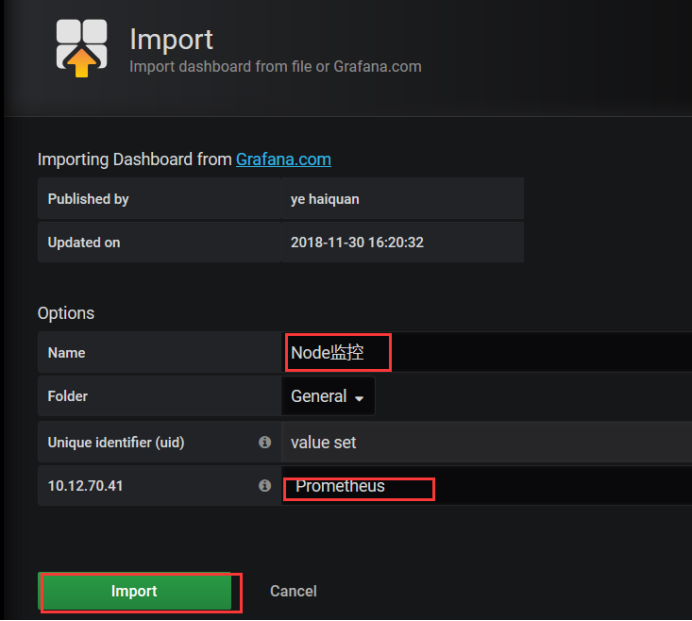
Then we use the 9276 template. We can import the template first.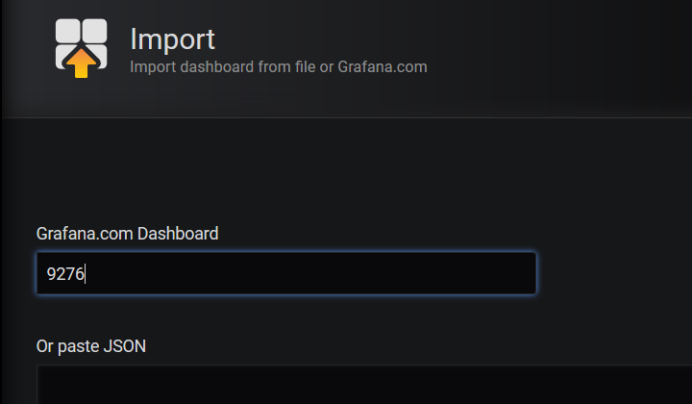
[root@k8s-node1 ~]# ps -ef |grep node_ex
root       5275      1  0 21:59 ?        00:00:03 /usr/local/node_exporter/node_exporter --collector.systemd --collector.systemd.unit-whitelist=(docker|kubelet|kube-proxy|flanneld).service
root       7393  81364  0 22:15 pts/1    00:00:00 grep --color=auto node_ex
Select nodes, where you can see the resource status of two nodes
Obtain network bandwidth failed, and then we can test this promeQL, generally this situation is to look at the interface name of the network card, some eth0, some ens32,ens33, this according to their own to write.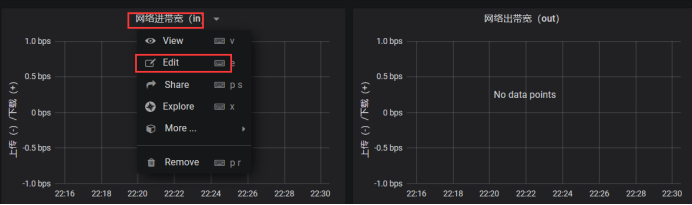
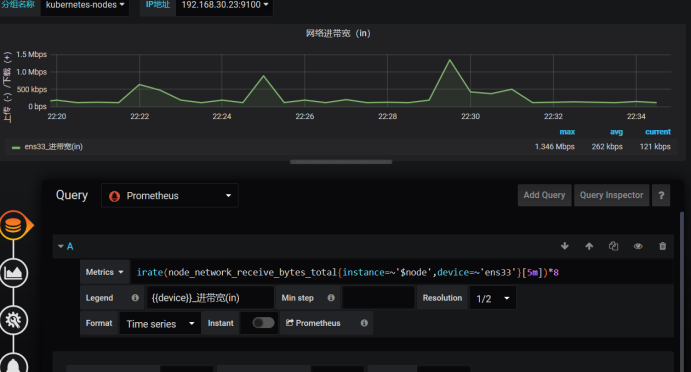
Click on this save
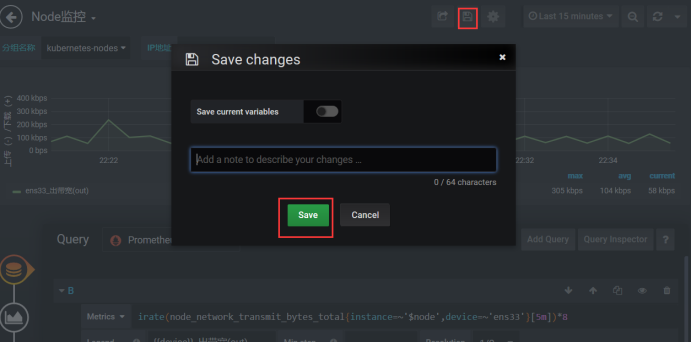
Now we have it.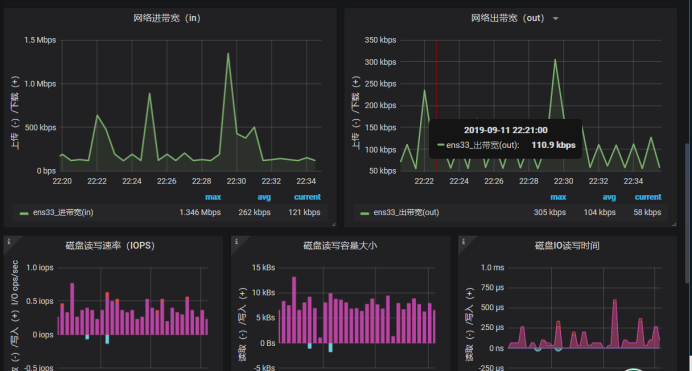
Monitoring of K8s Resource Objects
Specifically implement kube-state-metrics, this type of pod/deployment/service
This component is officially developed, through API to obtain the status of k8s resources, through metrics to complete data acquisition. For example, what is the number of copies, what is the current status, is to obtain these.
Of course, there are all these on github, just change the source of foreign countries into foreign ones, or mine. I have uploaded the mirror to docker hub.
https://github.com/kubernetes/kubernetes/tree/master/cluster/addons/prometheus
Create rbac authorization rules
[root@k8s-master prometheus-k8s]# cat kube-state-metrics-rbac.yaml
apiVersion: v1
kind: ServiceAccount
metadata:
  name: kube-state-metrics
  namespace: kube-system
  labels:
    kubernetes.io/cluster-service: "true"
    addonmanager.kubernetes.io/mode: Reconcile
---
apiVersion: rbac.authorization.k8s.io/v1
kind: ClusterRole
metadata:
  name: kube-state-metrics
  labels:
    kubernetes.io/cluster-service: "true"
    addonmanager.kubernetes.io/mode: Reconcile
rules:
- apiGroups: [""]
  resources:
  - configmaps
  - secrets
  - nodes
  - pods
  - services
  - resourcequotas
  - replicationcontrollers
  - limitranges
  - persistentvolumeclaims
  - persistentvolumes
  - namespaces
  - endpoints
  verbs: ["list", "watch"]
- apiGroups: ["extensions"]
  resources:
  - daemonsets
  - deployments
  - replicasets
  verbs: ["list", "watch"]
- apiGroups: ["apps"]
  resources:
  - statefulsets
  verbs: ["list", "watch"]
- apiGroups: ["batch"]
  resources:
  - cronjobs
  - jobs
  verbs: ["list", "watch"]
- apiGroups: ["autoscaling"]
  resources:
  - horizontalpodautoscalers
  verbs: ["list", "watch"]
---
apiVersion: rbac.authorization.k8s.io/v1
kind: Role
metadata:
  name: kube-state-metrics-resizer
  namespace: kube-system
  labels:
    kubernetes.io/cluster-service: "true"
    addonmanager.kubernetes.io/mode: Reconcile
rules:
- apiGroups: [""]
  resources:
  - pods
  verbs: ["get"]
- apiGroups: ["extensions"]
  resources:
  - deployments
  resourceNames: ["kube-state-metrics"]
  verbs: ["get", "update"]
---
apiVersion: rbac.authorization.k8s.io/v1
kind: ClusterRoleBinding
metadata:
  name: kube-state-metrics
  labels:
    kubernetes.io/cluster-service: "true"
    addonmanager.kubernetes.io/mode: Reconcile
roleRef:
  apiGroup: rbac.authorization.k8s.io
  kind: ClusterRole
  name: kube-state-metrics
subjects:
- kind: ServiceAccount
  name: kube-state-metrics
  namespace: kube-system
---
apiVersion: rbac.authorization.k8s.io/v1
kind: RoleBinding
metadata:
  name: kube-state-metrics
  namespace: kube-system
  labels:
    kubernetes.io/cluster-service: "true"
    addonmanager.kubernetes.io/mode: Reconcile
roleRef:
  apiGroup: rbac.authorization.k8s.io
  kind: Role
  name: kube-state-metrics-resizer
subjects:
- kind: ServiceAccount
  name: kube-state-metrics
  namespace: kube-system
Create deployment
[root@k8s-master prometheus-k8s]# cat kube-state-metrics-deployment.yaml
apiVersion: apps/v1
kind: Deployment
metadata:
  name: kube-state-metrics
  namespace: kube-system
  labels:
    k8s-app: kube-state-metrics
    kubernetes.io/cluster-service: "true"
    addonmanager.kubernetes.io/mode: Reconcile
    version: v1.3.0
spec:
  selector:
    matchLabels:
      k8s-app: kube-state-metrics
      version: v1.3.0
  replicas: 1
  template:
    metadata:
      labels:
        k8s-app: kube-state-metrics
        version: v1.3.0
      annotations:
        scheduler.alpha.kubernetes.io/critical-pod: ''
    spec:
      priorityClassName: system-cluster-critical
      serviceAccountName: kube-state-metrics
      containers:
      - name: kube-state-metrics
        image: zhaocheng172/kube-state-metrics:v1.3.0
        ports:
        - name: http-metrics
          containerPort: 8080
        - name: telemetry
          containerPort: 8081
        readinessProbe:
          httpGet:
            path: /healthz
            port: 8080
          initialDelaySeconds: 5
          timeoutSeconds: 5
      - name: addon-resizer
        image: zhaocheng172/addon-resizer:1.8.3
        resources:
          limits:
            cpu: 100m
            memory: 30Mi
          requests:
            cpu: 100m
            memory: 30Mi
        env:
          - name: MY_POD_NAME
            valueFrom:
              fieldRef:
                fieldPath: metadata.name
          - name: MY_POD_NAMESPACE
            valueFrom:
              fieldRef:
                fieldPath: metadata.namespace
        volumeMounts:
          - name: config-volume
            mountPath: /etc/config
        command:
          - /pod_nanny
          - --config-dir=/etc/config
          - --container=kube-state-metrics
          - --cpu=100m
          - --extra-cpu=1m
          - --memory=100Mi
          - --extra-memory=2Mi
          - --threshold=5
          - --deployment=kube-state-metrics
      volumes:
        - name: config-volume
          configMap:
            name: kube-state-metrics-config
---
# Config map for resource configuration.
apiVersion: v1
kind: ConfigMap
metadata:
  name: kube-state-metrics-config
  namespace: kube-system
  labels:
    k8s-app: kube-state-metrics
    kubernetes.io/cluster-service: "true"
    addonmanager.kubernetes.io/mode: Reconcile
data:
  NannyConfiguration: |-
    apiVersion: nannyconfig/v1alpha1
    kind: NannyConfiguration
Create exposed ports, using service
[root@k8s-master prometheus-k8s]# cat kube-state-metrics-service.yaml
apiVersion: v1
kind: Service
metadata:
  name: kube-state-metrics
  namespace: kube-system
  labels:
    kubernetes.io/cluster-service: "true"
    addonmanager.kubernetes.io/mode: Reconcile
    kubernetes.io/name: "kube-state-metrics"
  annotations:
    prometheus.io/scrape: 'true'
spec:
  ports:
  - name: http-metrics
    port: 8080
    targetPort: http-metrics
    protocol: TCP
  - name: telemetry
    port: 8081
    targetPort: telemetry
    protocol: TCP
  selector:
k8s-app: kube-state-metrics
After successful deployment, importing templates can monitor our data
[root@k8s-master prometheus-k8s]# kubectl get pod,svc -n kube-system
NAME                                      READY   STATUS    RESTARTS   AGE
pod/coredns-bccdc95cf-kqxwv               1/1     Running   3          2d9h
pod/coredns-bccdc95cf-nwkbp               1/1     Running   3          2d9h
pod/etcd-k8s-master                       1/1     Running   2          2d9h
pod/grafana-0                             1/1     Running   0          4h50m
pod/kube-apiserver-k8s-master             1/1     Running   2          2d9h
pod/kube-controller-manager-k8s-master    1/1     Running   5          2d9h
pod/kube-flannel-ds-amd64-dc5z9           1/1     Running   1          2d9h
pod/kube-flannel-ds-amd64-jm2jz           1/1     Running   1          2d9h
pod/kube-flannel-ds-amd64-z6tt2           1/1     Running   1          2d9h
pod/kube-proxy-9ltx7                      1/1     Running   2          2d9h
pod/kube-proxy-lnzrj                      1/1     Running   1          2d9h
pod/kube-proxy-v7dqm                      1/1     Running   1          2d9h
pod/kube-scheduler-k8s-master             1/1     Running   5          2d9h
pod/kube-state-metrics-6474469878-6kpxv   1/2     Running   0          4s
pod/kube-state-metrics-854b85d88-zl777    2/2     Running   0          35s
pod/prometheus-0                          2/2     Running   0          5h30m
Import a 6417 template as you did just now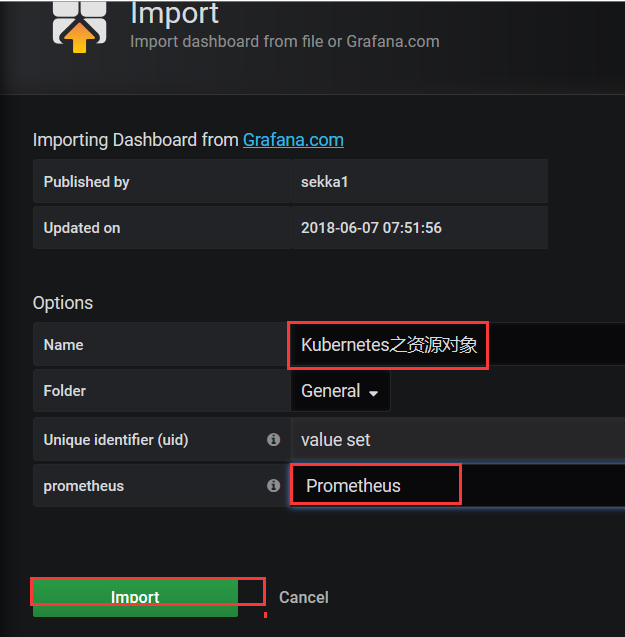
The data has now been shown, and it will get the data from the target, which is provided by prometheus automatically. The discovery is based on a comment in it, which is in service.
annotations:
prometheus.io/scrape: 'true'
That is to say, it states which applications are deployed, which can be automatically discovered by prometheus. If this rule is added, Prometheus will automatically monitor these annotated applications, that is, its own deployed applications, and provide corresponding indicators, which can also automatically detect these states.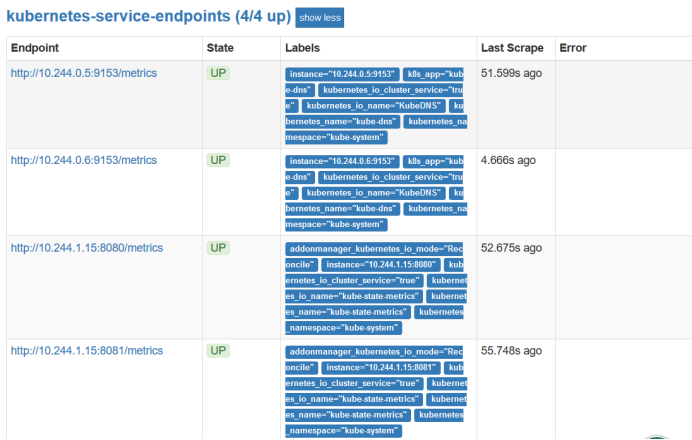
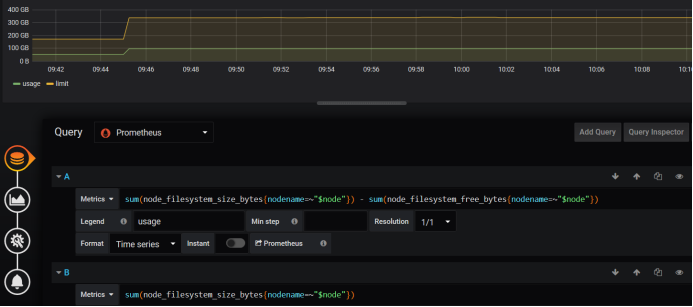
The disk needs to be changed here because it's updated here. Add bytes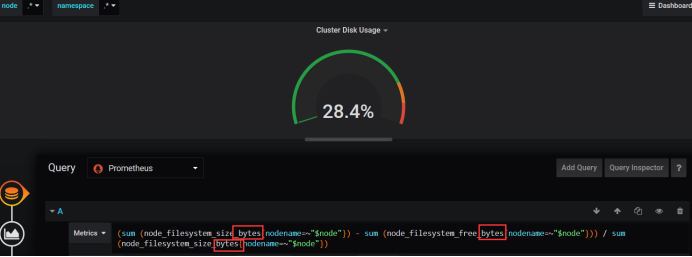
Here is the capacity of pods, the maximum number of pods can be created, that is, the kubelet to limit, a total of 330 pods can be created by a node, has been allocated 24.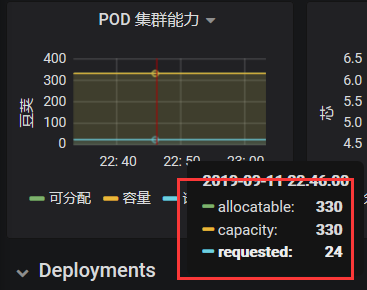
Summary:
So with these monitoring, we can basically understand the use status of the basic resources of k8s.
8. Warning Rules and Warning Notices
Deployment of Alert manager in K8S
In the previous words, alarm is used in k8s by Alert manager, which defines the rules to monitor the pre-value, such as the memory of node reaches 60% before alarm. Define these rules first. If the indicators collected by prometheus match this rule, it will send an alarm, and will send the alarm information. Push to
Alert manager, Alert manager, after a series of processing, eventually sent to the alarm hand, can be webhook, email, nail, enterprise Weixin. At present, we take email to do the following examples. Enterprise Weixin needs to register some relevant information business licenses of enterprises, etc., while webhook needs to dock with a third party system to adjust an interface. To pass values, email supports by default, prometheus does not support nails, if you want to support, you need to find a third party to do this data conversion component. Because promethes incoming data, it does not match the nail incoming data, all the intermediate program data conversion, and now there are open source to achieve.
That's the basic process. The rules we define are in prometheus.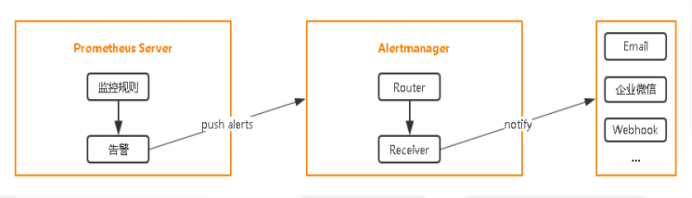
Deployment of Alert manager in K8S
- Deployment of Alert Manager
- Configure Prometheus to communicate with Alertmanager
- Configuration alarm
- prometheus specifies the rules directory
- Congmap Storage Alarm Rules
- configmap mounts to the container rules directory
- Added alert manager alarm configuration
Here is the definition of who sends this alert message and who receives it.
[root@k8s-master prometheus-k8s]# vim alertmanager-configmap.yaml
apiVersion: v1
kind: ConfigMap
metadata:
  name: alertmanager-config
  namespace: kube-system
  labels:
    kubernetes.io/cluster-service: "true"
    addonmanager.kubernetes.io/mode: EnsureExists
data:
  alertmanager.yml: |
    global:
      resolve_timeout: 5m
      smtp_smarthost: 'smtp.163.com:25'
      smtp_from: 'baojingtongzhi@163.com'
      smtp_auth_username: 'baojingtongzhi@163.com'
      smtp_auth_password: 'liang123'

    receivers:
    - name: default-receiver
      email_configs:
      - to: "17733661341@163.com"

    route:
      group_interval: 1m
      group_wait: 10s
      receiver: default-receiver
      repeat_interval: 1m
[root@k8s-master prometheus-k8s]# cat alertmanager-deployment.yaml
apiVersion: apps/v1
kind: Deployment
metadata:
name: alertmanager
namespace: kube-system
labels:
k8s-app: alertmanager
kubernetes.io/cluster-service: "true"
addonmanager.kubernetes.io/mode: Reconcile
version: v0.14.0
spec:
replicas: 1
selector:
matchLabels:
k8s-app: alertmanager
version: v0.14.0
template:
metadata:
labels:
k8s-app: alertmanager
version: v0.14.0
annotations:
scheduler.alpha.kubernetes.io/critical-pod: ''
spec:
priorityClassName: system-cluster-critical
containers:
- name: prometheus-alertmanager
image: "prom/alertmanager:v0.14.0"
imagePullPolicy: "IfNotPresent"
args:
- --config.file=/etc/config/alertmanager.yml
- --storage.path=/data
- --web.external-url=/
ports:
- containerPort: 9093
readinessProbe:
httpGet:
path: /#/status
port: 9093
initialDelaySeconds: 30
timeoutSeconds: 30
volumeMounts:
- name: config-volume
mountPath: /etc/config
- name: storage-volume
mountPath: "/data"
subPath: ""
resources:
limits:
cpu: 10m
memory: 50Mi
requests:
cpu: 10m
memory: 50Mi
- name: prometheus-alertmanager-configmap-reload
image: "jimmidyson/configmap-reload:v0.1"
imagePullPolicy: "IfNotPresent"
args:
- --volume-dir=/etc/config
- --webhook-url=http://localhost:9093/-/reload
volumeMounts:
- name: config-volume
mountPath: /etc/config
readOnly: true
resources:
limits:
cpu: 10m
memory: 10Mi
requests:
cpu: 10m
memory: 10Mi
volumes:
- name: config-volume
configMap:
name: alertmanager-config
- name: storage-volume
persistentVolumeClaim:
claimName: alertmanager
//Check out our pvc, which is also used here for our automatic supply managed-nfs-storage
[root@k8s-master prometheus-k8s]# cat alertmanager-pvc.yaml
apiVersion: v1
kind: PersistentVolumeClaim
metadata:
name: alertmanager
namespace: kube-system
labels:
kubernetes.io/cluster-service: "true"
addonmanager.kubernetes.io/mode: EnsureExists
spec:
storageClassName: managed-nfs-storage
accessModes:
- ReadWriteOnce
resources:
requests:
storage: "2Gi"The cluster IP type is used here.
[root@k8s-master prometheus-k8s]# cat alertmanager-service.yaml
apiVersion: v1
kind: Service
metadata:
  name: alertmanager
  namespace: kube-system
  labels:
    kubernetes.io/cluster-service: "true"
    addonmanager.kubernetes.io/mode: Reconcile
    kubernetes.io/name: "Alertmanager"
spec:
  ports:
    - name: http
      port: 80
      protocol: TCP
      targetPort: 9093
  selector:
    k8s-app: alertmanager
  type: "ClusterIP"
And then create all our resources.
[root@k8s-master prometheus-k8s]# kubectl create -f alertmanager-configmap.yaml
[root@k8s-master prometheus-k8s]# kubectl create -f alertmanager-deployment.yaml
[root@k8s-master prometheus-k8s]# kubectl create -f alertmanager-pvc.yaml
[root@k8s-master prometheus-k8s]# kubectl create -f alertmanager-service.yaml
[root@k8s-master prometheus-k8s]# kubectl get pod -n kube-system
NAME                                  READY   STATUS    RESTARTS   AGE
alertmanager-5d75d5688f-xw2qg         2/2     Running   0          66s
coredns-bccdc95cf-kqxwv               1/1     Running   2          6d
coredns-bccdc95cf-nwkbp               1/1     Running   2          6d
etcd-k8s-master                       1/1     Running   1          6d
grafana-0                             1/1     Running   0          14h
kube-apiserver-k8s-master             1/1     Running   1          6d
kube-controller-manager-k8s-master    1/1     Running   2          6d
kube-flannel-ds-amd64-dc5z9           1/1     Running   1          5d23h
kube-flannel-ds-amd64-jm2jz           1/1     Running   1          5d23h
kube-flannel-ds-amd64-z6tt2           1/1     Running   1          6d
kube-proxy-9ltx7                      1/1     Running   2          6d
kube-proxy-lnzrj                      1/1     Running   1          5d23h
kube-proxy-v7dqm                      1/1     Running   1          5d23h
kube-scheduler-k8s-master             1/1     Running   2          6d
kube-state-metrics-6474469878-lkphv   2/2     Running   0          98m
prometheus-0                          2/2     Running   0          15h
Then you can see the alarm rules we set on our prometheus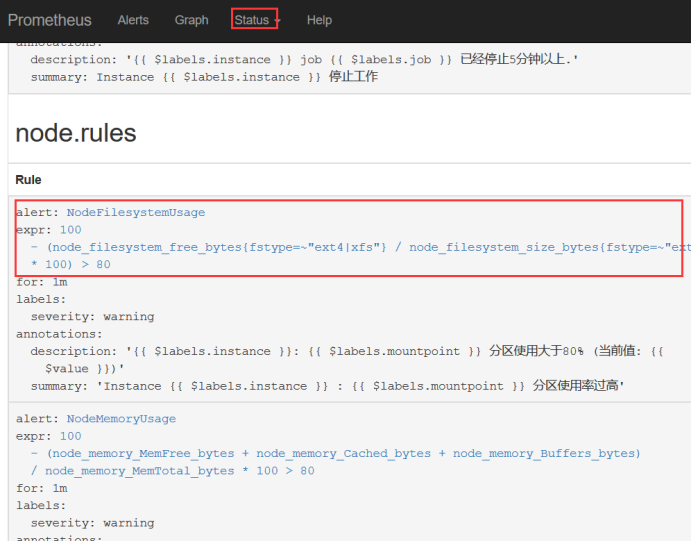
Then we test our alarms and modify our prometheus rules.
Alarm if node disk resource is set to > 20
[root@k8s-master prometheus-k8s]# vim prometheus-rules.yaml

- alert: NodeFilesystemUsage
        expr: 100 - (node_filesystem_free_bytes{fstype=~"ext4|xfs"} / node_filesystem_size_bytes{fstype=~"ext4|xfs"} * 100) > 20
Reconstruct the pod. This will start automatically. Check prometheus. It's already in effect. In addition, the production environment is to call the api and send a signal to the rules. Here I rebuild it. I can also find some other articles on the internet.
[root@k8s-master prometheus-k8s]# kubectl delete pod prometheus-0 -n kube-system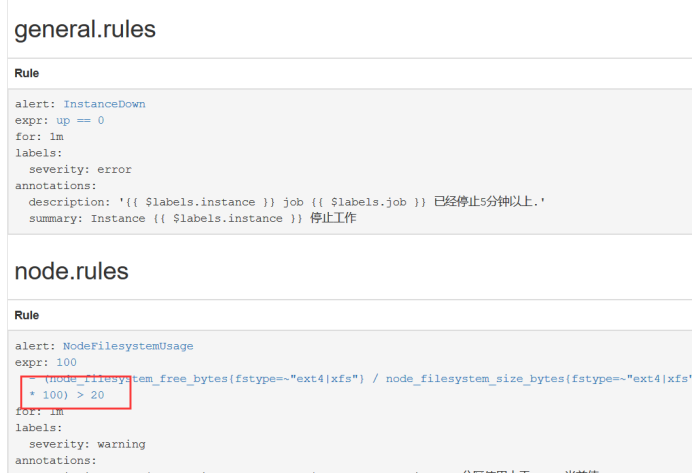
Look at Alerts, it will change color, it will turn red, that is, alert manager is a processing logic, or more complex, it will be designed to a silent, that is, the alarm convergence, there is a group, there is another waiting confirmation, all is not sent as soon as triggered.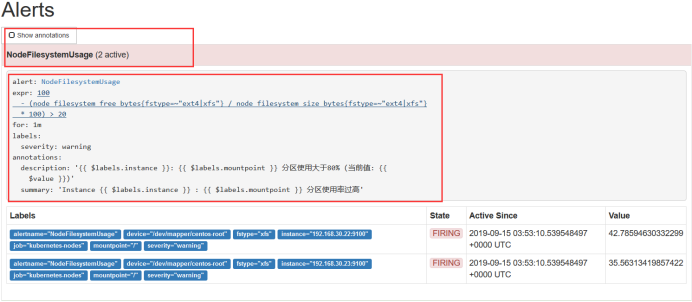
Pink has actually pushed the alarm to Alert manager, which is when the alarm message is sent.