Part One Summary
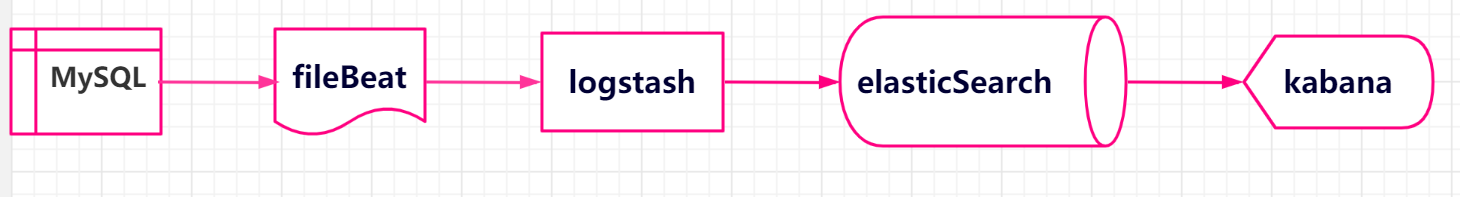
ELK is a log analysis platform that integrates distributed data storage, visual query and log resolution.ELK=elasticsearch+Logstash+kibana, each of which has its own duties, cooperates with each other to complete the data processing of the log.The main functions of each ELK component are as follows:
- elasticsearch, data storage, and full-text retrieval;
- logstash, Log Processing, Transporter;
- kibana: Visual data display and operation management.
We also use the filebeat plug-in to build the platform.Filebeat is a log data collector for local files that monitors the log directory or tail file and forwards data to Elasticsearch, Logstatsh, and so on.
The practice of this case is mainly to collect, manage and retrieve slow query logs and error logs of mysql instances through ELK.
A simple data flow chart is as follows:
Part Two: elasticsearch
2.1 ES Features and Advantages
- Distributed real-time file storage allows each field to be indexed so that it can be retrieved.
- Distributed search engine for real-time analysis.Distributed: The index is split into multiple tiles, each with zero or more copies; load rebalancing and routing are done automatically in most cases.
- It can be extended to hundreds of servers to handle structured or unstructured data at the PB level.It can also run on a single PC.
- Support plug-in mechanism, word breaking plug-in, synchronization plug-in, Hadoop plug-in, visualization plug-in, etc.
2.2 Key ES concepts
| ES Database | MySQL Database |
| Index | Database |
| Tpye [type is fixed after 7.0_doc] | Table |
| Document | Row |
| Field | Column |
| Mapping | Schema |
| Everything is indexed | Index |
| Query DSL[Descriptor structure language] | SQL |
| GET http://... | Select * from table ... |
| PUT http://... | Update table set ... |
- A database in a relational database (DataBase) is equivalent to an Index in ES.
- A relational database has N tables, equivalent to N multiple types under an Index index Index.
- Data in a database Table consists of multiple rows (ROW) and multiple columns (columns, attributes), equivalent to a Type consisting of multiple documents (Document s) and multiple Field s;
- In relational databases, schema defines tables, the fields of each table, and the relationships between tables and fields.Correspondingly, in ES: Mapping defines the field processing rules for Type under the index, that is, how the index is built, the type of index, whether the original index JSON document is saved, whether the original JSON document is compressed, whether word breaking is required, how word breaking is done, etc.
- Adding insert, deleting delete, changing update, and searching operations in relational databases are equivalent to adding PUT/POST, deleting Delete, changing_update, and searching GET in ES.
2.3 Execution Rights Issues
Error Alert
[usernimei@testes01 bin]$ Exception in thread "main" org.elasticsearch.bootstrap.BootstrapException: java.nio.file.AccessDeniedException: /data/elasticsearch/elasticsearch-7.4.2/config/elasticsearch.keystore
Likely root cause: java.nio.file.AccessDeniedException: /data/elasticsearch/elasticsearch-7.4.2/config/elasticsearch.keystore
    at java.base/sun.nio.fs.UnixException.translateToIOException(UnixException.java:90)
    at java.base/sun.nio.fs.UnixException.rethrowAsIOException(UnixException.java:111)
    at java.base/sun.nio.fs.UnixException.rethrowAsIOException(UnixException.java:116)
    at java.base/sun.nio.fs.UnixFileSystemProvider.newByteChannel(UnixFileSystemProvider.java:219)
    at java.base/java.nio.file.Files.newByteChannel(Files.java:374)
    at java.base/java.nio.file.Files.newByteChannel(Files.java:425)
    at org.apache.lucene.store.SimpleFSDirectory.openInput(SimpleFSDirectory.java:77)
    at org.elasticsearch.common.settings.KeyStoreWrapper.load(KeyStoreWrapper.java:219)
    at org.elasticsearch.bootstrap.Bootstrap.loadSecureSettings(Bootstrap.java:234)
    at org.elasticsearch.bootstrap.Bootstrap.init(Bootstrap.java:305)
    at org.elasticsearch.bootstrap.Elasticsearch.init(Elasticsearch.java:159)
    at org.elasticsearch.bootstrap.Elasticsearch.execute(Elasticsearch.java:150)
    at org.elasticsearch.cli.EnvironmentAwareCommand.execute(EnvironmentAwareCommand.java:86)
    at org.elasticsearch.cli.Command.mainWithoutErrorHandling(Command.java:125)
    at org.elasticsearch.cli.Command.main(Command.java:90)
    at org.elasticsearch.bootstrap.Elasticsearch.main(Elasticsearch.java:115)
    at org.elasticsearch.bootstrap.Elasticsearch.main(Elasticsearch.java:92)
Refer to the log for complete error details
problem analysis
The first time the root account was misused for startup, the elasticsearch.keystore permission under the path belongs to root
-rw-rw---- 1 root root 199 Mar 24 17:36 elasticsearch.keystore
Solution--Switch to root user to modify file elasticsearch.keystore permissions
Adjust to es user, i.e.
Chown-R es user: es user group elasticsearch.keystore
Question 2.4 maximum shards open problem
Officially, starting with Elasticsearch v7.0.0, there is a default limit of 1000 shards per node in the cluster, or up to 3000 shards if your es cluster has three data nodes.We only have one es here.So there's only 1,000.
[2019-05-11T11:05:24,650][WARN ][logstash.outputs.elasticsearch][main] Marking url as dead. Last error: [LogStash::Outputs::ElasticSearch::HttpClient::Pool::HostUnreachableError] Elasticsearch Unreachable: [http://qqelastic:xxxxxx@155.155.155.155:55944/][Manticore::SocketTimeout] Read timed out {:url=>http://qqelastic:xxxxxx@155.155.155.155:55944/, :error_message=>"Elasticsearch Unreachable: [http://qqelastic:xxxxxx@155.155.155.155:55944/][Manticore::SocketTimeout] Read timed out", :error_class=>"LogStash::Outputs::ElasticSearch::HttpClient::Pool::HostUnreachableError"}
[2019-05-11T11:05:24,754][ERROR][logstash.outputs.elasticsearch][main] Attempted to send a bulk request to elasticsearch' but Elasticsearch appears to be unreachable or down! {:error_message=>"Elasticsearch Unreachable: [http://qqelastic:xxxxxx@155.155.155.155:55944/][Manticore::SocketTimeout] Read timed out", :class=>"LogStash::Outputs::ElasticSearch::HttpClient::Pool::HostUnreachableError", :will_retry_in_seconds=>2}
[2019-05-11T11:05:25,158][WARN ][logstash.outputs.elasticsearch][main] Restored connection to ES instance {:url=>"http://qqelastic:xxxxxx@155.155.155.155:55944/"}
[2019-05-11T11:05:26,763][WARN ][logstash.outputs.elasticsearch][main] Could not index event to Elasticsearch. {:status=>400, :action=>["index", {:_id=>nil, :_index=>"mysql-error-testqq-2019.05.11", :routing=>nil, :_type=>"_doc"}, #<LogStash::Event:0x65416fce>], :response=>{"index"=>{"_index"=>"mysql-error-qqweixin-2020.05.11", "_type"=>"_doc", "_id"=>nil, "status"=>400, "error"=>{"type"=>"validation_exception", "reason"=>"Validation Failed: 1: this action would add [2] total shards, but this cluster currently has [1000]/[1000] maximum shards open;"}}}}
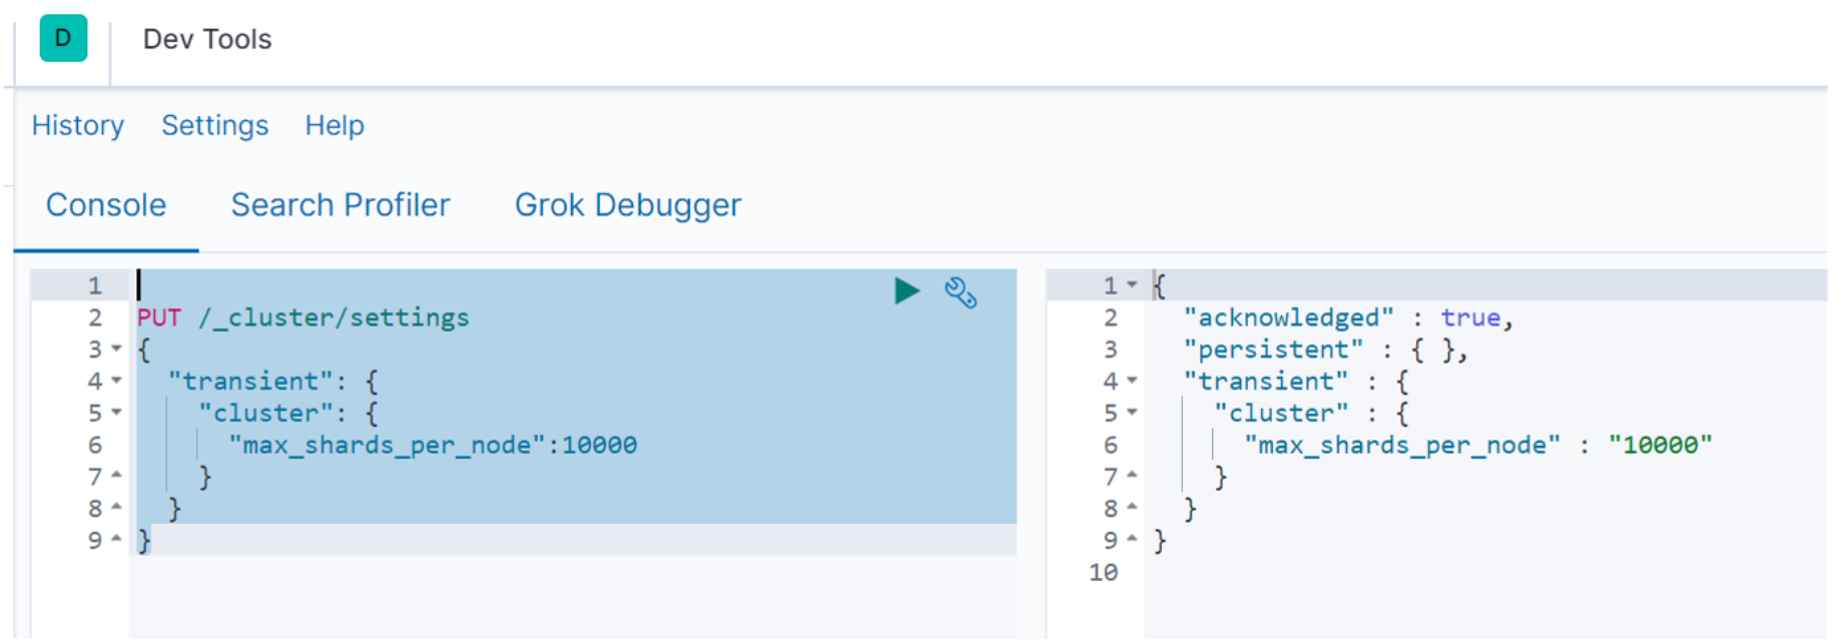
Can be set with Kibana
Main commands:
PUT /_cluster/settings
{
  "transient": {
    "cluster": {
      "max_shards_per_node":10000
    }
  }
}
The action screenshots are as follows:
Matters needing attention:
Restart lostash service after recommended setup
Part Three Filebeat
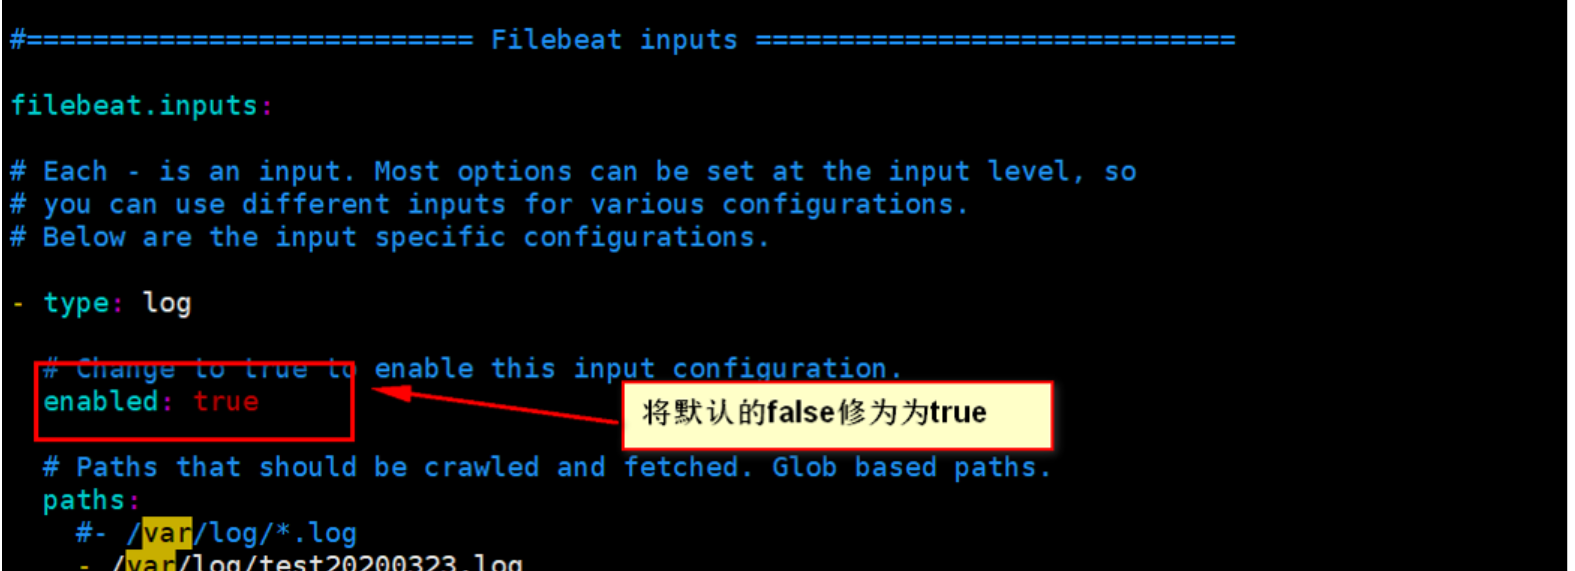
Question 3.1 Do not read data from log file
2019-03-23T19:24:41.772+0800    INFO    [monitoring]    log/log.go:145    Non-zero metrics in the last 30s
 {"monitoring": {"metrics": {"beat":{"cpu":{"system":{"ticks":30,"time":{"ms":2}},"total":{"ticks":80,"time":{"ms":4},"value":80},"user":{"ticks":50,"time":{"ms":2}}},"handles":{"limit":{"hard":1000000,"soft":1000000},"open":6},"info":{"ephemeral_id":"a4c61321-ad02-2c64-9624-49fe4356a4e9","uptime":{"ms":210031}},"memstats":{"gc_next":7265376,"memory_alloc":4652416,"memory_total":12084992},"runtime":{"goroutines":16}},"filebeat":{"harvester":{"open_files":0,"running":0}},"libbeat":{"config":{"module":{"running":0}},"pipeline":{"clients":0,"events":{"active":0}}},"registrar":{"states":{"current":0}},"system":{"load":{"1":0,"15":0.05,"5":0.01,"norm":{"1":0,"15":0.0125,"5":0.0025}}}}}}
Modify configuration parameters for filebeat.yml
Question 3.2 Multiple service processes
2019-03-27T20:13:22.985+0800    ERROR    logstash/async.go:256    Failed to publish events caused by: write tcp [::1]:48338->[::1]:5044: write: connection reset by peer
2019-03-27T20:13:23.985+0800    INFO    [monitoring]    log/log.go:145    Non-zero metrics in the last 30s    {"monitoring": {"metrics": {"beat":{"cpu":{"system":{"ticks":130,"time":{"ms":11}},"total":{"ticks":280,"time":{"ms":20},"value":280},"user":{"ticks":150,"time":{"ms":9}}},"handles":{"limit":{"hard":65536,"soft":65536},"open":7},"info":{"ephemeral_id":"a02ed909-a7a0-49ee-aff9-5fdab26ecf70","uptime":{"ms":150065}},"memstats":{"gc_next":10532480,"memory_alloc":7439504,"memory_total":19313416,"rss":806912},"runtime":{"goroutines":27}},"filebeat":{"events":{"active":1,"added":1},"harvester":{"open_files":1,"running":1}},"libbeat":{"config":{"module":{"running":0}},"output":{"events":{"batches":1,"failed":1,"total":1},"write":{"errors":1}},"pipeline":{"clients":1,"events":{"active":1,"published":1,"total":1}}},"registrar":{"states":{"current":1}},"system":{"load":{"1":0.05,"15":0.11,"5":0.06,"norm":{"1":0.0063,"15":0.0138,"5":0.0075}}}}}}
2019-03-27T20:13:24.575+0800    ERROR    pipeline/output.go:121    Failed to publish events: write tcp [::1]:48338->[::1]:5044: write: connection reset by peer
The reason is that multiple logstash processes are running at the same time, shut down and restart
Question 3.3 Configuring Filebeat as a service for management
The path where the filebeat service is located:
/etc/systemd/system
Edit filebeat.service file
[Unit]
Description=filebeat.service
[Service]
User=root
ExecStart=/data/filebeat/filebeat-7.4.2-linux-x86_64/filebeat -e -c /data/filebeat/filebeat-7.4.2-linux-x86_64/filebeat.yml
[Install]
WantedBy=multi-user.target
Related commands for managing services
systemctl start filebeat              #Start filebeat service
systemctl enable filebeat             #Set boot-up self-start
systemctl disable filebeat            #Stop Starting and Start
systemctl status filebeat             #View the current status of the service
systemctl restart filebeat           #Restart Service
systemctl list-units --type=service        #View all started services
Question 3.4 Filebeat service startup error
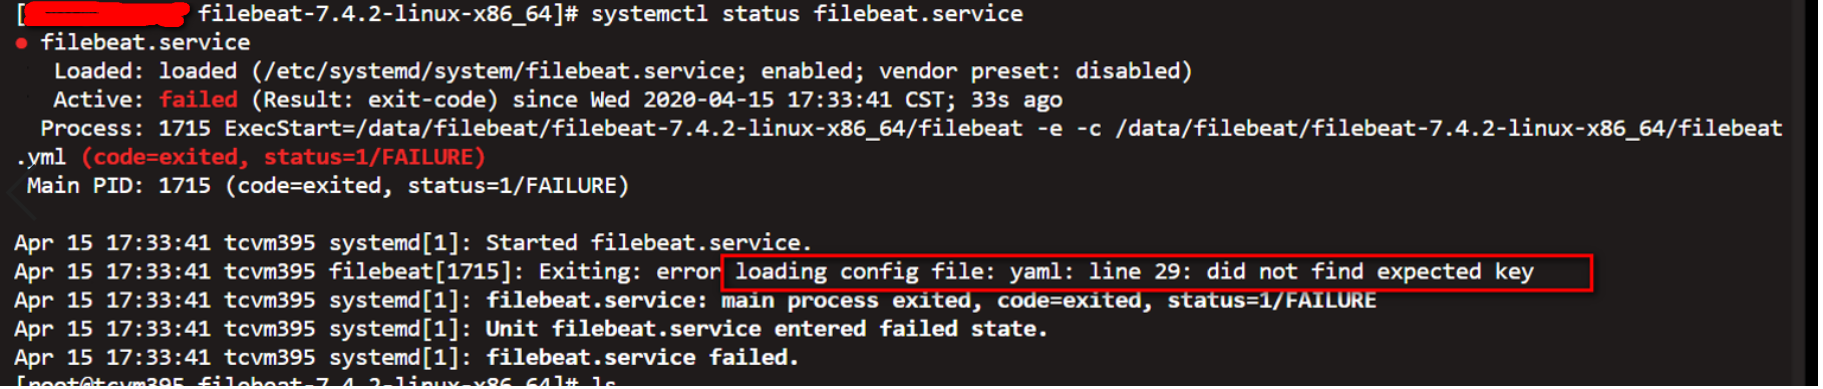
Note errors
Exiting: error loading config file: yaml: line 29: did not find expected key
The main problem is that the format in the filebeat.yml file is corrupted. Special attention should be paid to the modifications and additions. Verify that the format has changed compared with the previous and the latter.
Question 3.5 Linux version is too low to manage filebeat service with systemctl
At this point, we can manage the service by creating a filebeat.service file under the directory init.d.The main scripts are as follows:
#!/bin/bash
agent="/data/filebeat/filebeat-7.4.2-linux-x86_64/filebeat"
args="-e -c /data/filebeat/filebeat-7.4.2-linux-x86_64/filebeat.yml"
start() {
    pid=`ps -ef |grep /data/filebeat/filebeat-7.4.2-linux-x86_64/filebeat |grep -v grep |awk '{print $2}'`
    if [ ! "$pid" ];then
        echo "Starting filebeat: "
       nohup  $agent $args >/dev/null 2>&1 &
        if [ $? == '0' ];then
            echo "start filebeat ok"
        else
            echo "start filebeat failed"
        fi
    else
        echo "filebeat is still running!"
        exit
    fi
}
stop() {
    echo -n $"Stopping filebeat: "
    pid=`ps -ef |grep /data/filebeat/filebeat-7.4.2-linux-x86_64/filebeat |grep -v grep |awk '{print $2}'`
    if [ ! "$pid" ];then
echo "filebeat is not running"
    else
        kill $pid
echo "stop filebeat ok"
    fi
}
restart()
 {
    stop
    start
}
status(){
    pid=`ps -ef |grep /data/filebeat/filebeat-7.4.2-linux-x86_64/filebeat |grep -v grep |awk '{print $2}'`
    if [ ! "$pid" ];then
        echo "filebeat is not running"
    else
        echo "filebeat is running"
    fi
}
case "$1" in
    start)
        start
    ;;
    stop)
        stop
    ;;
    restart)
        restart
    ;;
    status)
        status
    ;;
    *)
        echo $"Usage: $0 {start|stop|restart|status}"
        exit 1
esac
Matters needing attention
1. File grants execution rights
chmod 755 filebeat.service
2. Set up boot-up self-start
chkconfig --add filebeat.service
Error occurs when the above service is added from Startup

The solution adds the following two lines at the beginning of the service file
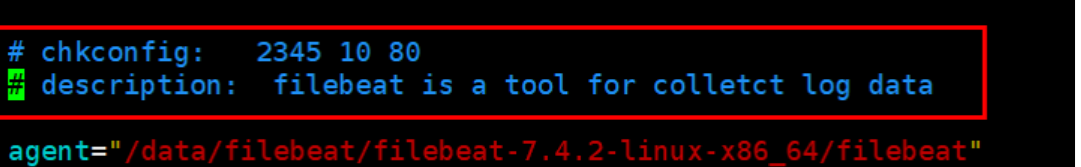
The modified code is as follows:
#!/bin/bash

# chkconfig:   2345 10 80
# description:  filebeat is a tool for colletct log data

agent="/data/filebeat/filebeat-7.4.2-linux-x86_64/filebeat"
args="-e -c /data/filebeat/filebeat-7.4.2-linux-x86_64/filebeat.yml"
start() {
    pid=`ps -ef |grep /data/filebeat/filebeat-7.4.2-linux-x86_64/filebeat |grep -v grep |awk '{print $2}'`
    if [ ! "$pid" ];then
        echo "Starting filebeat: "
       nohup  $agent $args >/dev/null?2>&1 &
        if [ $? == '0' ];then
            echo "start filebeat ok"
        else
            echo "start filebeat failed"
        fi
    else
        echo "filebeat is still running!"
        exit
    fi
}
stop() {
    echo -n $"Stopping filebeat: "
    pid=`ps -ef |grep /data/filebeat/filebeat-7.4.2-linux-x86_64/filebeat |grep -v grep |awk '{print $2}'`
    if [ ! "$pid" ];then
echo "filebeat is not running"
    else
        kill $pid
echo "stop filebeat ok"
    fi
}
restart()
 {
    stop
    start
}
status(){
    pid=`ps -ef |grep /data/filebeat/filebeat-7.4.2-linux-x86_64/filebeat |grep -v grep |awk '{print $2}'`
    if [ ! "$pid" ];then
        echo "filebeat is not running"
    else
        echo "filebeat is running"
    fi
}
case "$1" in
    start)
        start
    ;;
    stop)
        stop
    ;;
    restart)
        restart
    ;;
    status)
        status
    ;;
    *)
        echo $"Usage: $0 {start|stop|restart|status}"
        exit 1
esac
Part 4 Logstash
Question 4.1 Serviced Configuration
The most common way to run logstash is by running the command line. /bin/logstash-f logstash.conf to start and the end command is ctrl+c.The advantages of this approach are ease of operation, disadvantage is unmanageable, and maintenance costs are higher if a server restart is encountered. If logstash is running in a production environment, it is recommended that services be used.Logstash is started as a service, and boot-up self-start is achieved with the help of the systemctl feature.
(1) startup.options in config under installation directory need to be modified
Modify main items:
1. The default startup user and user group for the service is logstash; it can be modified to root;
2. The LS_HOME parameter is set to the installation directory of logstash; for example: /data/logstash/logstash-7.6.0
3. The LS_SETTINGS_DIR parameter is configured to contain a directory with logstash.yml; for example: /data/logstash/logstash-7.6.0/config
4. LS_OPTS parameter item, add logstash.conf specified item (-f parameter); for example, LS_OPTS="--path.settings ${LS_SETTINGS_DIR} -f/data/logstash/logstash-7.6.0/config/logstash.conf"
(2) Execute logstash command as root to create service
Commands to create services
Installation directory/bin/system-install
After executing the create command, the logstash.service file is generated in the / etc/systemd/system/directory
(3) Management of logstash service
Set service self-start: systemctl enable logstash
Start service: systemctl start logstash
Stop service: systemctl stop logstash
Restart service: systemctl restart logstash
View service status: systemctl status logstash
Question 4.2 Installing logstash service requires jdk to be installed first
The error message is as follows:

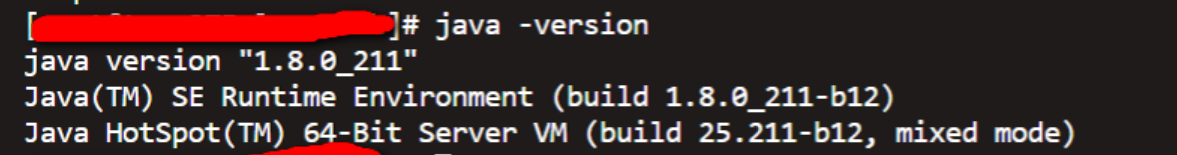
Verify that you have installed by viewing the jave version

The illustration above shows that it is not installed.Download (or upload) the package locally to perform the installation
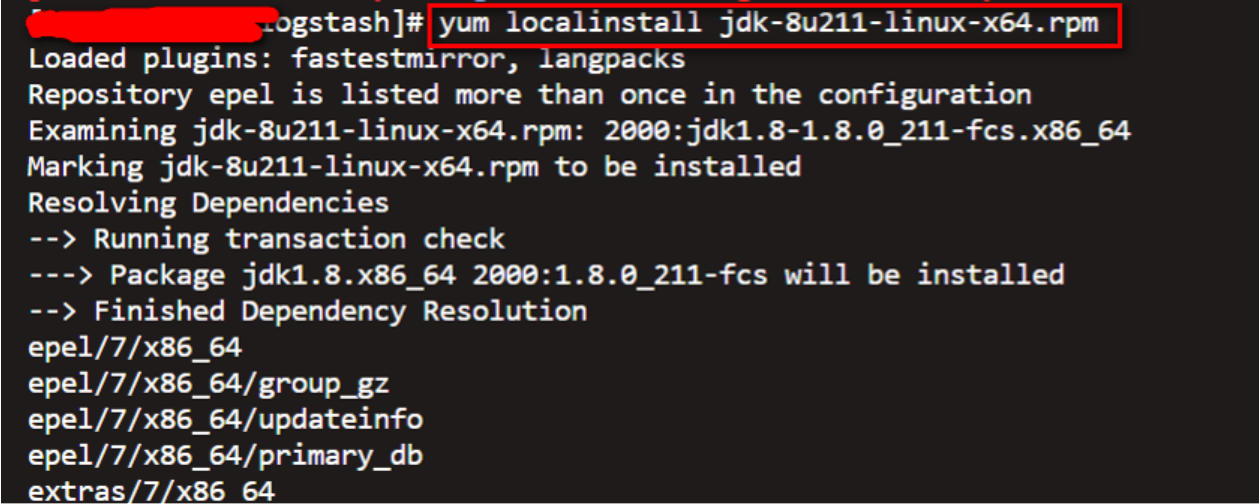
Execute the installation command as follows:
yum localinstall jdk-8u211-linux-x64.rpm
Install OK to perform validation
Question 4.3 Linux is too low to install logstash service
Question Tips

View Linux System Version

Reason: centos 6.5 does not support systemctl management service
Solution
Schema validation

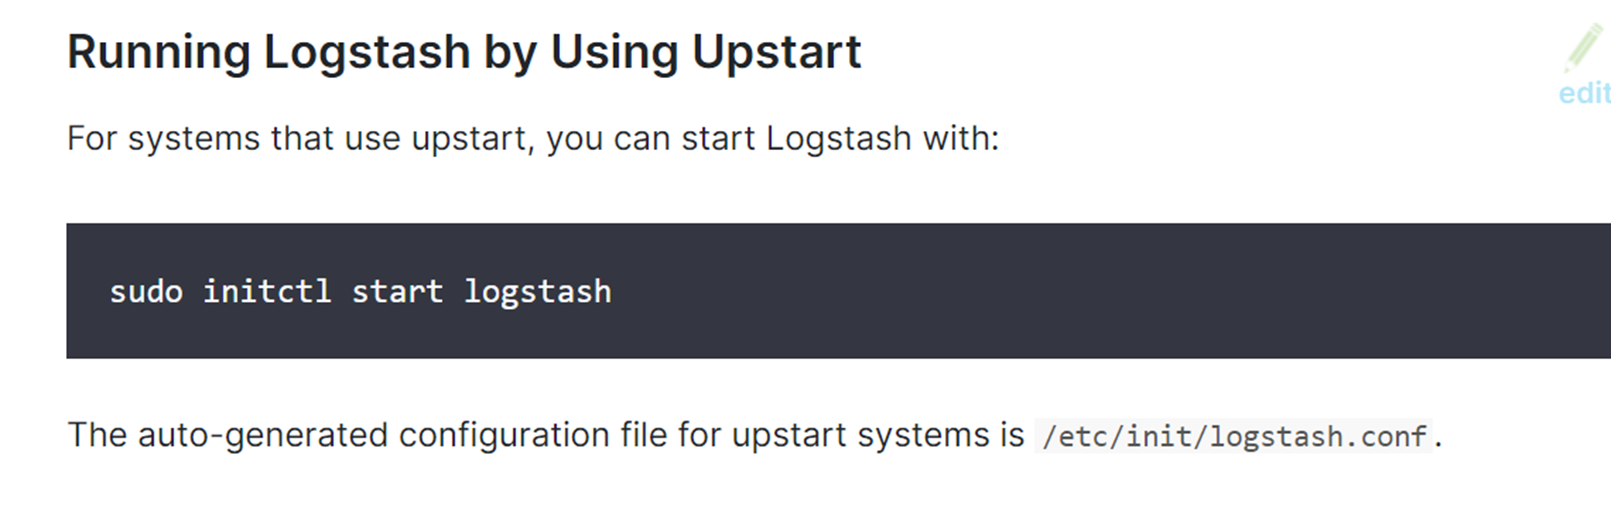
Related commands
1.Start Command
initctl start logstash
2.View Status
initctl status logstash
Matters needing attention:
Note whether the following commands for generating services will execute
./system-install
Otherwise prompt error
initctl: Unknown job: logstash

Question 4.4 Naming index name s defined in the configuration file needs to be lowercase
"Invalid index name [mysql-error-Test-2019.05.13], must be lowercase", "index_uuid"=>"_na_", "index"=>"mysql-error-Test-2019.05.13"}}}}
May 13 13:36:33 hzvm1996 logstash[123194]: [2019-05-13T13:36:33,907][ERROR][logstash.outputs.elasticsearch][main] Could not index event to Elasticsearch. {:status=>400, :action=>["index", {:_id=>nil, :_index=>"mysql-slow-Test-2020.05.13", :routing=>nil, :_type=>"_doc"}, #<LogStash::Event:0x1f0aedbc>], :response=>{"index"=>{"_index"=>"mysql-slow-Test-2019.05.13", "_type"=>"_doc", "_id"=>nil, "status"=>400, "error"=>{"type"=>"invalid_index_name_exception", "reason"=>"Invalid index name [mysql-slow-Test-2019.05.13], must be lowercase", "index_uuid"=>"_na_", "index"=>"mysql-slow-Test-2019.05.13"}}}}
May 13 13:38:50 hzvm1996 logstash[123194]: [2019-05-13T13:38:50,765][ERROR][logstash.outputs.elasticsearch][main] Could not index event to Elasticsearch. {:status=>400, :action=>["index", {:_id=>nil, :_index=>"mysql-error-Test-2020.05.13", :routing=>nil, :_type=>"_doc"}, #<LogStash::Event:0x4bdce1db>], :response=>{"index"=>{"_index"=>"mysql-error-Test-2019.05.13", "_type"=>"_doc", "_id"=>nil, "status"=>400, "error"=>{"type"=>"invalid_index_name_exception", "reason"=>"Invalid index name [mysql-error-Test-2019.05.13], must be lowercase", "index_uuid"=>"_na_", "index"=>"mysql-error-Test-2019.05.13"}}}}
Part 5 kibana
Question 5.1 Turn on password authentication
[root@testkibaba bin]# ./kibana-plugin install x-pack
Plugin installation was unsuccessful due to error "Kibana now contains X-Pack by default, there is no longer any need to install it as it is already present.
Note: New versions of Elasticsearch and Kibana already support x-pack in-house, no explicit installation is required.The older version needs to be installed.
Question 5.2 Application Startup Error
[root@testkibana bin]# ./kibana
Report errors
Kibana should not be run as root. Use --allow-root to continue.
Add a special account
useradd qqweixinkibaba -- add account
 Chown-R qqweixinkibaba:hzdbakibaba kibana-7.4.2-linux-x86_64 -- Give document directory permissions to new accounts
 Su qweixinkibaba - Switch accounts and start again
Question 5.3 Error Logging on to kibana
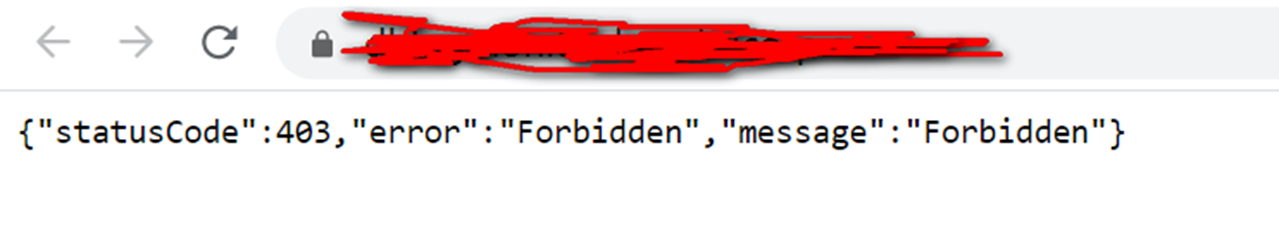
{"statusCode":403,"error":"Forbidden","message":"Forbidden"}
The reason for the error is: Kibana login error with kibana account, just change to elastic user
Question 5.4 Problems with Multi-tenant Implementation
A company may have multiple lines of business or R&D teams, so how do you make the data collected only open to the appropriate teams?That is, the implementation can only see its own data.One way of thinking is to set up multiple ELKs, one business line and one ELK, but this will result in waste of resources and increase the workload of operation and maintenance; the other way of thinking is through multi-tenant.
When implementing, the following issues should be noted:
Under the elastic account, go to the specified space and set the index pattern.
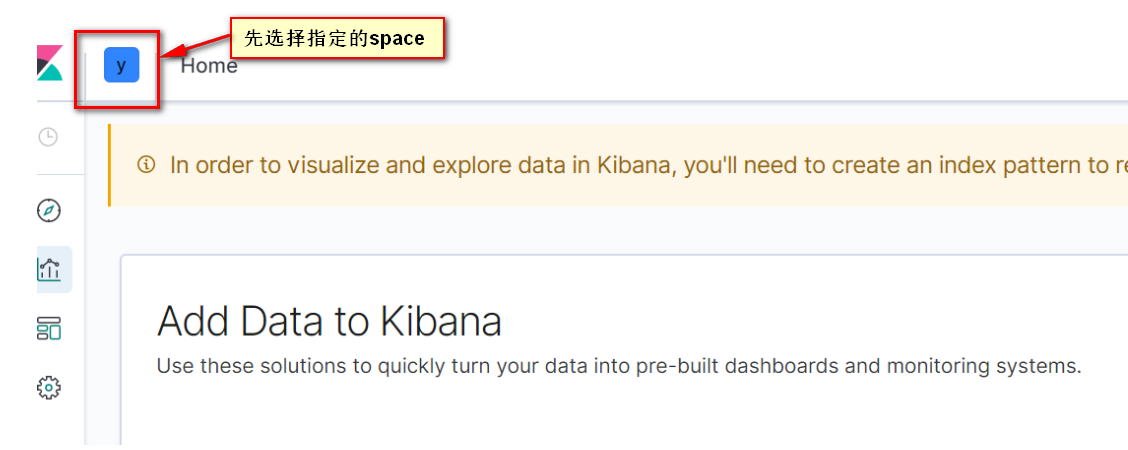
Create role first (note the association with space), and then user.
Reference material
1.https://www.jianshu.com/p/0a5acf831409 Filebeat for ELK Applications
2.http://www.voidcn.com/article/p-nlietamt-zh.html filebeat Startup Script
3.https://www.bilibili.com/video/av68523257/?redirectFrom=h5 ElasticTalk #22 Kibana Multi-tenant Introduction and Warfare
4.https://www.cnblogs.com/shengyang17/p/10597841.html ES Cluster
5.https://www.jianshu.com/p/54cdddf89989 Logstash Configuration Runs as Service
6.https://www.elastic.co/guide/en/logstash/current/running-logstash.html#running-logstash-upstart <Running Logstash as a Service on Debian or RPM>