Introduction to Prometheus Operator
Prometheus Operator is a set of open source CoreOS controllers for managing Prometheus on Kubernetes cluster, which simplifies the deployment, management and operation of Prometheus and Alertmanager cluster on Kubernetes.
Two, deployment
1. Download deployment files from the official
# git clone https://github.com/coreos/kube-prometheus.git
2. Change the mirror warehouse address
# mkdir prometheus
# cp kube-prometheus/manifests/* prometheus/
# sed -i 's#k8s.gcr.io#gcr.azk8s.cn/google_containers#g' prometheus/*
# sed -i 's#quay.io#quay.azk8s.cn#g' prometheus/*
# cat prometheus/* | grep image
3. Deployment of all resources
# kubectl apply -f prometheus/
4. View the created ns and crd
# kubectl get ns |grep monitoring
monitoring        Active   3m30s
# kubectl get crd
NAME                                    CREATED AT
alertmanagers.monitoring.coreos.com     2019-09-10T09:13:00Z
podmonitors.monitoring.coreos.com       2019-09-10T09:13:00Z
prometheuses.monitoring.coreos.com      2019-09-10T09:13:01Z
prometheusrules.monitoring.coreos.com   2019-09-10T09:13:02Z
servicemonitors.monitoring.coreos.com   2019-09-10T09:13:03Z
5. View all pod s and SVCS under monitoring
# kubectl get pod -n monitoring
NAME                                   READY   STATUS    RESTARTS   AGE
alertmanager-main-0                    2/2     Running   0          23h
alertmanager-main-1                    2/2     Running   0          23h
alertmanager-main-2                    2/2     Running   0          23h
grafana-57bfdd47f8-bhkvv               1/1     Running   0          23h
kube-state-metrics-8cf4797dc-7dg4w     4/4     Running   0          23h
node-exporter-446xd                    2/2     Running   0          23h
node-exporter-8sbsf                    2/2     Running   0          23h
node-exporter-dk7qk                    2/2     Running   0          23h
node-exporter-vdsqg                    2/2     Running   0          23h
node-exporter-w7czt                    2/2     Running   0          23h
node-exporter-wx7vj                    2/2     Running   0          23h
prometheus-adapter-6b9989ccbd-bcl2h    1/1     Running   0          23h
prometheus-k8s-0                       3/3     Running   1          23h
prometheus-k8s-1                       3/3     Running   1          23h
prometheus-operator-7894d75578-rg2gl   1/1     Running   0          23h
# kubectl get svc -n monitoring
NAME                    TYPE        CLUSTER-IP      EXTERNAL-IP   PORT(S)                      AGE
alertmanager-main       NodePort    10.97.155.71    <none>        9093:30093/TCP               23h
alertmanager-operated   ClusterIP   None            <none>        9093/TCP,9094/TCP,9094/UDP   23h
grafana                 NodePort    10.110.28.251   <none>        3000:30030/TCP               23h
kube-state-metrics      ClusterIP   None            <none>        8443/TCP,9443/TCP            23h
node-exporter           ClusterIP   None            <none>        9100/TCP                     23h
prometheus-adapter      ClusterIP   10.111.75.114   <none>        443/TCP                      23h
prometheus-k8s          NodePort    10.109.3.70     <none>        9090:30090/TCP               23h
prometheus-operated     ClusterIP   None            <none>        9090/TCP                     23h
prometheus-operator     ClusterIP   None            <none>        8080/TCP                     23h
6. Change port mode to NodePort mapping port
# kubectl edit svc prometheus-k8s -n monitoring
service/prometheus-k8s edited
# kubectl edit svc grafana -n monitoring
service/grafana edited
# kubectl edit svc alertmanager-main -n monitoring
service/alertmanager-main edited
# kubectl get svc -n monitoring | grep NodePort
alertmanager-main       NodePort    10.97.155.71    <none>        9093:30093/TCP               21h
grafana                 NodePort    10.110.28.251   <none>        3000:30030/TCP               21h
prometheus-k8s          NodePort    10.109.3.70     <none>        9090:30090/TCP               21h
7. Access testing
Three, configuration
1. View the target page of prometheus

It was found that kube-controller-manager and kube-scheduler were not monitored by these two system components, which are related to the definition of ServiceMonitor.
# cat prometheus/prometheus-serviceMonitorKubeScheduler.yaml
apiVersion: monitoring.coreos.com/v1
kind: ServiceMonitor
metadata:
  labels:
    k8s-app: kube-scheduler
  name: kube-scheduler
  namespace: monitoring
spec:
  endpoints:
  - interval: 30s
    port: http-metrics
  jobLabel: k8s-app
  namespaceSelector:
    matchNames:
    - kube-system
  selector:
    matchLabels:
      k8s-app: kube-scheduler
selector.matchLabels matches a Service like k8s-app=kube-scheduler under the kube-system namespace, but there is no corresponding Service in the system.
2. Create Service corresponding to kube-controller-manager and kube-scheduler
# cat cms-svc.yaml
apiVersion: v1
kind: Service
metadata:
  namespace: kube-system
  name: kube-controller-manager
  labels:
    k8s-app: kube-controller-manager
spec:
  selector:
    component: kube-controller-manager
  ports:
  - name: http-metrics
    port: 10252
    targetPort: 10252
    protocol: TCP
---
apiVersion: v1
kind: Service
metadata:
  namespace: kube-system
  name: kube-scheduler
  labels:
    k8s-app: kube-scheduler
spec:
  selector:
    component: kube-scheduler
  ports:
  - name: http-metrics
    port: 10251
    targetPort: 10251
    protocol: TCP
# kubectl describe pod kube-controller-manager-k8s-master01 -n kube-system
Labels:               component=kube-controller-manager
                      tier=control-plane
3. Check whether kube-controller-manager and kube-scheduler are normal

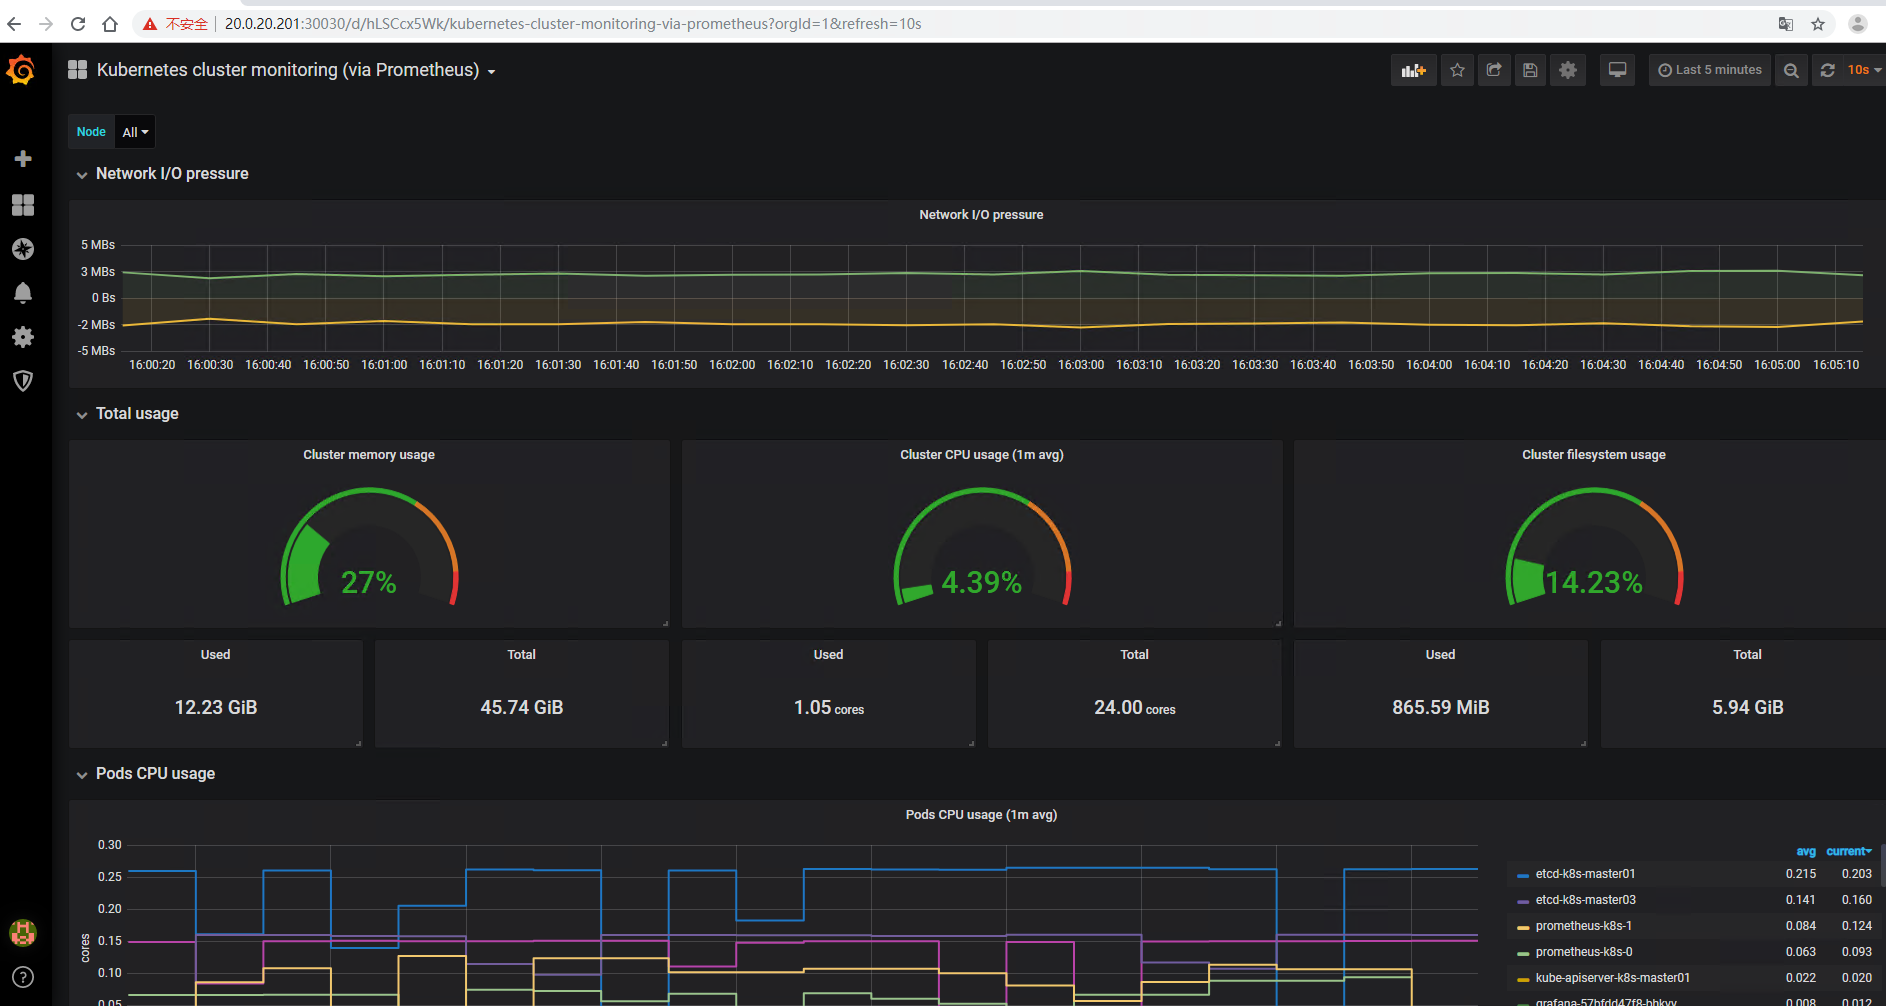
4. Visit Grafana