There are many combinations to monitor kubernetes cluster monitoring scheme, but after version 1.12, we usually choose Prometheus operator + grafana for monitoring. Let's deploy monitoring
1 download items
git clone https://github.com/coreos/kube-prometheus.git

Because this year, the Prometheus operator project moved to coreos / Kube Prometheus
2 typesetting
cd kube-prometheus/manifests/

mkdir -p operator node-exporter alertmanager grafana kube-state-metrics prometheus serviceMonitor adapter

mv *-serviceMonitor* serviceMonitor/
mv 0prometheus-operator* operator/
mv grafana-* grafana/
mv kube-state-metrics-* kube-state-metrics/
mv alertmanager-* alertmanager/
mv node-exporter-* node-exporter/
mv prometheus-adapter* adapter/
mv prometheus-* prometheus/
3 create a namespace
kubectl apply -f 00namespace-namespace.yaml
4 create operator
kubectl apply -f operator/

View pod
kubectl get pods  -n monitoring
Wait for the pod to be created and move on to the next step
5 create other CRD s
kubectl apply -f adapter/
kubectl apply -f alertmanager/
kubectl apply -f node-exporter/
kubectl apply -f kube-state-metrics/
kubectl apply -f grafana/
kubectl apply -f prometheus/
kubectl apply -f serviceMonitor/

//View pod
kubectl get pods  -n monitoring
//View service
kubectl get svc  -n monitoring
//It is found that both prometheus and grafana can be accessed inside the cluster
6 make prometheus and grafana accessible outside the cluster
There are two ways to do this
1) nodeport mode
2)ingress-nginx mode

//We choose nodeport for testing

//Modify prometheus
# vim prometheus/prometheus-service.yaml

apiVersion: v1
kind: Service
metadata:
  labels:
    prometheus: k8s
  name: prometheus-k8s
  namespace: monitoring
spec:
  ports:
  - name: web
    port: 9090
    targetPort: web
  type:
    NodePort
  selector:
    app: prometheus
    prometheus: k8s
  sessionAffinity: ClientIP
~
//Add nodeport

kubectl apply -f  prometheus/prometheus-service.yaml


//Modify grafana
# vim grafana/grafana-service.yaml

apiVersion: v1
kind: Service
metadata:
  labels:
    app: grafana
  name: grafana
  namespace: monitoring
spec:
  ports:
  - name: http
    port: 3000
    targetPort: http
  type:
    NodePort
  selector:
    app: grafana

kubectl apply -f grafana/grafana-service.yaml

//Viewing sevice is mainly to view the nodeport port, which we can access


# kubectl get svc  -n monitoring

NAME                    TYPE        CLUSTER-IP       EXTERNAL-IP   PORT(S)             AGE
alertmanager-main       ClusterIP   10.99.60.117     <none>        9093/TCP            67m
alertmanager-operated   ClusterIP   None             <none>        9093/TCP,6783/TCP   67m
grafana                 NodePort    10.105.159.125   <none>        3000:31746/TCP      67m
kube-state-metrics      ClusterIP   None             <none>        8443/TCP,9443/TCP   67m
node-exporter           ClusterIP   None             <none>        9100/TCP            67m
prometheus-adapter      ClusterIP   10.102.146.18    <none>        443/TCP             67m
prometheus-k8s          NodePort    10.107.201.125   <none>        9090:32040/TCP      67m
prometheus-operated     ClusterIP   None             <none>        9090/TCP            67m
prometheus-operator     ClusterIP   None
~
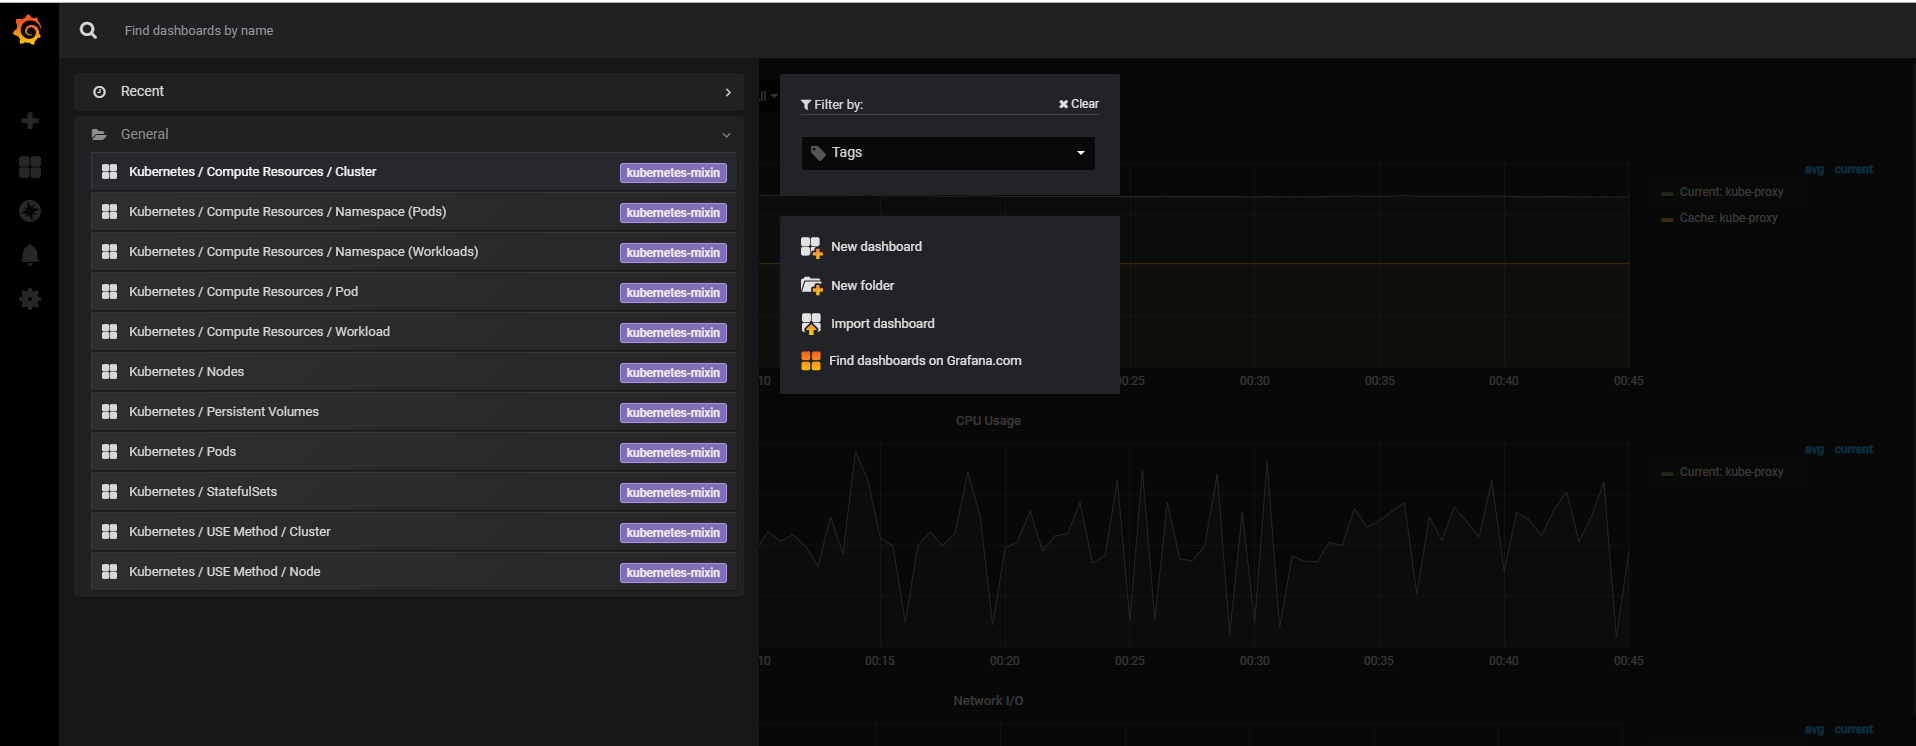
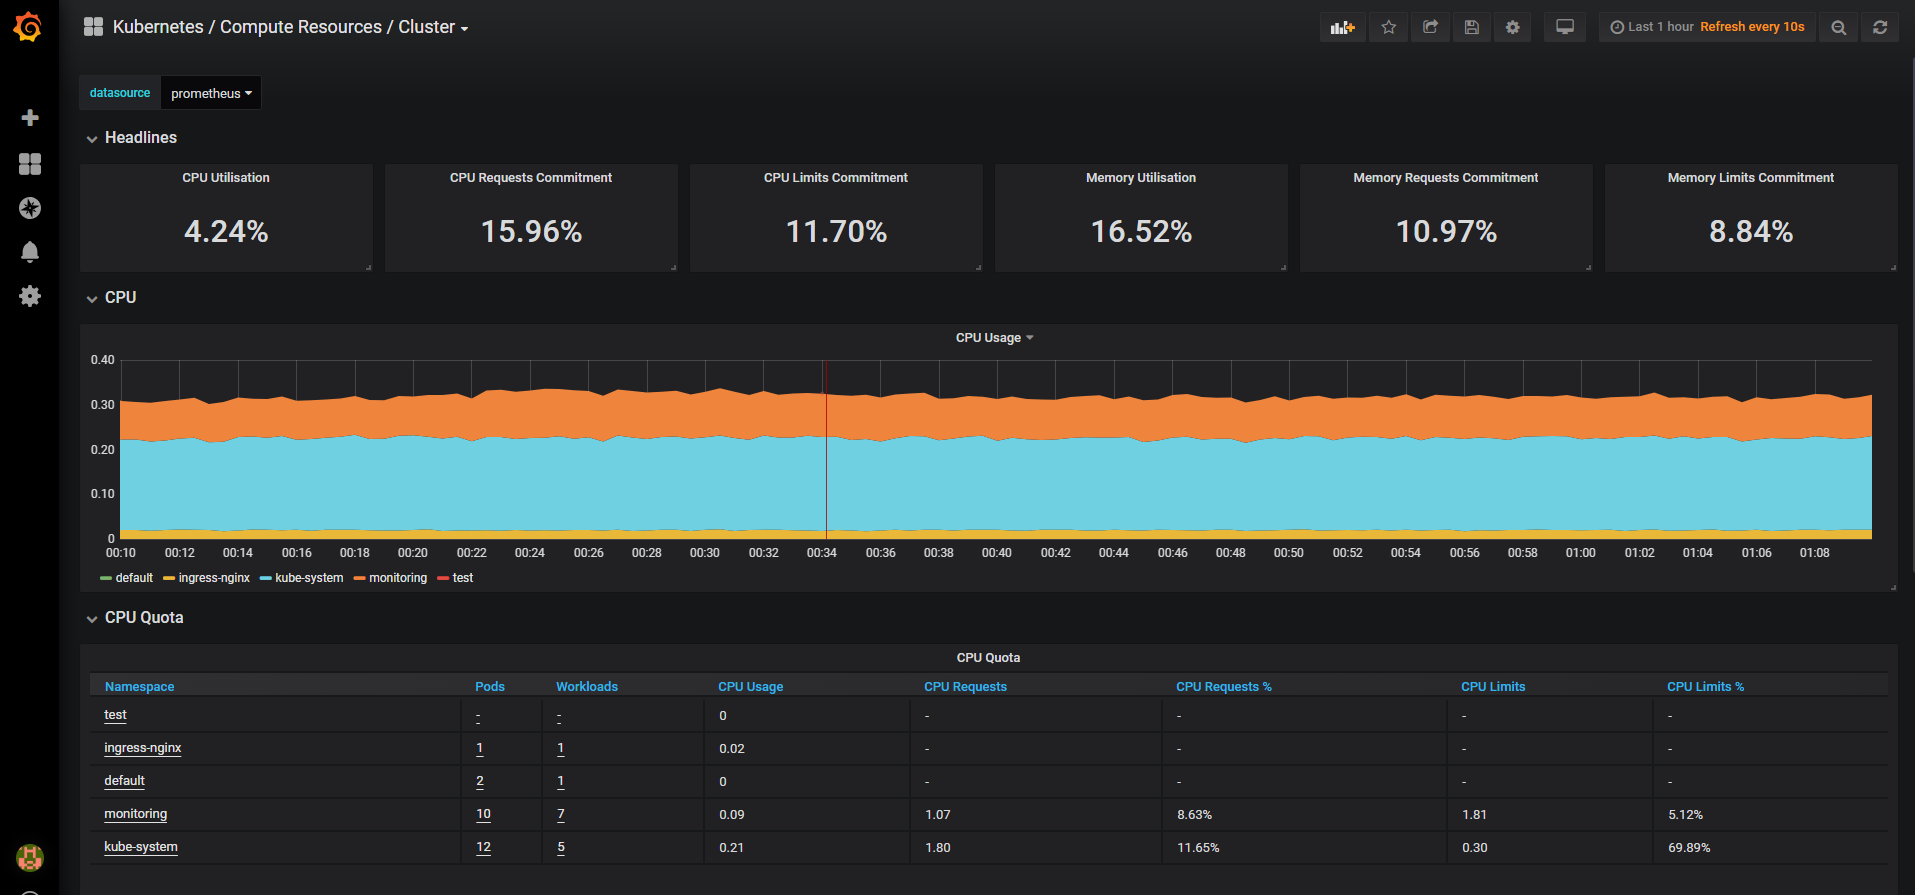
7 visit the grafana web page
http://masterip:31746
8 unfinished.... (mainly persistent storage) and inaccessible pod