1. KNN's Movie Classification
For a new movie, how do you tell if it's a love movie or an action movie? You can tell by the number of kisses or fights. Compare this movie with many already tagged movies, calculate the Euclidean distance between them, sort by distance, and find the shortest k (three below)And then see how many of these k are love movies and how many are action movies. Finally, based on the maximum number of movies, you can tell what type this new movie is.
1.1 Code implementation
First, we'll create a dataset with two arrays, one for kiss/fight counts and one for tags
def createDataSet():
    # Four sets of two-dimensional features
    group = np.array([[1, 101], [5, 89], [108, 5], [115, 8]])
    # Labels for four sets of features
    labels = ['Affectional film', 'Affectional film', 'Action movie', 'Action movie']
    return group, labels
Next comes the core of the KNN algorithm, which determines which test set belongs to the training set. There are four parameters, representing the input test set, the dataset, the labels in the dataset, and selecting the k points with the smallest distance to vote.
This code is more concise than a book: first calculate the distance, then select the k closest tags, and finally select the maximum number of tags among them.
def classify0(inx, dataset, labels, k):
    # Calculate Distance
    dist = np.sum((inx - dataset) ** 2, axis=1) ** 0.5
    # k nearest Tags
    k_labels = [labels[index] for index in dist.argsort()[0: k]]
    # The label that appears most often is the final category
    label = collections.Counter(k_labels).most_common(1)[0][0]
    return label
Finally, test.
if __name__ == '__main__':
    # Create Dataset
    group, labels = createDataSet()
    # Test Set
    test = [60, 100]
    # kNN Classification
    test_class = classify0(test, group, labels, 3)
    # Print classification results
    print(test_class)
The film is labeled as a love movie.
2. Helen's dating website
There are three types of people Helen associates with: dislike, average charm, and glamorous. These people have three kinds of data: annual flight mileage, percentage of time spent playing video games, and number of liters of ice cream consumed each week. Now Helen classifies these people to judge how much new people like Helen.
2.1 Preparations
First, we'll sort the data in the text into a matrix with n rows and 3 columns, and create an array with corresponding labels
def file2matrix(filename):
    # Open the file and specify the encoding this time.

    fr = open(filename, 'r', encoding='utf-8')
    # Read all the contents of the file
    arrayOLines = fr.readlines()
    # For UTF-8 text with a BOM, the BOM should be removed, otherwise an error will be raised later.
    arrayOLines[0] = arrayOLines[0].lstrip('\ufeff')
    # Get Lines of File
    numberOfLines = len(arrayOLines)
    # NumPy matrix returned, parsing completed data: numberOfLines row, 3 columns
    returnMat = np.zeros((numberOfLines, 3))
    # Return Classification Label Vector
    classLabelVector = []
    # Index value of row
    index = 0

    for line in arrayOLines:
        # s.strip(rm), when RM is empty, blank characters are deleted by default (including'\n','\r','t', '')
        line = line.strip()
        # Strings are sliced according to the'\t'delimiter using s.split (str=', num=string, cout(str)).
        listFromLine = line.split('\t')
        # The first three columns of the data are extracted and stored in the NumPy matrix of the returnMat, which is the eigenvalue matrix
        returnMat[index, :] = listFromLine[0:3]
        # Classify according to how much you like the tags in your text, 1 for dislike, 2 for charm, and 3 for glamour
        # The last tag for datingTestSet2.txt is that the processed tags have been changed to 1, 2, 3
        if listFromLine[-1] == 'didntLike':
            classLabelVector.append(1)
        elif listFromLine[-1] == 'smallDoses':
            classLabelVector.append(2)
        elif listFromLine[-1] == 'largeDoses':
            classLabelVector.append(3)
        index += 1
    return returnMat, classLabelVector
2.2 Data visualization
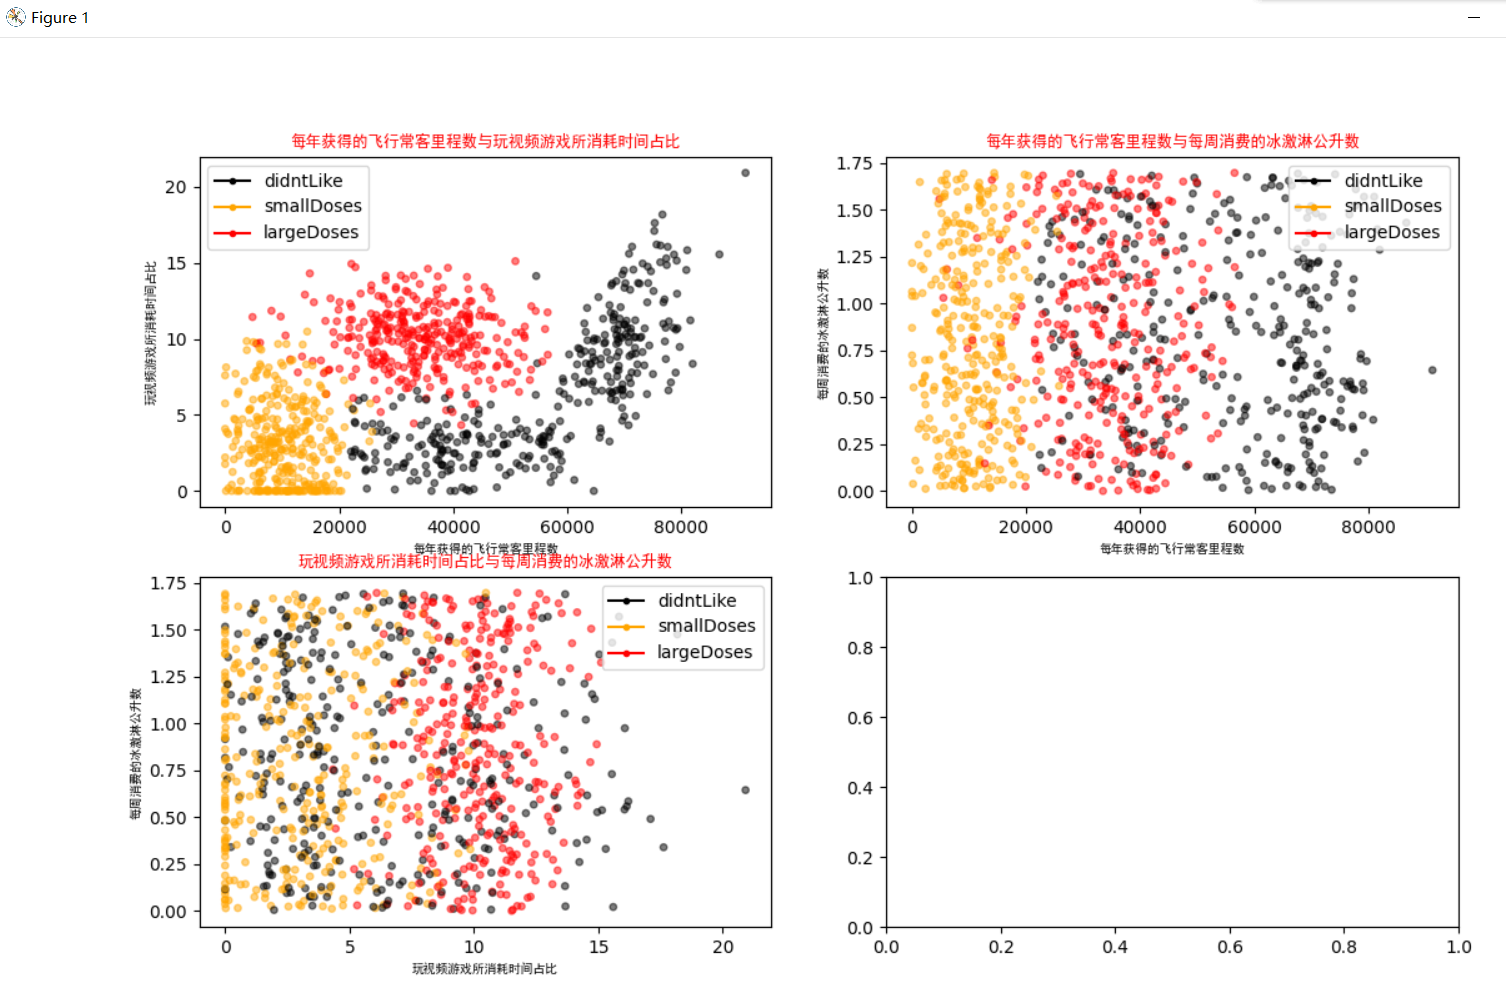
Showing these data in pictures helps us to see the relationship more intuitively.
def showdatas(datingDataMat, datingLabels):
    # Format Chinese Characters
    font = FontProperties(fname=r"c:\windows\fonts\simhei.ttf", size=14)  ##You need to see if your computer contains this font

    # Separate fig canvas into 1 row and 1 column, do not share x and y axes, fig canvas size is (13,8)
    # When nrow=2 and nclos=2, the fig canvas is divided into four zones, and axs[0][0] is the first zone in the first row
    fig, axs = plt.subplots(nrows=2, ncols=2, sharex=False, sharey=False, figsize=(13, 8))

    numberOfLabels = len(datingLabels)
    LabelsColors = []
    for i in datingLabels:
        if i == 1:
            LabelsColors.append('black')
        if i == 2:
            LabelsColors.append('orange')
        if i == 3:
            LabelsColors.append('red')
    # Draw a scatter plot using data from the first (Flight Frequent Routine) and second (Play Game) columns of the datingDataMat matrix, with a scatter size of 15 and a transparency of 0.5
    axs[0][0].scatter(x=datingDataMat[:, 0], y=datingDataMat[:, 1], color=LabelsColors, s=15, alpha=.5)
    # Set Title, x-axis label,y-axis label
    axs0_title_text = axs[0][0].set_title(u'Percentage of frequent flyer miles earned per year versus time spent playing video games', FontProperties=font)
    axs0_xlabel_text = axs[0][0].set_xlabel(u'Number of frequent flyer miles per year', FontProperties=font)
    axs0_ylabel_text = axs[0][0].set_ylabel(u'The percentage of time spent playing video games', FontProperties=font)
    plt.setp(axs0_title_text, size=9, weight='bold', color='red')
    plt.setp(axs0_xlabel_text, size=7, weight='bold', color='black')
    plt.setp(axs0_ylabel_text, size=7, weight='bold', color='black')

    # Draw a scatter plot using the first (flight routine) and third (ice cream) data of the datingDataMat matrix, with a scatter size of 15 and a transparency of 0.5
    axs[0][1].scatter(x=datingDataMat[:, 0], y=datingDataMat[:, 2], color=LabelsColors, s=15, alpha=.5)
    # Set Title, x-axis label,y-axis label
    axs1_title_text = axs[0][1].set_title(u'Frequent flyer miles per year and ice cream liters consumed per week', FontProperties=font)
    axs1_xlabel_text = axs[0][1].set_xlabel(u'Number of frequent flyer miles per year', FontProperties=font)
    axs1_ylabel_text = axs[0][1].set_ylabel(u'Ice cream liters consumed per week', FontProperties=font)
    plt.setp(axs1_title_text, size=9, weight='bold', color='red')
    plt.setp(axs1_xlabel_text, size=7, weight='bold', color='black')
    plt.setp(axs1_ylabel_text, size=7, weight='bold', color='black')

    # Draw a scatter plot using the data from the second (play games) and third (ice cream) column of the datingDataMat matrix, with a scatter size of 15 and a transparency of 0.5
    axs[1][0].scatter(x=datingDataMat[:, 1], y=datingDataMat[:, 2], color=LabelsColors, s=15, alpha=.5)
    # Set Title, x-axis label,y-axis label
    axs2_title_text = axs[1][0].set_title(u'Percentage of time spent playing video games versus liters of ice cream consumed per week', FontProperties=font)
    axs2_xlabel_text = axs[1][0].set_xlabel(u'The percentage of time spent playing video games', FontProperties=font)
    axs2_ylabel_text = axs[1][0].set_ylabel(u'Ice cream liters consumed per week', FontProperties=font)
    plt.setp(axs2_title_text, size=9, weight='bold', color='red')
    plt.setp(axs2_xlabel_text, size=7, weight='bold', color='black')
    plt.setp(axs2_ylabel_text, size=7, weight='bold', color='black')
    # Set Legend
    didntLike = mlines.Line2D([], [], color='black', marker='.',
                              markersize=6, label='didntLike')
    smallDoses = mlines.Line2D([], [], color='orange', marker='.',
                               markersize=6, label='smallDoses')
    largeDoses = mlines.Line2D([], [], color='red', marker='.',
                               markersize=6, label='largeDoses')
    # Add Legend
    axs[0][0].legend(handles=[didntLike, smallDoses, largeDoses])
    axs[0][1].legend(handles=[didntLike, smallDoses, largeDoses])
    axs[1][0].legend(handles=[didntLike, smallDoses, largeDoses])
    # display picture
    plt.show()
2.3 Data normalization
If the data is not normalized, some groups of data with smaller values will not work and the larger impact will be large.
def autoNorm(dataSet):
    # Get the minimum value of the data
    minVals = dataSet.min(0)
    maxVals = dataSet.max(0)
    # Range of maximum and minimum values
    ranges = maxVals - minVals
    # shape(dataSet) returns the number of matrix rows and columns of a dataSet
    normDataSet = np.zeros(np.shape(dataSet))
    # Returns the number of rows in the dataSet
    m = dataSet.shape[0]
    # Original value minus minimum value
    normDataSet = dataSet - np.tile(minVals, (m, 1))
    # Divide the difference between the maximum and minimum values to get normalized data
    normDataSet = normDataSet / np.tile(ranges, (m, 1))
    # Returns normalized data results, data range, minimum
    return normDataSet, ranges, minVals
2.4 KNN Classifier
The same is true for the last example: calculating Euclidean distances, taking k minimum values and choosing the most out of k to label this new data.
def classify0(inX, dataSet, labels, k):
    # The numpy function shape[0] returns the number of rows in the dataSet
    dataSetSize = dataSet.shape[0]
    # Repeat inX once in column vector direction (transverse) and dataSetSize times in row vector direction (longitudinal)
    diffMat = np.tile(inX, (dataSetSize, 1)) - dataSet
    # Square after subtracting two-dimensional features
    sqDiffMat = diffMat ** 2
    # sum() all elements add, sum(0) column add, sum(1) row add
    sqDistances = sqDiffMat.sum(axis=1)
    # Square, calculate distance
    distances = sqDistances ** 0.5
    # Returns the index value of the distances sorted from smallest to largest elements
    sortedDistIndices = distances.argsort()
    # A dictionary that records the number of categories
    classCount = {}
    for i in range(k):
        # Remove the category of the first k elements
        voteIlabel = labels[sortedDistIndices[i]]
        # dict.get(key,default=None), the dictionary get() method, returns the value of the specified key if the value is not in the dictionary.
        # Calculate number of categories
        classCount[voteIlabel] = classCount.get(voteIlabel, 0) + 1
    # Replacing iteritems() in python2 with items() in python3
    # key=operator.itemgetter(1) Sorts by dictionary value
    # key=operator.itemgetter(0) Sorts by dictionary key
    # reverse descending sort dictionary
    sortedClassCount = sorted(classCount.items(), key=operator.itemgetter(1), reverse=True)
    print(sortedClassCount)
    # The category that has been returned the most often, that is, the category to be classified
    return sortedClassCount[0][0]
2.5 Test Data
10% of the dataset is taken for testing
def datingClassTest():
# Open File Name
filename = "datingTestSet.txt"
# Store the returned feature matrix and classification vector in datingDataMat and datingLabels, respectively
datingDataMat, datingLabels = file2matrix(filename)
# Take 10% of all data
hoRatio = 0.10
# Data normalization, return normalized matrix, data range, data minimum
normMat, ranges, minVals = autoNorm(datingDataMat)
# Get the number of rows of normMat
m = normMat.shape[0]
# Number of 10% test data
numTestVecs = int(m * hoRatio)
# Classification Error Count
errorCount = 0.0
for i in range(numTestVecs):
# Pre-numTestVecs data as test set and post-numTestVecs data as training set
classifierResult = classify0(normMat[i, :], normMat[numTestVecs:m, :],
datingLabels[numTestVecs:m], 4)
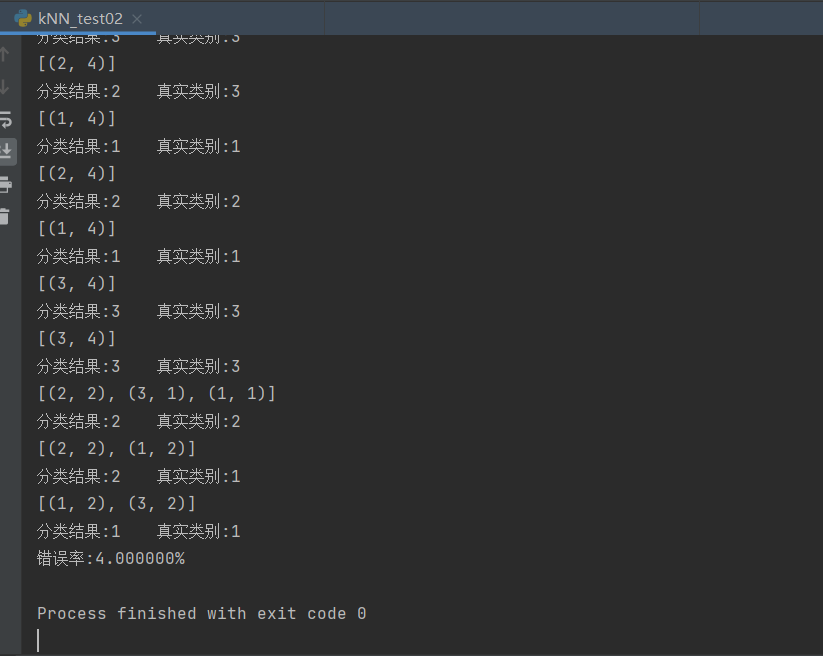
print("Classification results:%s\t Real Category:%d" % (classifierResult, datingLabels[i]))
if classifierResult != datingLabels[i]:
errorCount += 1.0
print("error rate:%f%%" % (errorCount / float(numTestVecs) * 100))
Enter data not in the dataset to determine how much Karen likes these people
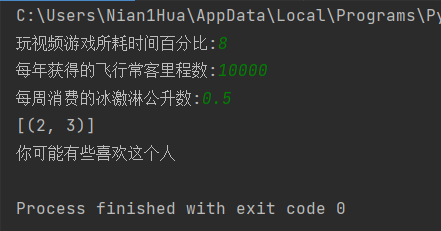
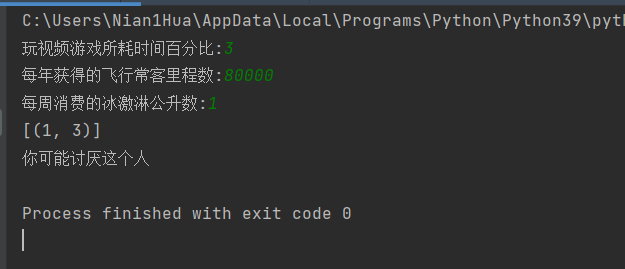
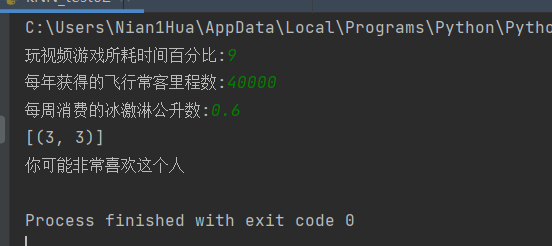
def classifyPerson():
# Output Results
resultList = ['Hate', 'Some like it', 'Like it very much']
# 3-D Feature User Input
precentTats = float(input("Percentage of time spent playing video games:"))
ffMiles = float(input("Number of frequent flyer miles per year:"))
iceCream = float(input("Ice cream liters consumed per week:"))
# Open File Name
filename = "datingTestSet.txt"
# Open and process data
datingDataMat, datingLabels = file2matrix(filename)
# Training Set Normalization
normMat, ranges, minVals = autoNorm(datingDataMat)
# Generate NumPy array, test set
inArr = np.array([ffMiles, precentTats, iceCream])
# Test Set Normalization
norminArr = (inArr - minVals) / ranges
# Return classification results
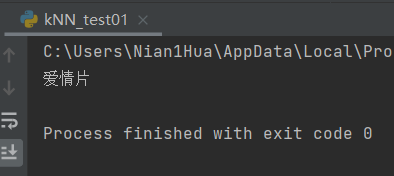
classifierResult = classify0(norminArr, normMat, datingLabels, 3)
# Print results
print("You may%s This man" % (resultList[classifierResult - 1]))
3. Handwritten Number Recognition
I've already covered this code in my last blog, so let me go into more detail in this post.
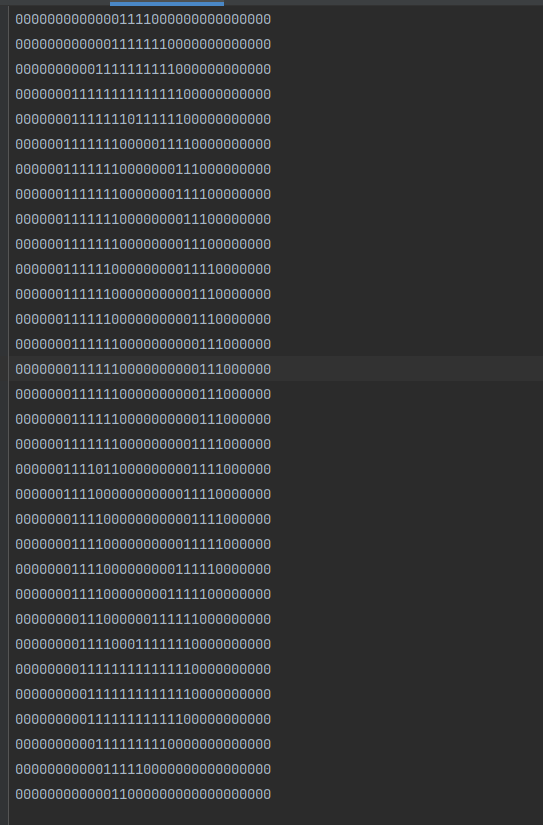
First prepare the training set and the test set, which consist of 0-9 numbers corresponding to the data in 0,1 format and are stored in txt text.
As shown, the number 0
3.1 Conversion Vector
Converts a 32 x 32 image to a 1 x 1024 vector.
def img2vector(filename):
    # Create 1x1024 zero vector
    returnVect = np.zeros((1, 1024))
    # Open File
    fr = open(filename)
    # Read by line
    for i in range(32):
        # Read a row of data
        lineStr = fr.readline()
        # The first 32 elements of each row are added to the returnVect in turn
        for j in range(32):
            returnVect[0, 32 * i + j] = int(lineStr[j])
    # Returns the converted 1x1024 vector
    return returnVect
3.2 Realizing Handwritten Number Recognition
def handwritingClassTest():
# Labels of Test Set
hwLabels = []
# Returns the file name in the trainingDigits directory
trainingFileList = listdir('trainingDigits')
# Returns the number of files in a folder
m = len(trainingFileList)
# Initialize Mat matrix for training, test set
trainingMat = np.zeros((m, 1024))
# Resolve the category of the training set from the file name
for i in range(m):
# Get the name of the file
fileNameStr = trainingFileList[i]
# Get classified numbers
classNumber = int(fileNameStr.split('_')[0])
# Add the obtained category to hwLabels
hwLabels.append(classNumber)
# Store 1x1024 data for each file in the trainingMat matrix
trainingMat[i, :] = img2vector('trainingDigits/%s' % (fileNameStr))
# Building kNN classifier
neigh = kNN(n_neighbors=3, algorithm='auto')
# Fit the model, trainingMat is the training matrix, hwLabels is the corresponding label
neigh.fit(trainingMat, hwLabels)
# Returns a list of files in the testDigits directory
testFileList = listdir('testDigits')
# Error Detection Count
errorCount = 0.0
# Number of test data
mTest = len(testFileList)
# Resolve the categories of the test set from the file and test for classification
for i in range(mTest):
# Get the name of the file
fileNameStr = testFileList[i]
# Get classified numbers
classNumber = int(fileNameStr.split('_')[0])
# Get the 1x1024 vector of the test set for training
vectorUnderTest = img2vector('testDigits/%s' % (fileNameStr))
# Obtain predictions
# classifierResult = classify0(vectorUnderTest, trainingMat, hwLabels, 3)
classifierResult = neigh.predict(vectorUnderTest)
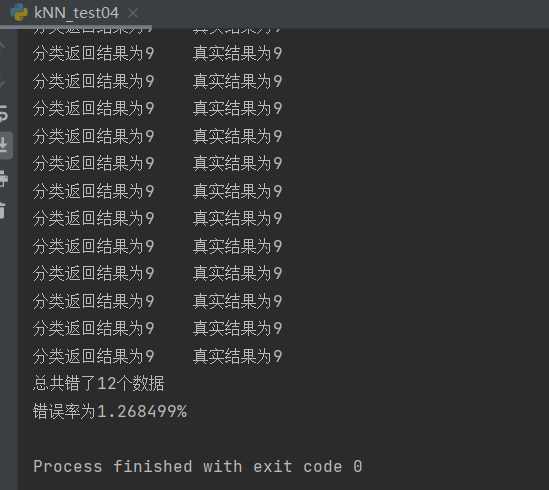
print("Classification returns a result of%d\t The true result is%d" % (classifierResult, classNumber))
if (classifierResult != classNumber):
errorCount += 1.0
print("Total error%d Data\n Error Rate%f%%" % (errorCount, errorCount / mTest * 100))