1. Image compression using K-means algorithm
Read a picture
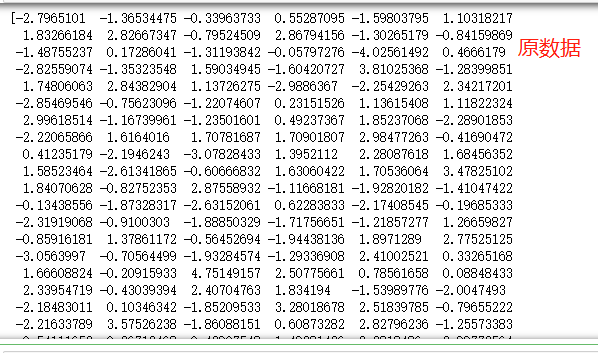
Observe image file size, memory occupied, image data structure, linearization
Clustering image pixel colors with kmeans
Get the color category of each pixel, and the color of each category
Compressed image generation: replace the original pixel color with the middle gather in clustering, and restore to 2D
Observe the file size of the compressed picture, accounting for the memory size
from sklearn.datasets import load_sample_image
from sklearn.cluster import KMeans
import matplotlib.pyplot as plt
import numpy as np
import matplotlib.image as img
import sys
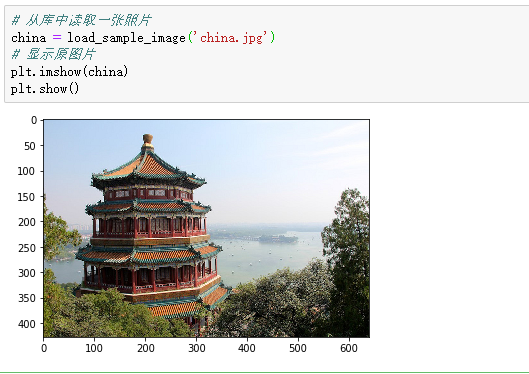
# Read a photo from the library
china = load_sample_image('china.jpg')
# Show original picture
plt.imshow(china)
plt.show()
# Compress pictures
image = china[::3, ::3]
x = image.reshape(-1, 3)
plt.imshow(image)
plt.show()
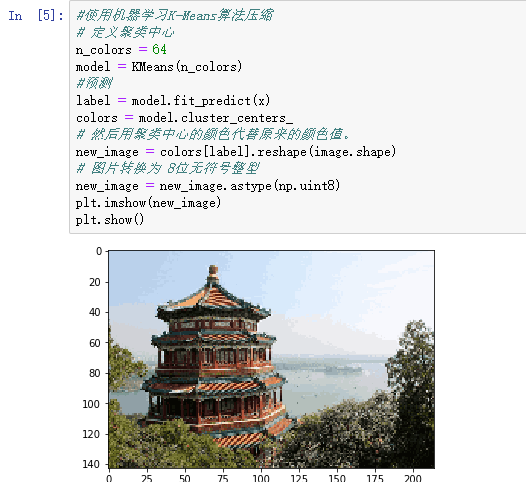
#Using machine learning K-Means algorithm to compress
# Define cluster center
n_colors = 64
model = KMeans(n_colors)
#Forecast
label = model.fit_predict(x)
colors = model.cluster_centers_
# Then the original color value is replaced by the color of cluster center.
new_image = colors[label].reshape(image.shape)
# Picture to 8-bit unsigned integer
new_image = new_image.astype(np.uint8)
plt.imshow(new_image)
plt.show()
First original
Second compression

The third image compression using KMeans algorithm
Save pictures

View the memory size of original and compressed images

2. Observe the problems that can be solved with K-means in learning and life.
Complete an application case from data model training test prediction.
import matplotlib.pyplot as plt
import sklearn.datasets as ds
import matplotlib.colors
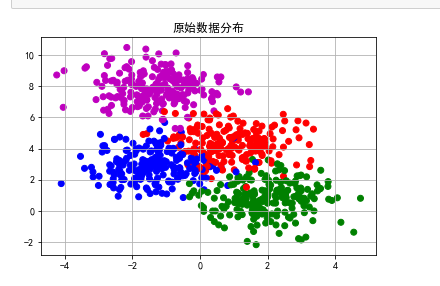
#Create data
N=800
centers=4
# Generate 2000 (default) 2D sample point sets, 5 center points
data,y=ds.make_blobs(N,centers=centers,random_state=0)
#Raw data distribution
#pylot uses rc configuration files to customize various default properties of a drawing, including form size, points per inch, line width, color, style, coordinate axis, coordinate and network properties, text, font, etc.
matplotlib.rcParams['font.sans-serif'] = [u'SimHei']
matplotlib.rcParams['axes.unicode_minus'] = False
cm = matplotlib.colors.ListedColormap(list('rgbm'))
plt.scatter(data[:,0],data[:,1],c=y,cmap=cm)
plt.title(u'Raw data distribution')
plt.grid()
plt.show()
#Using K-Means algorithm
from sklearn.cluster import KMeans
# n_clusters=k
model=KMeans(n_clusters=3,init='k-means++')
#Cluster prediction
y_pre=model.fit_predict(data)
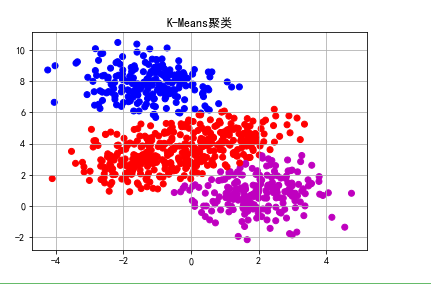
plt.scatter(data[:,0],data[:,1],c=y_pre,cmap=cm)
plt.title(u'K-Means clustering')
plt.grid()
plt.show()
#View original data
print(data[:,0],data[:,1])

# View Post forecast data
print(y_pre)