1. Introduction to JVN
- Talk about your understanding of JVM? java8 virtual machine and previous changes and updates?
- OOM memory overflow, StackOverFlowError stack overflow, how to analyze?
- What are the common tuning parameters of the JVM?
- How to capture memory snapshots and analyze Dump files?
- What do you know about class loader in JVM? rt-jar ext applicatoin
2 Research on the architecture of JVM
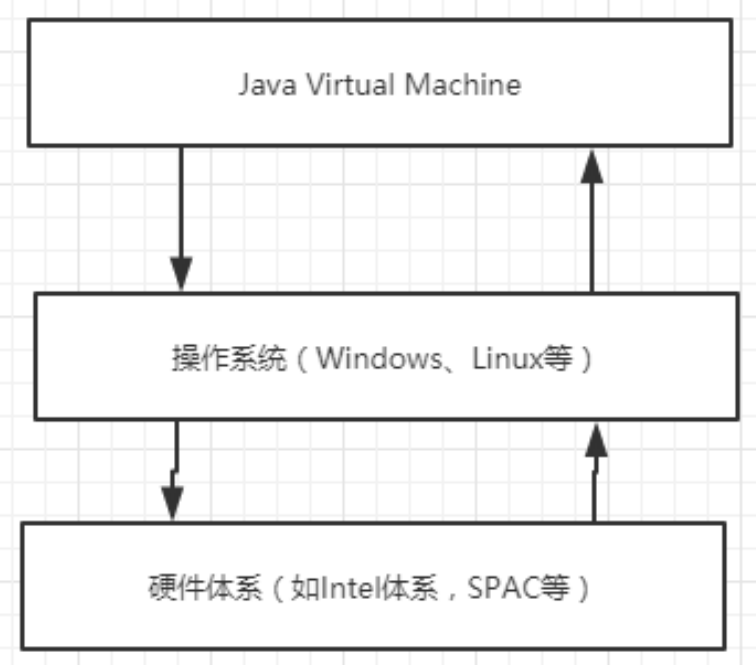
2.1 JVM location
2.2 architecture of JVM
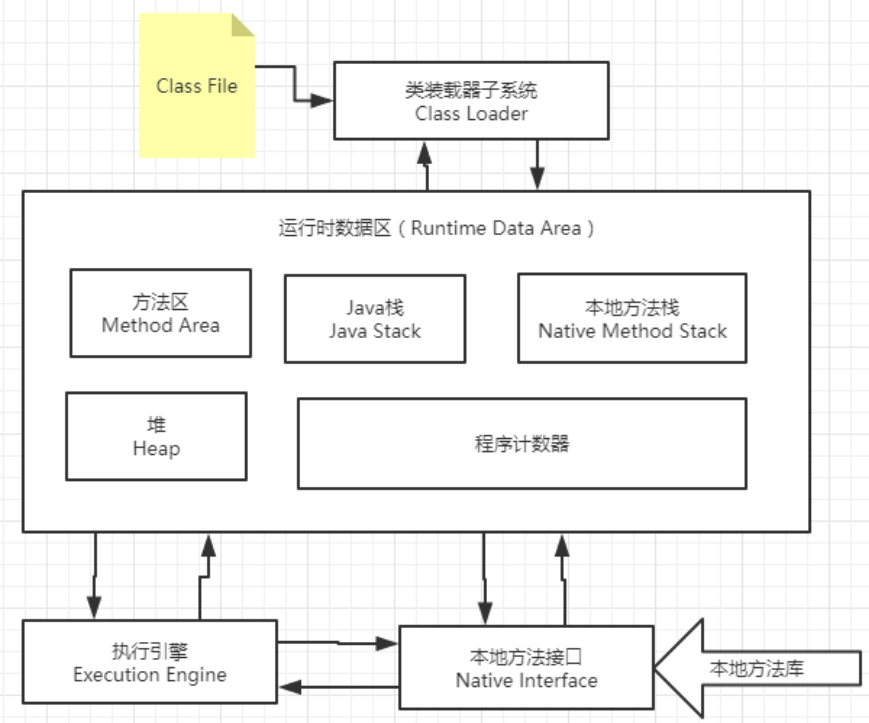
- The stack is 100% garbage free (because of the operation mode of the stack, there will be no garbage)
- 99% of the so-called JVM tuning is in the method area and heap, and the heap is the main one!
- The third-party plug-ins are mainly done on the execution engine, and there are few class loaders
2. Class loader
**Function: * * load Class file
- Classes are abstract and objects are concrete
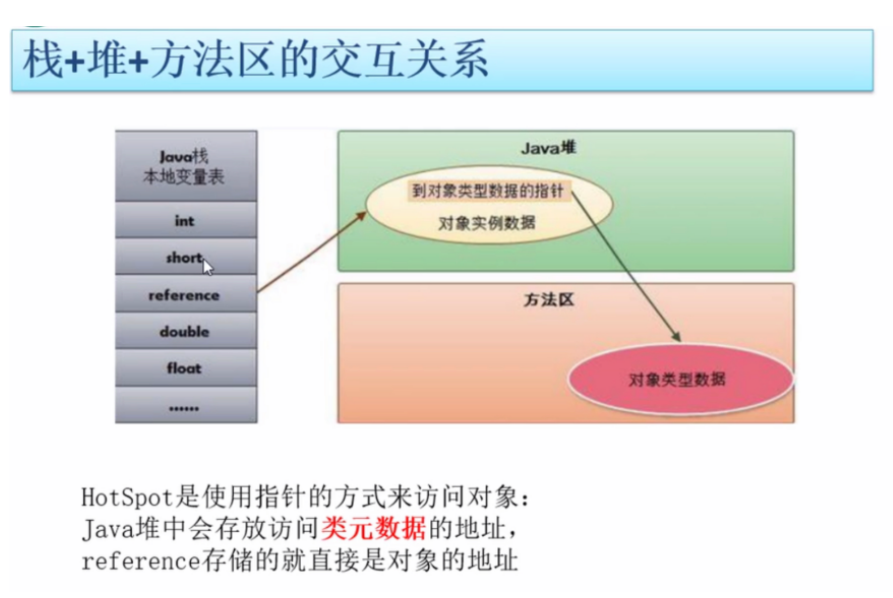
- The reference address of the object is on the stack, and the specific data is on the heap
- The third-party plug-ins are mainly done on the execution engine, and there are few class loaders
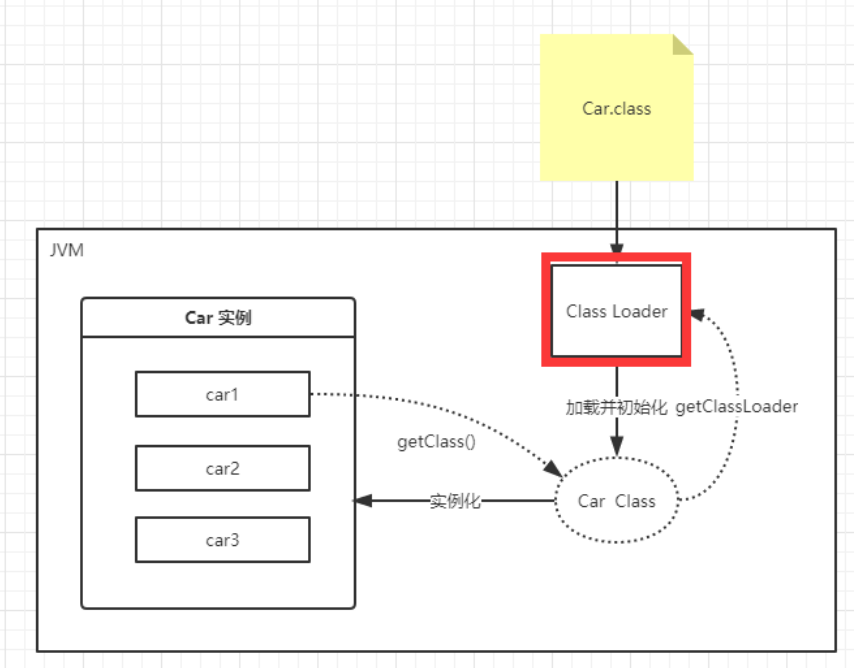
2.1 understanding class loaders:
class Test{
public static int a = 1;
}
//Given in our program is public static int a = 1;
However, the steps in the loading process are as follows:
- In the loading phase, compile the file as a. Class file, then load it through the class and load it into the JVM
- Connection phase
Step 1 (verification): make sure the Class file is OK
Step 2 (preparation): initialize to a=0 first. (because the initial value of your int type is 0)
Step 3 (parsing): convert reference to direct reference - Initialization stage: through this analysis stage, 1 is assigned as variable a
The output is the same class:
public class Car {
  public static void main(String[] args) {
    Car car1 = new Car();
    Car car2 = new Car();
    Car car3 = new Car();
    Class<? extends Car> aClass = car1.getClass();
    Class<? extends Car> aClass1 = car2.getClass();
    Class<? extends Car> aClass2 = car3.getClass();
    System.out.println(aClass);
    System.out.println(aClass2);
    System.out.println(aClass2);

  }
}
Class Car
2.2 execution sequence of class 2 loader
Class loading refers to reading the binary data in the class's. Class file into memory, placing it in the method area in the runtime data area, and then creating a java.lang.Class object in memory to encapsulate the class's data structure in the method area.
- For static fields, only the class that directly defines the field will be initialized;
- When a class is initializing, it is required that all its parent classes have been initialized;
- All Java virtual machine implementations must initialize each class or interface when it is "actively used for the first time" by a java program
public class Ltest {
  public static void main(String[] args) {
    System.out.println(Child.str2);
  }
}
  class MyParent{
    public  static String str1 = "hello";
    static {
      System.out.println("MyParent static");
    }
  }

  class Child extends MyParent{
    public static String str2 = "world";
    static {
      System.out.println("Child static");
    }
  }
Output:
MyParent static
Child static
world
2.3 concept of constant pool
Constants are stored in the constant pool of the class where the method calling the constant is located in the compilation stage. In essence, the calling class does not directly use the class defining the constant, so the initialization of the class defining the constant will not be triggered. Note: This refers to storing constants in the constant pool of MyTest2, and then MyTest2 has no relationship with MyParent2.
public class Ltest2 {
  public static void main(String[] args) {
    System.out.println(MyParent2.str3);
  }
}
class MyParent2{
  public static final String str3 = "qwe";
  static {
    System.out.println("MyParent2 static");
  }
}
qwe
When the value of a constant can not be determined during compilation, its value will not be placed in the constant pool of the calling class. This will lead to the active use of the class where the constant is located when the program is running, which will obviously lead to the initialization of this class.
import java.util.UUID;

public class Ltest2 {
  public static void main(String[] args) {
    System.out.println(MyParent2.str3);
  }
}
class MyParent2{
  public static final String str3 = UUID.randomUUID().toString();
  static {
    System.out.println("MyParent2 static");
  }
}
Because the value of this example is a value that can only be determined at run time, you need to run the static method. The value of the previous example is the value that can be determined at compile time.
MyParent2 static
669d1384-d4e9-4e97-bb76-7d96058b58a6
2.4 ClassLoader classification
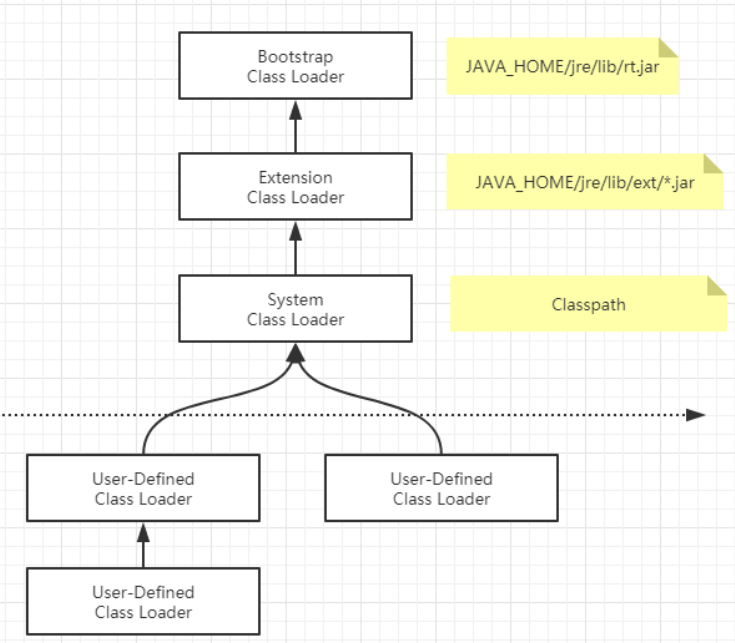
Classification of class loaders
1. Loader of Java virtual machine
- The root class loader (BootStrap) (BootClassLoader) sun.boot.class.path (loads the package of the system, including the jdk core
Class in the heart bank) - Extension class loader (ExtClassLoader) java.ext.dirs (loads the classes in the extension jar package)
- System (application) class loader (AppClassLoader) java.class.path (load the class you write and compile it
(class of)
2. User defined class loader - Subclass (inheritance) of Java.long.ClassLoader. Users can customize the loading method of the class
public class Car {
  public static void main(String[] args) {
    Car car1 = new Car();
    Class<? extends Car> aClass = car1.getClass();
    ClassLoader classLoader = aClass.getClassLoader();
    System.out.println(classLoader);//AppClassLoader Application Loader
    System.out.println(classLoader.getParent());//PlatformClassLoader platform class loader \ jre\lib\ext
    System.out.println(classLoader.getParent().getParent());//Null 1. No 2. The Java program cannot get rt.jar
  }
}
Output:
jdk.internal.loader.ClassLoaders$AppClassLoader@2f0e140b
jdk.internal.loader.ClassLoaders$PlatformClassLoader@16b98e56
null
3 parental delegation mechanism
- In order to ensure the security of the core class, it will not be tampered with
- Prevent repeated loading of the same class
- App -- > exc -- > boot (final highest level execution)
- Boot -- > exc -- > app (when the highest level does not exist, execute it back one level at a time)
- Execution sequence
1. The class loader receives a class loading request
2. Delegate the request upward to the parent class loader to complete it until the class loader is started
3. Start the loader and check whether the current class can be loaded (using the findClass() method). If it can be loaded, it will end and use the current loader
4. Otherwise, throw an exception and notify the child loader to load
5. Repeat steps 3 and 4
By default, String is loaded by starting the class loader. Customize a String:
package java.lang;
public class String {
public static void main(String[] args) {
              System.out.println(1);
   }
}

It is found that the custom String can be compiled normally, but can never be loaded and run.
This is because when applying for custom String loading, the class loader is always started instead of the custom loader, and it will not be any other loader.
The parental delegation mechanism can ensure that the classes provided by the Java core class library * * will not be replaced by custom classes * *.
4 Native method
Write multithreaded class startup
  public static void main(String[] args) {
    System.out.println(MyParent2.str3);
    new Thread(()->{

    },"123").start();
  }
}
Source code of start method:
public synchronized void start() {
        if (threadStatus != 0)
            throw new IllegalThreadStateException();

        group.add(this);

        boolean started = false;
        try {
            start0();
            started = true;
        } finally {
            try {
                if (!started) {
                    group.threadStartFailed(this);
                }
            } catch (Throwable ignore) {

            }
        }
    }
//This Thread is a class. Isn't it weird to define this method here! Look at the keyword native;
    private native void start0();
For those with the native keyword, it indicates that the scope of java cannot be reached. Call the library of the underlying C language!
JNI: Java Native Interface
All methods with the native keyword will enter the local method stack;
Native Method Stack
The function of local interface is to integrate different programming languages for Java. Its original intention is to integrate C/C + + programs. Java was born
When C/C + + runs rampant, if you want to have a foothold, you must have a program calling C and C + +, so you have opened up a special area processing mark in memory
For the code marked as native, its specific method is to register the native method in the Native Method Stack and
Engine) load native libraries when the engine executes.
At present, this method is used less and less, except for hardware related applications, such as driving printers or Java systems through Java programs
Managing production equipment is rare in enterprise applications. Because the communication between heterogeneous domains is very developed, for example, it can be used
Socket communication and Web Service can also be used. I won't introduce more
4 program counter
Program counter: Program Counter Register
Each thread has a program counter, which is thread private.
Program counter is a small memory space, which can be regarded as the line number indicator of bytecode executed by the current thread. In the conceptual model of virtual machine, the bytecode interpreter works by changing the value of this counter to select the next bytecode instruction to be executed. The basic functions such as branch, loop, jump, exception handling and thread recovery all need to rely on this counter. Is a very small memory space, almost negligible.
5 method area
Method Area is one of the runtime data areas defined in the Java virtual machine specification. It is shared between threads like heap.
The Java virtual machine specification describes the method area as a logical part of the heap, but it has an alias called non heap. The purpose should be to distinguish it from the Java heap.
Before JDK7 (permanent generation), it is used to store class information, constants, string constants, class static variables, code compiled by the real-time compiler and other data that have been loaded by the virtual machine. Whenever a class is first loaded, its metadata is placed in the permanent generation. The size of the permanent generation is limited. If too many classes are loaded, it is likely to cause memory overflow of the permanent generation, that is, java.lang.OutOfMemoryError: PermGen.
JDK8 completely removes the permanent generation from the HotSpot JVM, migrates its original data to Java Heap or Native Heap (Metaspace), and replaces it with another memory area called Metaspace.
Meta space: meta space is the implementation of the method area in the HotSpot JVM. The method area is mainly used to store class information, constant pool, method data, method code, symbol reference, etc. The essence of meta space is similar to that of permanent generation, which is the implementation of method area in JVM specification. However, the biggest difference between meta space and permanent generation is that meta space is not in the virtual machine, but uses local memory.
The memory size can be configured through - XX:MetaspaceSize and - XX:MaxMetaspaceSize.
If the space occupation of the Metaspace reaches the set maximum, the GC will be triggered to collect the loader of dead objects and classes.
6 stacks
Stack: LIFO / FIFO
Queue: first in first out (FIFO: first input first output)
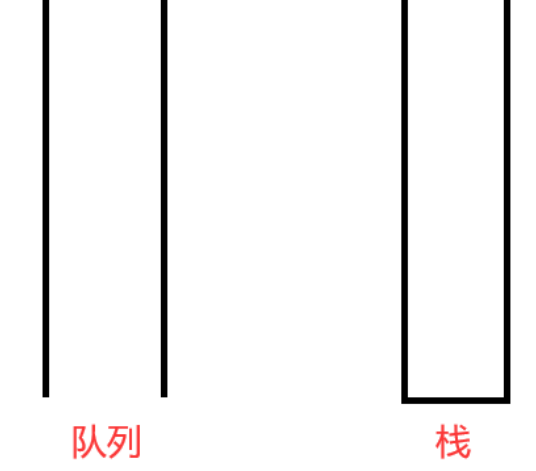
Stack manager running
Store some basic type values, object references, methods, etc.
The advantage of stack is that the access speed is faster than heap, second only to register, and stack data can be shared.
Think about why the main method was last executed! Why does a test() method continue to use the main method after its execution!
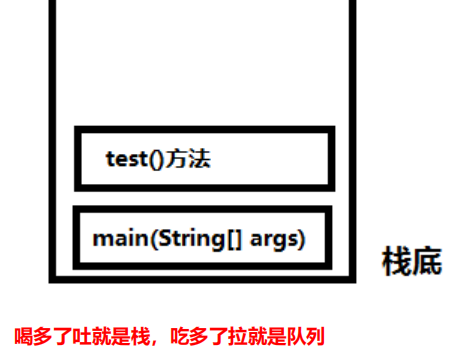
The stack is unique to each thread. Each time a function is called, the stack grows downward and pops up after the call. The stack of the main function cannot overlap with the stack of other functions, because the main thread ends when the main function comes out of the stack. Even if there are other threads running, other threads have their own stack and will not affect each other.
explain:
1. Stack is also called stack memory. It is in charge of the operation of Java programs. It is created when threads are created. Its life cycle follows the life cycle of threads
When the stack is finished, the memory is released.
2. For the stack, there is no garbage collection problem. As long as the thread ends, the stack will Over. The life cycle is consistent with the thread and is a thread
Private.
3. Calling the method itself will lead to stack overflow (recursive dead loop test)
public class StackDemo {
  public static void main(String[] args) {
    a();
  }
  private static void a() {
    b();
  }
  private static void b() {
    a();
  }
}
6.1 stack operation principle
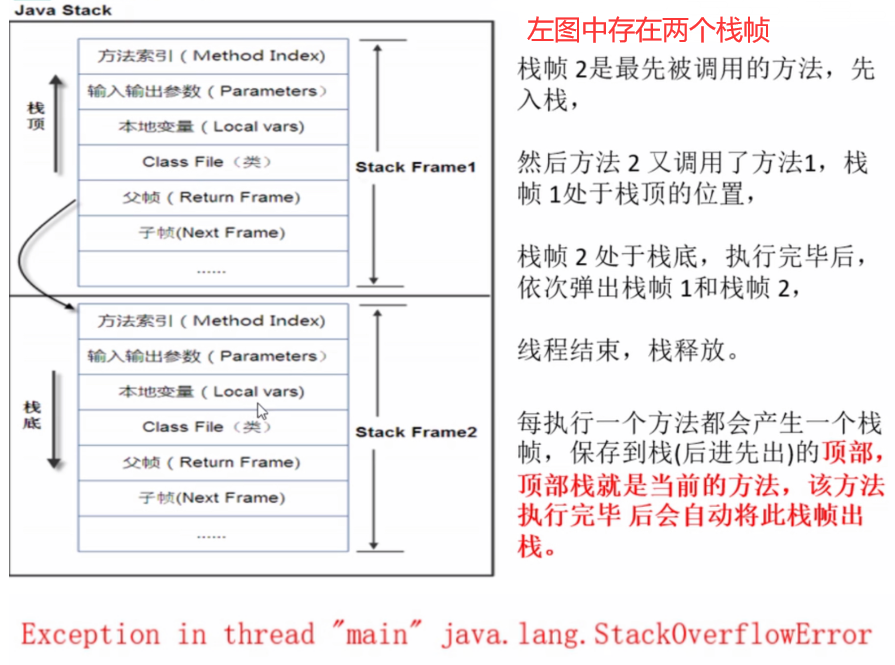
The constituent element of Java stack - stack frame
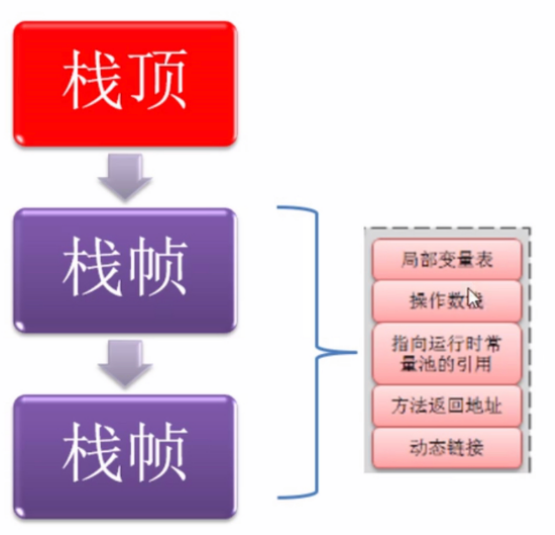
Stack frame is a data structure used to help virtual machines execute method calls and method execution. It is independent of threads. A thread has its own
A stack frame of. It encapsulates the method's local variable table, dynamic link information, method return address, operand stack and other information.
The first method corresponds to the process of a stack frame from entering the stack to leaving the stack in the virtual machine stack from the beginning of the call to the completion of the execution.
When A method A is called, A stack frame F1 is generated and pushed into the stack. Method A calls method B, and A stack frame is generated
F2 is also pushed into the stack, and method B calls method C, so the stack frame F3 is also pushed into the stack... After execution, F3 pops up first,
Then pop up F2, pop up F1
Follow the principle of "first in first out" / "last in first out".
7 Heap
Before Java 7
Heap heap. There is only one heap memory in a JVM instance. The size of heap memory can be adjusted. After the class loader reads the class file, it needs to
To put classes, methods and constant variables into heap memory and save the real information of all reference types to facilitate the execution of the actuator, heap memory is divided into
Part III:
- Young Generation Space Young/New
- Tenure generation space Old/Tenure
- Permanent Space Perm
Heap memory is logically divided into three parts: new, old and permanent (meta space: name after JDK8)
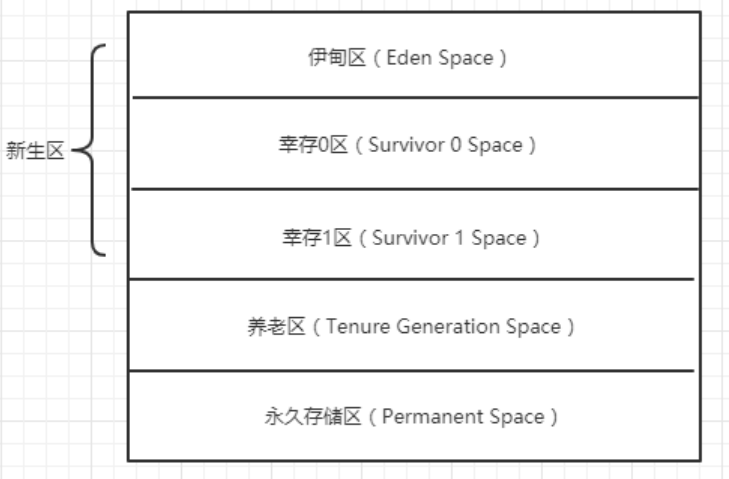
GC garbage collection is mainly in the new area and the old-age area, which is divided into light GC and heavy GC. If there is not enough memory or there is an endless loop, it will lead to java.lang.OutOfMemoryError: Java heap space
7.1 New Area
The new area is the area where classes are born, grow and die. A class is generated, applied, and finally collected by the garbage collector to end its life.
The new area is divided into two parts: Eden Space and Survivor Space. All classes are in Eden
There are two surviving areas: Zone 0 and zone 1. When the space in Eden runs out, the program needs to create objects and JVM garbage
The recycler will recycle the waste in Eden Park (Minor GC). Move the remaining objects in the garden of Eden to surviving zone 0. If surviving zone 0 also exists
When it is full, recycle the garbage in this area and move it to zone 1. What if zone 1 is also full? (here, zone 0 and zone 1 are mutually exclusive.)
(alternate process) and then move to the old-age care area. If the old-age care area is also full, a major GC (Full GC) will be generated at this time for old-age care
The memory of the pension area is cleaned up. If the pension area finds that the object cannot be saved after executing Full GC, an OOM exception will be generated
"OutOfMemoryError ".
If a java.lang.OutOfMemoryError: java heap space exception occurs, it indicates that the heap memory of the Java virtual machine is insufficient. Why
As follows:
1. The heap memory setting of the Java virtual machine is not enough. You can adjust it through the parameters - Xms (initial value size) and - Xmx (maximum size).
2. A large number of large objects are created in the code, and they cannot be collected by the garbage collector (there are referenced) or looped for a long time
7.2 Sun HotSpot memory management
For generational management, different algorithms are used in different regions:
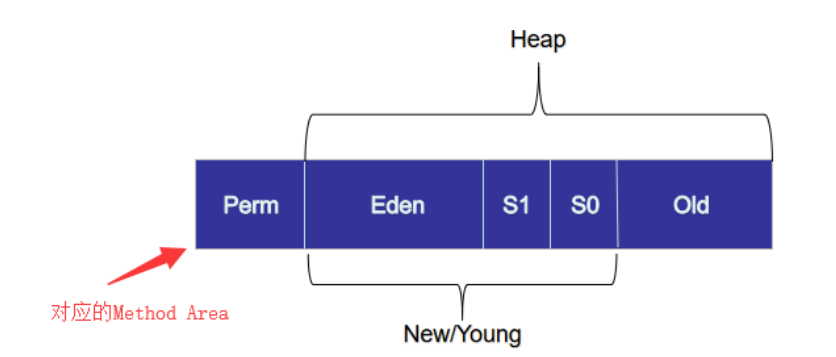 Truth: after research, different objects have different life cycles. 98% of objects in Java are temporary objects.
7.3 permanent area (Perm)
The persistent storage area is a resident memory area used to store the metadata of Class and Interface carried by the JDK itself, that is, it stores
It stores the class information necessary for the running environment. The data loaded into this area will not be collected by the garbage collector, and will not be released until the JVM is closed
The memory occupied by this area.
If java.lang.OutOfMemoryError: PermGen space appears, it indicates that the Java virtual machine sets Perm memory for the permanent generation
Not enough. Generally, this happens when a large number of third-party jar packages need to be loaded for program startup, such as deploying under a Tomcat
Too many applications. Or a large number of classes generated by dynamic reflection are constantly loaded, resulting in the Perm area being filled.
be careful:
Before Jdk1.6: there is a permanent generation, and the constant pool 1.6 is in the method area
Jdk1.7: there is a permanent generation, but it has been gradually "de permanent generation". Constant pool 1.7 is in the heap
Jdk1.8 and later: no permanent generation, constant pool 1.8 in meta space
You can learn JVM garbage collection mechanism only after you are familiar with the three zone structure
In fact, like the heap, the Method Area is a memory area shared by each thread, which is used to store virtual machine loads
Class information + normal constants + static constants + compiler compiled code, although the JVM specification describes the method area as a logical part of the heap
But it also has an alias called non heap, which is to be separated from the heap.
For the HotSpot virtual machine, many developers are used to calling the method area "parent gen", but strictly speaking, in essence
The two are different. In other words, the permanent generation is used to implement the method area. The permanent generation is a part of the method area (equivalent to an interface)
Implementation, in the version of Jdk1.7, the string constant pool originally placed in the permanent generation has been removed.
The Constant Pool is a part of the method area. The Class file contains Class version, field, method and interface description information
In addition, another information is the constant pool, which will be stored in the runtime constant pool of the method area after the class is loaded!

7.3 heap memory tuning
After understanding the basic heap information, we can simply learn the instructions on heap memory tuning! We are based on HotSpot
Proposed, JDK1.8;
JDK1.7:
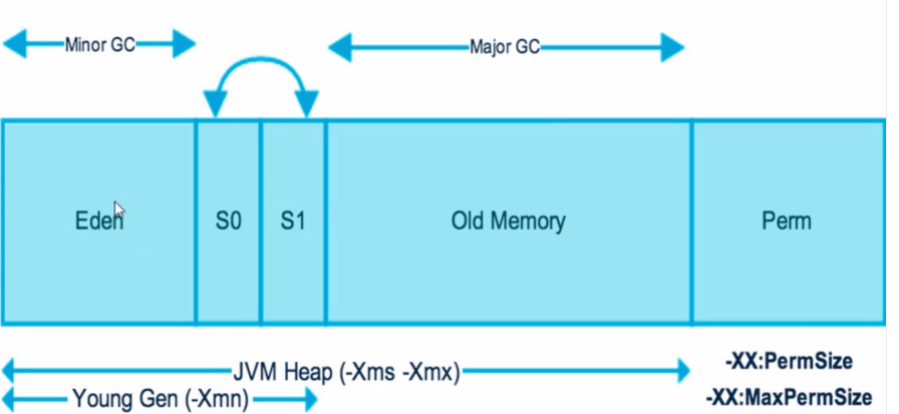
JDK 1.8:
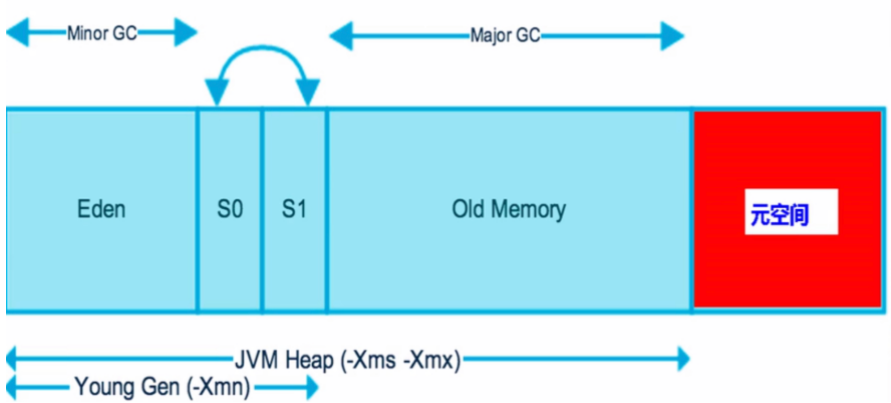
Test for adjusting heap memory size using IDEA
Heap memory tuning
-Xms: sets the initial allocation size, which defaults to "1 / 64" of the physical memory
-Xmx: the maximum allocated memory. The default is "1 / 4" of the physical memory
-20: + printgcdetails: output detailed GC processing logs
Code test:
public class Demo01 {
  public static void main(String[] args) {
    //Returns the maximum amount of memory that the Java virtual machine attempts to use
    long maxMemory = Runtime.getRuntime().maxMemory();
    //Returns the total amount of memory in the Java virtual machine
    long totalMemory = Runtime.getRuntime().totalMemory();
    System.out.println("MAX_MEMORY"+maxMemory+"(byte),"+(maxMemory/(double)1024/1024)+"MB");
    System.out.println("MAX_MEMORY"+totalMemory+"(byte),"+(totalMemory/(double)1024/1024)+"MB");
  }
}
MAX_MEMORY4263510016(byte),4066.0MB
MAX_MEMORY268435456(byte),256.0MB
Set JVM tuning parameters in IDEA, and then start
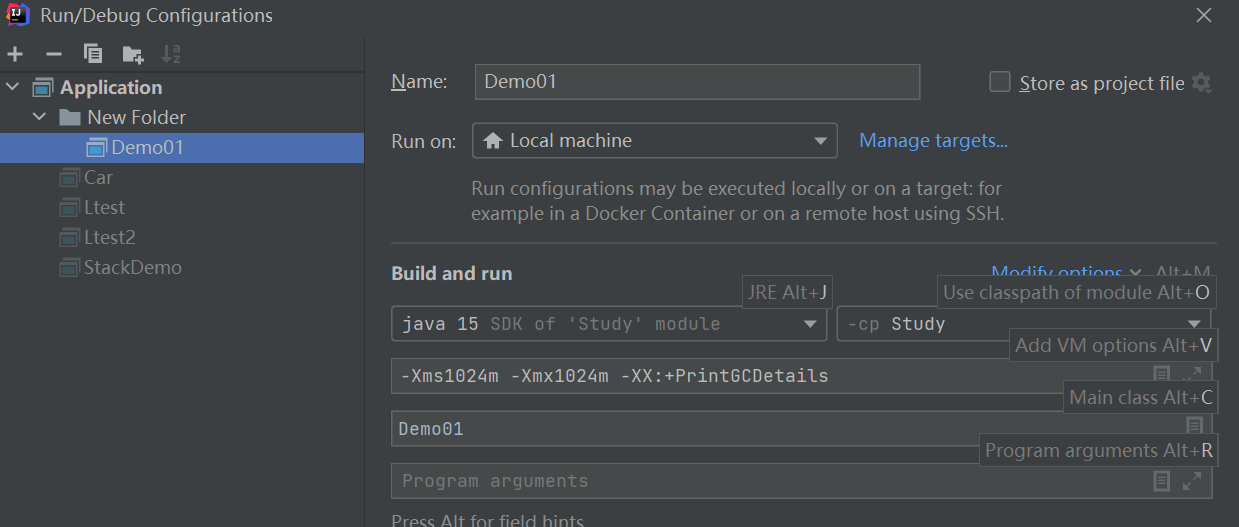
It is found that by default, the allocated memory is 1 / 4 of the total memory, while the initialized memory is 1 / 64!
-Xms1024m -Xmx1024m -XX:+PrintGCDetails
VM parameter tuning: adjust the initial memory and total memory to 1024M, run and view the results!
[0.005s][warning][gc] -XX:+PrintGCDetails is deprecated. Will use -Xlog:gc* instead.
[0.017s][info   ][gc] Using G1
[0.026s][info   ][gc,init] Version: 15.0.1+9-18 (release)
[0.026s][info   ][gc,init] CPUs: 12 total, 12 available
[0.026s][info   ][gc,init] Memory: 16257M
[0.026s][info   ][gc,init] Large Page Support: Disabled
[0.026s][info   ][gc,init] NUMA Support: Disabled
[0.026s][info   ][gc,init] Compressed Oops: Enabled (32-bit)
[0.026s][info   ][gc,init] Heap Region Size: 1M
[0.026s][info   ][gc,init] Heap Min Capacity: 1G
[0.026s][info   ][gc,init] Heap Initial Capacity: 1G
[0.026s][info   ][gc,init] Heap Max Capacity: 1G
[0.026s][info   ][gc,init] Pre-touch: Disabled
[0.026s][info   ][gc,init] Parallel Workers: 10
[0.026s][info   ][gc,init] Concurrent Workers: 3
[0.026s][info   ][gc,init] Concurrent Refinement Workers: 10
[0.026s][info   ][gc,init] Periodic GC: Disabled
[0.027s][info   ][gc,metaspace] CDS archive(s) mapped at: [0x0000000800000000-0x0000000800b50000-0x0000000800b50000), size 11862016, SharedBaseAddress: 0x0000000800000000, ArchiveRelocationMode: 0.
[0.027s][info   ][gc,metaspace] Compressed class space mapped at: 0x0000000800b50000-0x0000000840b50000, size: 1073741824
[0.027s][info   ][gc,metaspace] Narrow klass base: 0x0000000800000000, Narrow klass shift: 3, Narrow klass range: 0x100000000
MAX_MEMORY1073741824(byte),1024.0MB
MAX_MEMORY1073741824(byte),1024.0MB
[0.154s][info   ][gc,heap,exit] Heap
[0.154s][info   ][gc,heap,exit]  garbage-first heap   total 1048576K, used 2048K [0x00000000c0000000, 0x0000000100000000)
[0.154s][info   ][gc,heap,exit]   region size 1024K, 3 young (3072K), 0 survivors (0K)
[0.154s][info   ][gc,heap,exit]  Metaspace       used 1020K, capacity 4550K, committed 4864K, reserved 1056768K
[0.154s][info   ][gc,heap,exit]   class space    used 96K, capacity 405K, committed 512K, reserved 1048576K

Process finished with exit code 0
Prove again that the meta space is not in the virtual machine, but uses local memory.
7.4 Dump memory snapshot
1. IDEA plug-in installation
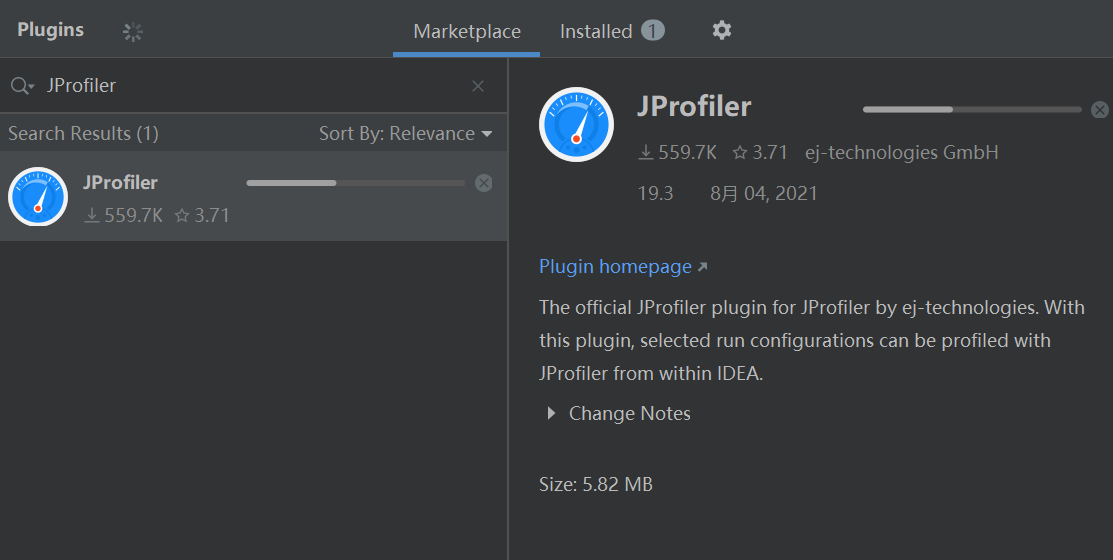
2. Install jpprofile monitoring software
Download address: https://www.ej-technologies.com/download/jprofiler/version_ ninety-two
3. Installation: installation path. It is recommended to select a path with no Chinese and no spaces in the file name, otherwise it will not be recognized. Then keep clicking Next
4. Registration code:
L-Larry_Lau@163.com#23874-hrwpdp1sh1wrn#0620
L-Larry_Lau@163.com#36573-fdkscp15axjj6#25257
L-Larry_Lau@163.com#5481-ucjn4a16rvd98#6038
L-Larry_Lau@163.com#99016-hli5ay1ylizjj#27215
L-Larry_Lau@163.com#40775-3wle0g1uin5c1#0674
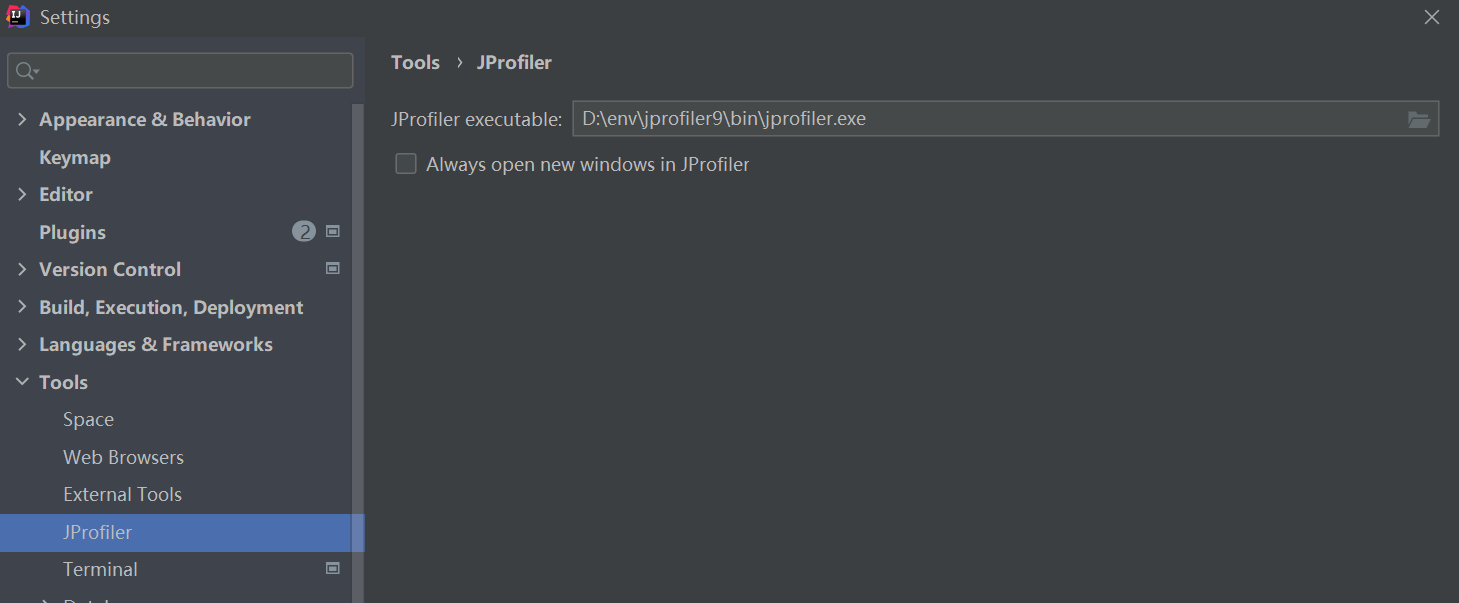
5. Configure the IDEA running environment
Settings – Tools – JProflier – JProflier executable select JProfile to install the executable. (if only one version is installed in the system,
When you start IDEA, save is selected by default
6. Select the project you want to analyze and click the jpprofiler icon to start it. After startup, the jpprofiler window will pop up automatically, where you can monitor
Control your code performance.
Code test:
import java.util.ArrayList;
public class Demo03 {
  byte[] byteArray = new byte[1*1024*1024];//1M=1024K
  public static void main(String[] args) {
    ArrayList<Demo03> list = new ArrayList<>();
    int count = 0;
    try {
      while (true){
        list.add(new Demo03());
        count+=1;
      }
    } catch (Error e) {
      System.out.println("count:" + count);
      e.printStackTrace();
    }
  }
}
VM parameters: - Xms1m -Xmx8m -XX:+HeapDumpOnOutOfMemoryError
java.lang.OutOfMemoryError: Java heap space
Dumping heap to java_pid21432.hprof ...
Heap dump file created [6424272 bytes in 0.010 secs]
count:3
java.lang.OutOfMemoryError: Java heap space
	at Demo03.<init>(Demo03.java:3)
	at Demo03.main(Demo03.java:9)

Process finished with exit code 0
Find java_pid21432.hprof and open it directly. Jpprofiler is used by default.
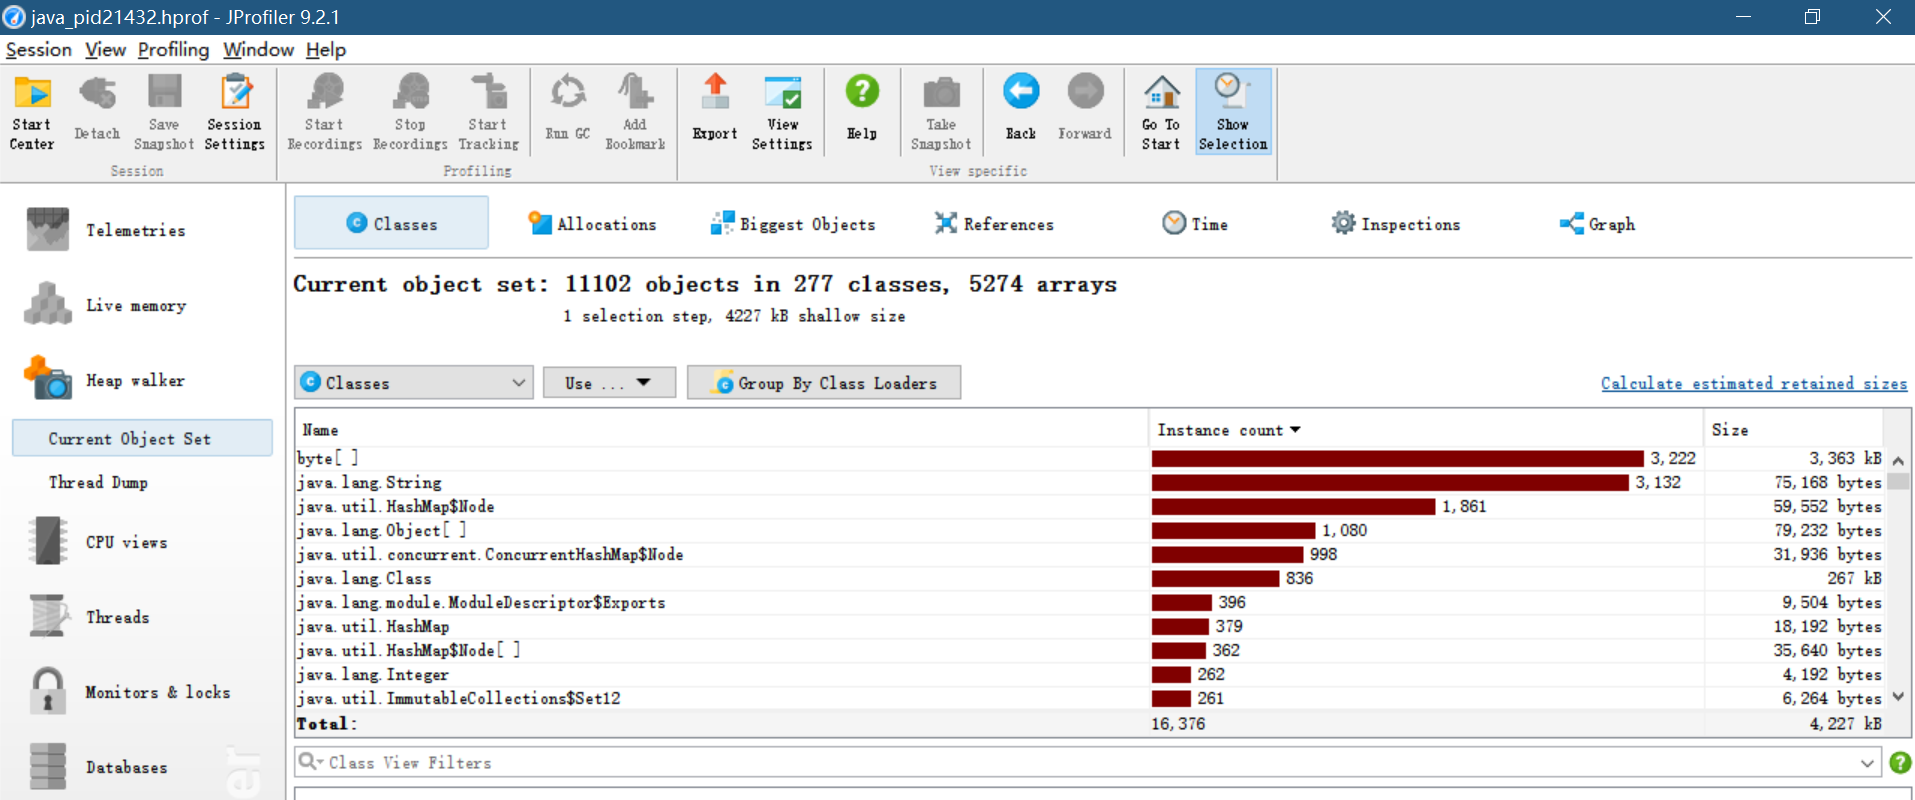
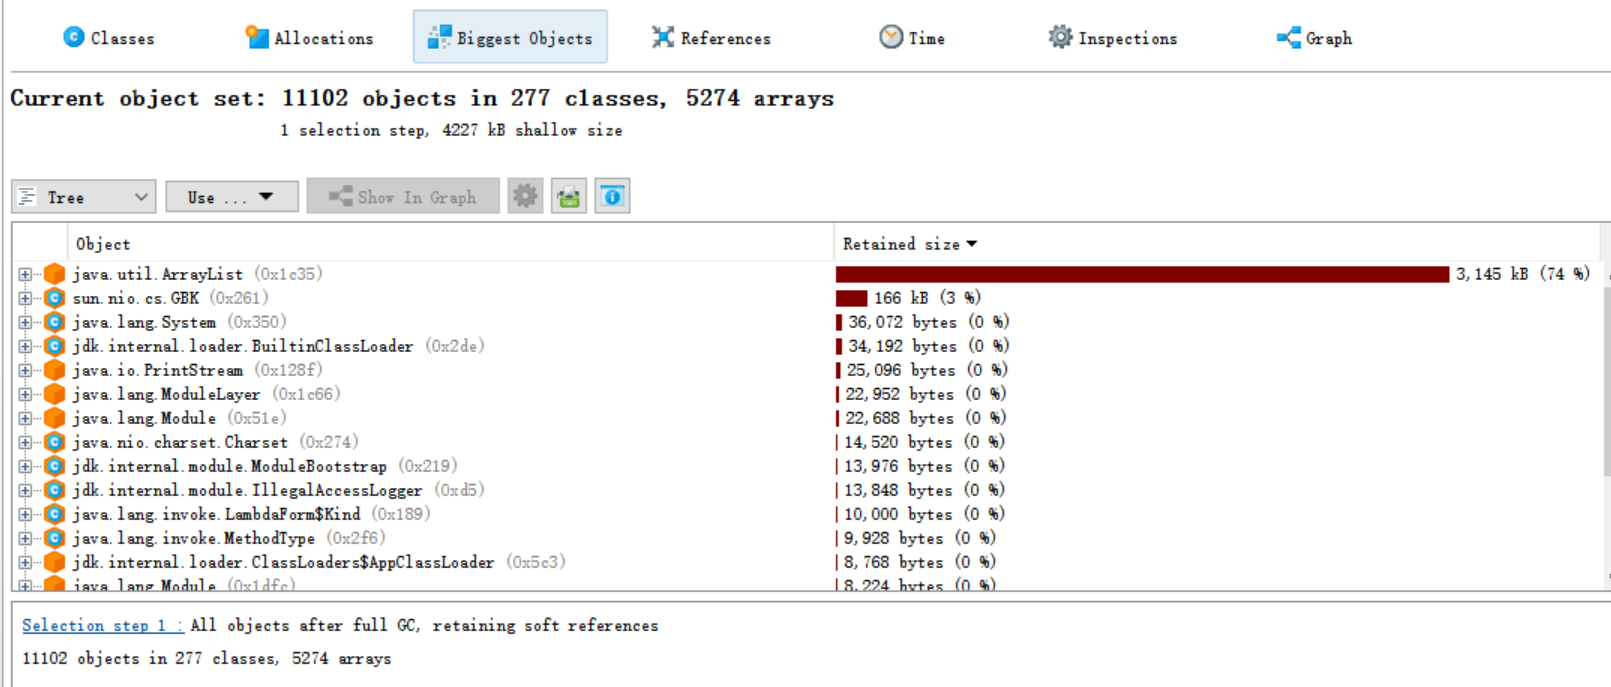
GC details
Sandbox security mechanism
The core of the Java security model is the Java sandbox. What is a sandbox? Sandbox is an environment that restricts the running of programs. Sandbox mechanism is to limit java code to the specific running range of virtual machine (JVM) and strictly restrict the code's access to local system resources. Such measures can ensure the effective isolation of code and prevent damage to the local system. Sandboxes mainly restrict access to system resources. What are the system resources—— CPU, memory, file system, network. Different levels of sandboxes can have different restrictions on access to these resources.
All Java programs can specify sandboxes and customize security policies.
- Security model in java
In Java, the executing program is divided into local code and remote code, * * local code is regarded as trusted by default, while remote code is regarded as untrusted** For the local code of credit granting, you can access all local resources. For non credit remote code, in the early Java implementation, security depended on sandbox mechanism. - JDK1.0 security model
However, such a strict security mechanism also brings obstacles to the function expansion of the program. For example, when users want remote code to access the files of the local system, it cannot be realized.