Galary & API
VegaLite.jl Document Drawing Example: http://fredo-dedup.github.io/VegaLite.jl/stable/index.html
VegaLite official Example Galary: https://vega.github.io/vega-lite/examples/
VegaLite API document (JSON format): https://vega.github.io/vega-lite/docs/
mark characteristics
// Json version
{
  ...
  "mark": {
    "type": ...,       // mark
    ...
  },
  ...
}
# Julia version
@vlplot(
mark={
typ=:..., # Note that you cannot use Julia reserved keyword type
...
}
)In narrow sense, mark refers to the type field under the mark key.
| type | mark -> type | x | y | color | shape | size |
|---|---|---|---|---|---|---|
| Line graph | :line | |||||
| Locus map | :trace | |||||
| Vertical and horizontal maps | :rule | |||||
| Hollow scatter plot | :point | |||||
| Circular solid scatter plot | :circle | |||||
| Square solid scatter plot | :square | |||||
| Text labeling map | :text | text=:var | ||||
| Histogram | :bar | |||||
| histogram | :bar | x={:a, bin=true} | y="count()" | |||
| Thermodynamic charts, filling charts | :rect | x="x:o" | y="y:o" | color=:z | ||
| area plot | :area | |||||
| Strip plot | :tick | x=:x | y="y:o" | |||
| Geographic Map | :geoshape |
Generalized mark includes three parts: type, style and clip.
Detailed mark ing features see: https://vega.github.io/vega-lite/docs/mark.html
Some chestnuts
The following libraries need to be loaded before running the sample code
using VegaLite, VegaDatasetsExample1
dataset("stocks") |>
@vlplot(
    :trail, # Equivalent to mark =: trail is equivalent to mark = {type=: trail}
    x={
        "date:t",
        axis={format="%Y"}
    },
    y=:price,
    size=:price,
    color=:symbol
)
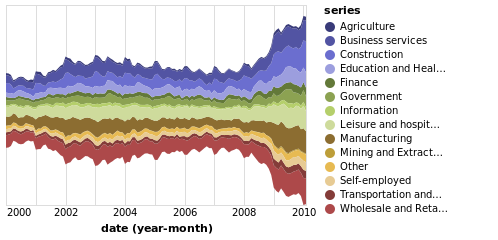
Example2
dataset("unemployment-across-industries") |>
@vlplot(
    :area, # Equivalent to mark =: area is equivalent to mark = {type=: area}
    width=300, height=200,
    x={
        "yearmonth(date)",
        axis={
            domain=false,
            format="%Y",
            tickSize=0
        }
    },
    y={
        "sum(count)",
        axis=nothing,
        stack=:center
    },
    color={
        :series,
        scale={scheme="category20b"}
    }
)
Example3
cars |>
    @vlplot(
        y="Origin:o",
        x="Cylinders:o",
        config={
            scale={bandPaddingInner=0, bandPaddingOuter=0},
            text={baseline=:middle}
        }
    ) +
    @vlplot(
        :rect, # Equivalent to mark=:rect is equivalent to mark={type=:rect}
        color="count()") +
    @vlplot(
        :text, # Equivalent to mark=:text Equivalent to mark={typ=:text}
        text="count()",
        color={
            condition={
                test="datum['count_*'] > 100",
                value=:black
            },
            value=:white
        }
)
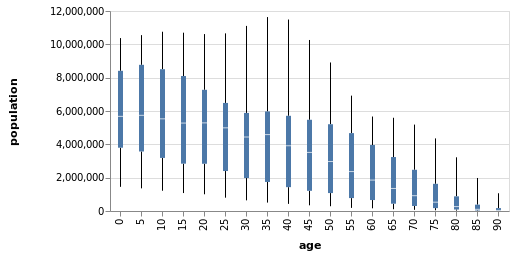
Example4
dataset("population") |>
@vlplot(
    transform=[{
        aggregate=[
            {op=:q1, field=:people, as=:lowerBox},
            {op=:q3, field=:people, as=:upperBox},
            {op=:median, field=:people, as=:midBox},
            {op=:min, field=:people, as=:lowerWhisker},
            {op=:max, field=:people, as=:upperWhisker}
        ],
        groupby=[:age]
    }]
) +
@vlplot(
    mark={:rule, style=:boxWhisker},
    y={"lowerWhisker:q", axis={title="population"}},
    y2="lowerBox:q",
    x="age:o"
) +
@vlplot(
    mark={:rule, style=:boxWhisker},
    y="upperBox:q",
    y2="upperWhisker:q",
    x="age:o"
) +
@vlplot(
    mark={:bar, style=:box},
    y="lowerBox:q",
    y2="upperBox:q",
    x="age:o",
    size={value=5}
) +
@vlplot(
    mark={:tick, style=:boxMid},
    y="midBox:q",
    x="age:o",
    color={value=:white},
    size={value=5}
)
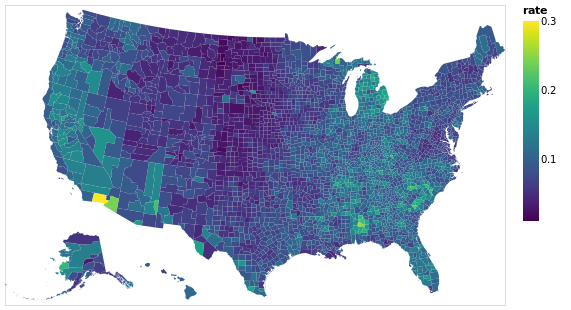
Example5
us10m = dataset("us-10m").path
unemployment = dataset("unemployment.tsv").path

p = @vlplot(
    :geoshape, # mark
    width=500, height=300,
    data={
        url=us10m,
        format={
            typ=:topojson,
            feature=:counties
        }
    },
    transform=[{
        lookup=:id,
        from={
            data=unemployment,
            key=:id,
            fields=["rate"]
        }
    }],
    projection={
        typ=:albersUsa
    },
    color="rate:q"
)